The case-study of East & North-East Region / Macedonia
|
|
|
- Blake Green
- 5 years ago
- Views:
Transcription
 Mrs.")
1 Waste Management Planning according to EU Standards: The case-study of East & North-East Region / Macedonia Mr. Theofanis Lolos (ENVIROPAN S.A.) Mrs. Anna Karanfilova Maznevska (Ministry of Environment and Physical Planning)
2 Project: Preparation of Regional Waste Management Plans and Strategic Environmental Assessments for East and North-East regions This project was funded by the European Union

3 PROJECT OBJECTIVE Project Location: EAST and NORTH-EAST regions EAST REGION Includes 11 municipalities out of 13 municipalities included in the Central East Statistical Region, namely: Stip Probistip Kocani Karbinci Vinica Cesinovo-Oblesevo Zrnovci Makedonska Kamenica Delcevo Pehcevo Berovo NORTH-EAST REGION Includes 6 municipalities, namely: Kumanovo Lipkovo Staro Nagoricane Kratovo Rankovce Kriva Palanka Total Population: 180,938
4 PROJECT OBJECTIVE Project Objective and Results The overall objective of the project is to achieve an integrated and financially self-sustainable waste management system in East and North-East Region of the Beneficiary Country. The project purpose is to support the planning process for an integrated regional waste management system through preparation of Regional Waste Management Plans and Strategic Environmental Assessment (SEA) in East and North-East Region. According to the ToR, the expected results of the Project are: Result nº 1: Prepared Regional Waste Management Plans for the East and North-East Region, approved by the relevant Inter-municipal Public Enterprises for Waste Management in the East and North-East Region. Result nº 2: Prepared Strategic Environmental Assessments for the East and North-East Region and approved by the relevant Inter-municipal Public Enterprises for Waste Management in the East and North-East Region.
 COMPONENT 2 Provision of assistance to Inter-municipal Public Enterprises for Waste Management in the East and")
5 SPECIFIC OBJECTIVES METHODOLOGY WORKPLAN Project Work Plan Project Management (entire duration of project) COMPONENT 1 Preparation of Regional Waste Management Plans in the East and North-East Region (months including public consultation period and preparation of final RWMPs) COMPONENT 2 Provision of assistance to Inter-municipal Public Enterprises for Waste Management in the East and North- East Region for Strategic Environmental Assessment (SEA) for the Regional Waste Management Plans (months 3-15) COMPONENT 3 Stakeholders involvement (entire duration of project)
6 LEGAL FRAMEWORK EU Regulatory Framework Thematic Strategy on Waste Prevention and Recycling Waste Framework Directive (Includes Municipal and Construction Demolition waste) Waste Shipment Regulation Framework Incineration Directive Landfill Directive Recycling Standards (future) Treatment Packaging Batteries WEEE & Restriction of use Vehicles Mining waste Sewage Sludge PCB/ PCT Streams In Brown : with targets
7 LEGAL FRAMEWORK Waste Hierarchy PREVENTION PREPARATION FOR REUSE RECYCLING (COMPOSTING) OTHER RECOVERY DISPOSAL
8 LEGAL FRAMEWORK Targets Packaging waste % 55% min recovery min recycling collection rate ELVs % 85% 100% WEEE % 50% At least 4 kg per capita per year Batteries % to 75% (efficiency) % % Tires 2006 No tires landfill Biodegradable diversion 2006 Reduction 75% of the quantities that where produced during Reduction 50% of the quantities that where produced during Reduction 35% of the quantities that where produced during 1995 New targets 2015 Separate collection: at least paper, metal, plastic and glass (Article /98/ΕU) % Municipal waste % Construction & Demolition waste
 60% 60% 50% 22.")
9 The Law on Packaging and Packaging Waste (2009) (LoPPW) Activity/Waste Stream Target To be achieved by Packaging waste Materials from the packaging waste Glass Paper and Cardboard Metals Plastic Wood Recycling (min 55%-max 80%) 60% 60% 50% 22.5% 15% Other recovery Targets for diversion of BMW from landfill Year Quantity of BMW that is allowed to be disposed on Landfill on the whole territory (t) ,000 62% Quantity of BMW landfilled, expressed as a mass percentage of MSW generated in ,000 47% 25% ,000 31% 50% ,000 22% 65% Reduction of the quantity of BMW landfilled, expressed as a percentage reduction of the BMW generated in
10 Technology and infrastructure Existing waste management system and coverage in East Region Collection and transportation Treatment and disposal Recycling and Recovery The collection system is not source-separated The 11 municipal landfills, do not comply with EU requirements. There are also 71 uncontrolled dumpsites There are no formal recycling and recovery operations. The waste management system is based mainly on waste collection and disposal. According the received questionnaires the percentage of the population that receives a regular service ranges from 38% (Cesinovo-Oblesevo) to 100% (Sthip and Pehcevo) Stakeholder Participation Role of waste generators Role of private sector for waste management services and for recycling and recovery Public awareness activities In Sthip (from questionnaire), 38,8 t of paper (50% from institutions/commerce) up to 8/1/2013 were collected and handled from the Collective Scheme PAKOMAK In Sthip, the company MINOL, which purchases industrial waste oils from Sthip and other areas in the vicinity, had collected in ,000 kg waste oil. Also the company IVAL TRADE Ltd purchases old car batteries and WEEE. The municipality of Berovo has established a PPP with a local firm for PET bottles collection in 4 settlements of the municipality. Most of the awareness events take place in the City of Skopje and there few at regional/local level
11 Existing waste management system and coverage in North-East region Technology and infrastructure Collection and transportation Treatment and disposal Recycling and Recovery The collection system is not source-separated The 5 municipal landfills, do not comply with EU requirements. There are also 36 uncontrolled dumpsites There are no formal recycling and recovery operations. In Staro Nagoricane (from questionnaire) the collection of packaging waste is performed by a recovery organisation with 5 containers The waste management system is based mainly on waste collection and disposal. According the received questionnaires the percentage of the population that receives a regular service ranges from 20% (Staro Nagoricane) to 100% (Kratovo) Stakeholder Participation Role of waste generators Public awareness activities No data were available in the received questionnaires Most of the awareness events take place in the City of Skopje and there few at regional/local level
12 East Region/Waste Production Factor Year 2012 Berovo Cesinovo Oblesevo Delchevo Karbinci Kocani M. Kamenica Pehcevo Probisthip Sthip Vinica Zronvci Total Total Pop. Served Pop. Total Pop. Served Collecte d Waste (t/y) 13,181 7,125 16,673 4,040 38,058 7,729 5,068 15,480 48,578 19,521 3, ,551 80% 38% 80% 79% 95% 91% 100% 90% 100% 71% 90% 88% 10,545 2,708 13,338 3,192 36,155 7,033 5,068 13,932 48,578 13,860 2, ,197 4, ,044 1,170 8, ,392 4,124 10,688 2, ,955 Waste Product ion(t) Waste Prod. Factor t/ca/y Waste prod. Factor kg/ca/d 5,184 1,355 5,054 1,481 9, ,392 4,582 10,688 3, ,

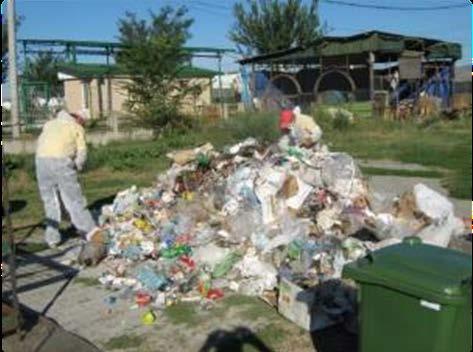
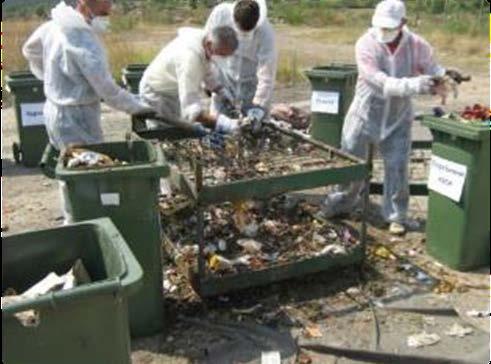
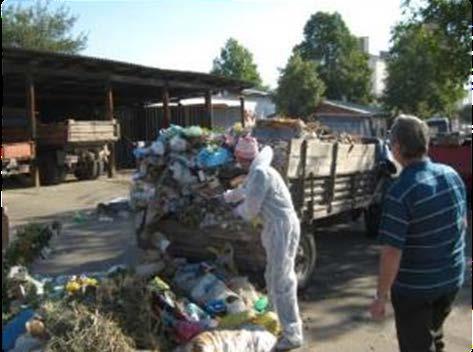
13 Waste analysis
 Tetrapack 9,15% Plastic packaging waste Plastic bags PET bottles 1,04% 0,65% 4,33% 5,94% 36,60% Other Plastic Textile Leather 0,19% Diapers 0,63% 3,07% Wood Construction and demolition")
14 Qualitative waste composition for East Region 2,79% 0,85% 0,07% 1,39% 0,06% 0,29% 3,59% 0,25% 9,58% 17,13% Garden Waste Other Biodegradable Waste Paper Cardboard Glass Metals (Ferous) 2,40% Aluminum (non-ferous) Tetrapack 9,15% Plastic packaging waste Plastic bags PET bottles 1,04% 0,65% 4,33% 5,94% 36,60% Other Plastic Textile Leather 0,19% Diapers 0,63% 3,07% Wood Construction and demolition material WEEE Hazardous materials Fine Fraction (<20mm)
15 North-East Region/Waste Production Factor Year 2012 KUMANOVO KRATOVO RANKOVCE LIPKOVO STARO NAGORICANE KRIVA PALANKA Total Total Population Served Population Total Population Served 108,048 9,695 3,826 29,519 4,215 20, ,560 76% 100% 70% 50% 20% 80% 72% 82,116 9,695 2,678 14, , ,298 Collected Waste (t/y) 25,167 2, , ,059 35,828 Waste Production (t) 33,114 2,661 1,182 5,566 1,654 5,073 49,251 Waste Production Factor t/ca/y Waste Production Factor kg/ca/d
 Aluminum (non-ferrous) Tetra Pak Plastic packaging waste Plastic bags РЕТ bottles Other plastic 2,16% 0,83% 0,48% 0,57% 3,63% 4,32% 2,84% Textile")
16 Qualitative waste composition for North East Region TOTAL COMPOSITION/NORTH EAST REGION Garden waste Other biodegradable waste 0,11% 0,32% 0,03% 2,61% 10,25% 11,21% Paper Cardboard 0,41% 4,47% Glass 1,45% 5,84% 4,36% 6,11% 38,01% Metals (ferrous) Aluminum (non-ferrous) Tetra Pak Plastic packaging waste Plastic bags РЕТ bottles Other plastic 2,16% 0,83% 0,48% 0,57% 3,63% 4,32% 2,84% Textile Leather Diapers Wood Construction and demolition material WEEE Hazardous materials Fine fraction (<20 mm)
17 WASTE MANAGEMENT SCENARIOS Four alternative waste management scenarios have been examined within the scope of this project and presents via a flow diagram. All the proposed scenarios include collection of WEEE, collection of Hazardous material fraction, Collection of C&D material, Collection of small amounts of recycling materials. All these fractions collected in Green Points. In East Region was assumed that will constructed in total 9 Green Points and in North-East Region was assumed that will constructed in total 7 Green Points. All the proposed scenarios include separate collection of green/garden waste. All the proposed scenarios include either Sorting at Source of Packaging Waste or Sorting at Source of recyclable waste. All the proposed scenarios include a collection system, such as one bin collection system, two bin collection system, three bin collection system. Some scenarios include Home Composting Facility. Especially regarding the Waste-to-Energy technology (Incineration plant), the two Regions examined as a unified Region. 17
18 Waste Collection Green Points Home Composting Mixed Bin Treatment 1a (MBT) Scenario 1 (1bin) 1b (Incineration) One Bin collection system Scenarios Overview Scenario 2 (2 bins) Mixed & Biowaste 2 (MRF & AC) Two Bin collection system (Organic Waste Bin and Mixed Bin) 3a (MRF & AC) Scenario 3 (2 bins) Mixed & Recyclables 3b (MRF & MBS & AC) 3c (MRF & Inc. Two Bin collection system (Recyclable Waste Bin and Mixed Bin) Scenario 4 (3 bins) Mixed, Recyclables & Biowaste 4 (MBT & MRF & AC) Three Bin collection system MBT with AC Inc. Dirty MRF Disposed to Landfill MBS Inc. Disposed to Landfill Recyclable waste bin treatment Clean MRF Clean MRF Clean MRF Clean MRF Organic waste bin treatment - - AC AC Green waste treatment AC Inc. AC AC AC Inc. AC Landfill Inc.: Incineration MBS: Mechanical Biological Stabilization AC: Aerobic Composting
19 Scenario 1a/East Region 19
20 Scenario 1b/East and North-East Regions 20
21 Scenario 2/North-East Region 21
22 Scenario 3a/East Region
23 Scenario 3b/East Region
24 Scenario 3c/North-East and East Regions 24

25 Scenario 4/North-East Region
26 Green House Gas Emissions for all the waste management scenarios East Region Net (Debits+Credits) Recycled waste (t CO 2 -eq/yr) Disposed waste (t CO 2 -eq/yr) Total MSW (t CO 2 -eq/yr) North-East Region Net (Debits+Credits) Recycled waste (t CO 2 -eq/yr) Disposed waste (t CO 2 -eq/yr) Total MSW (t CO 2 -eq/yr) Scenario 1a Scenario 1b Scenario 2 Scenario 3a Scenario 3b Scenario 3c Scenario 4-2,242-4,244-2,357-5,513-5,513-12,390-5,628-12,331-1,146-8,184 50,399-13,977-6,266 28,980-14,574-5,389-10,542 44,885-19,490-18,656 23,352 Scenario 1a Scenario 1b Scenario 2 Scenario 3a Scenario 3b Scenario 3c Scenario 4-3,320-4,244-3,453-6,977-6,977-12,390-7,109-14,744-1,146-9,983 57,584-16,859-6,266 33,560-18,064-5,389-13,436 50,607-23,836-18,656 26,451
27 Fulfillment of Targets for East Region Targets for LoPPW/Scenarios 1a 1b 2 3a 3b 3c 4 Total % of recycling of Packaging Waste 55.26% 24.34% 55.26% 56.44% 57.31% 56.31% 56.44% % Glass 63.31% 50.19% 63.31% 60.10% 60.10% 60.10% 60.10% % Plastic (year 2018) 44.11% 9.02% 44.11% 25.55% 25.55% 25.55% 25.55% % Paper 63.71% 40.58% 63.71% 60.96% 60.96% 60.96% 60.96% % Fe 88.66% 18.01% 81.89% 54.70% 84.16% 54.70% 54.70% % Al 81.89% 18.01% 81.89% 54.70% 84.16% 54.70% 54.70% Targets for diversion of BMW from landfills/scenarios Reduction of the quantity of BMW landfilled, expressed as a percentage reduction of the BMW generated in 1995 (Year 2020) Reduction of the quantity of BMW landfilled, expressed as a percentage reduction of the BMW generated in 1995 (Year 2027) 1a 1b 2 3a 3b 3c % 100% 71.38% 15.43% 84.50% 100% 67.17% 96.43% 97.44% 69.83% 10.84% 83.65% 97.25% 65.39% Fulfillment of targets Yes No Yes No Yes Yes Yes
28 Fulfillment of Targets for North-East Region Targets for LoPPW/Scenarios 1a 1b 2 3a 3b 3c 4 Total % of recycling of Packaging Waste 55.27% 24.34% 55.27% 56.19% 57.31% 56.31% 56.19% % Glass 63.31% 50.19% 63.31% 60.10% 60.10% 60.10% 60.10% % Plastic (year 2018) 44.23% 9.02% 44.23% 25.55% 25.55% 25.55% 25.55% % Paper 64.60% 40.58% 64.60% 60.96% 60.96% 60.96% 60.96% % Fe 88.66% 18.01% 88.66% 54.70% 84.16% 54.70% 54.70% % Al 81.89% 18.01% 81.89% 54.70% 84.16% 54.70% 54.70% Targets for diversion of BMW from landfills/scenarios Reduction of the quantity of BMW landfilled, expressed as a percentage reduction of the BMW generated in 1995 (Year 2020) Reduction of the quantity of BMW landfilled, expressed as a percentage reduction of the BMW generated in 1995 (Year 2027) 1a 1b 2 3a 3b 3c % 100% 70.06% 11.34% 85.53% 100% 68.77% 96.13% 97.44% 67.45% 3.63% 84.28% 97.25% 66.06% Fulfillment of targets Yes No Yes No Yes Yes Yes
29 Capacities of treatment facilities East Region Capacities/East Region (t/y) 1a 1b 2 3a 3b 3c 4 Clean MRF ,011 9,011 19,447 - Dirty MRF , Aerobic Composting for organic waste bin MBT Plant for mixed waste bin MBS plant for residual waste bin , ,814 42, , Incineration - 103,952 89,533 - Biological treatment for green waste (windrow composting) 3,494-3,494 3,494 3,494-3,494 Landfill (residues m 2 ) 32,000 52,000 41,000 79,000 66,000 50,000 54,000 29
30 Capacities of treatment facilities North-East Region Capacities/North-East Region (t/y) 1a 1b 2 3a 3b 3c 4 Clean MRF ,416 10,416 10,416 - Dirty MRF , Aerobic Composting for organic waste bin MBT Plant for mixed waste bin MBS plant for residual waste bin , ,188 50, , Incineration - 103,952 89,533 - Biological treatment for green waste (windrow composting) 2,688-2,688 2,688 2,688-2,688 Landfill (residues m 2 ) 40,000 52,000 49,500 93,500 79,500 50,000 65,000 30
31 FINANCIAL DATA OF THE ALTERNATIVE EVALUATED SCENARIOS Investment Cost for Each Scenario East and North-East Region North East Region Cost of acquisition of land ( ) Grand total ( ) Cost of acquisition of land ( ) East Region Grand total ( ) Scenario 1a ,217 15,127,902 Scenario1b ,127 94,888,459 Scenario ,579 13,609,541 Scenario 3a ,616 13,915,905 Scenario 3b ,204 17,046,046 Scenario 3c ,066 91,116,926 Scenario ,419 13,315,934
32 FINANCIAL DATA OF THE ALTERNATIVE EVALUATED SCENARIOS Dynamic Prime Cost (DPC) East and North-East Region Taking into account the categories of operating costs and revenues (described in previous slides) and the generated waste quantities for the period , then it is determined the Dynamic Prime Cost (DPC) for each scenario. An overview of DPC results are presented in the following table. Scenario North East Region DPC ( /t) East Region DPC ( /t) Scenario 1a Scenario1b Scenario Scenario 3a Scenario 3b Scenario 3c Scenario
33 FINANCIAL DATA OF THE ALTERNATIVE EVALUATED SCENARIOS TARRIF PLAN East and North-East Region Taking into account the aforementioned for the present project, the tariffs to the users of the project are proposed to be as follows: The tariffs for Economic units are considered from the first year of operation to be equal to the DPC The tariffs for Residential Users are taken so as to cover the net operating costs of the project. Residential users ( /t) Economic units ( /t) North-East East North-East East Scenario 1a Scenario1b Scenario Scenario 3a Scenario 3b Scenario 3c Scenario
34 FINANCIAL DATA OF THE ALTERNATIVE EVALUATED SCENARIOS Affordability / East and North-East Region For the residentialusers is calculated the value of affordability as % of the average annual income as % of the lowest decile income According to the statistical data, the average annual income per household in the country for 2012 is MKD. As data for income in the region is not provided, an average annual income per household for the North East Region is estimated, considering GDP per capita in North East region. GDP per capita for the North East Region is 65.2% of the average country GDP, while for the East Region is estimated, considering GDP per capita in East region. GDP per capita for the East Region is 93% of the average country GDP Based on this assumption, the average annual income per household for North East and East Region is calculated at 3.480,19 and at 4.964,07 respectively the lowest decile income for North East and East Region is calculated at 736,78 /y and 1.050,93 /y respectively Waste tarrif as a % of lowest decile HH income Waste tarrif as a % of average HH income North-East Region East Region North-East Region East Region Scenario 1a 3.93% 2.20% 0.83% 0.47% Scenario1b 10.98% 5.84% 2.33% 1.24% Scenario % 2.13% 0.80% 0.45% Scenario 3a 2.46% 1.41% 0.52% 0.30% Scenario 3b 2.92% 1.66% 0.62% 0.35% Scenario 3c 10.65% 5.66% 2.26% 1.20% Scenario % 1.60% 0.59% 0.34%
35 Groups of criteria and individual criteria that was examined Legislative Environmental Technical Financial (A1) Compatability with European Legislation and the Objectives of the applicable Solid Waste Legislation (B1) Air pollution. Emissions of gaseous pollutants within EU limits (C1) Adaptability of the process towards the future volume fluctuation and quality of waste (D1) Construction cost-investment cost (A2) Compatability with National Strategy regarding the Solid Waste Management (B2) Pollution of soil, groundwater and surface water. Emissions within EU limits (C2) Proven technology quarantee of operational excellence for representative quantities and capacities of waste management (D2) Net operational cost (A3) Compatibility with procurement procedures under EU rules (B3) Odors (C3) Need of skilled personnel for implementation/operation of the selected technology (D3) Economic sustainability of the technology (B4) Noise (C4) Existence of a market for the use of the finished product (B5) Ability to identify appropriate locations for the sitting of facilities-aesthetics (C5) Exploitation-Energy efficiency (B6) Mitigation measures in the environment (C6) Management of by-products (C7) Employment of local population
36 Ranking of the alternative scenarios/results of MCA analysis Each criterion was quantified according to each performance for each alternative scenarios All the criteria are benefit criteria, that is, the higher the score the better the performance is All of the criteria are evaluated on a scale from 1-10 Weighting Scenario A: Equal value of all the groups of criteria Weighting Scenario B: Focus on the technological-economic criteria Weighting Scenario C: Focus-legislative environmental criteria
37 Results of scenarios comparative evaluation Considering all the elements which have been presented in various chapters of this study namely: Requirements of the EU and National Legislation regarding waste management and the achievement of targets for prevention and reduction of waste production and recycling in all scenarios The characteristics of the treatment and disposal methods The detailed presentationand design of projects and alternative management scenarios The financialdetails of alternative management scenarios Benchmarkingand ratingof alternative scenarios Based on the environmental and legislative requirements, scenario 3b is the most preferred one.
38 Scenario 3b/East Region
39 MRF, MBS, landfill, Transfer station Quantities Analytical Financial Data of Scenario 3b for East Region Investment cost MRF 9,011 t/y 901,100 MBS 35,761 t/y 4,291,320 Landfill (phase A) 25,579 m 2 2,302,092 Landfill (Total) 66,301 m 2 5,967,084 Infrastructure works Transfer station Total (with A phase of landfill) - 500, ,000 8,494,512 Total 12,159,504 Collection equipment Mixed waste bins (1.1 m 3 bins) Collection vehicles for mixed waste Home composting bins (0.2 m 3 bins) Recyclable waste bins (1.1 m 3 bins) Recyclable waste bins (0.12 m 3 bins) Trucks for green waste Quantities Investment cost 1, , ,000 4, ,000 1, ,280 5, , ,000 Total 2,361,818 Intangible components/acqui sition of land TA& supervision 750,000 Publicity 50,000 Public utility works 300,000 Acquisition of land 425,204 Green points Investment cost (9 green points) 720,000 Aerobic Composting for organic and green waste Biological treatment for organic and green waste (total) Quantities Investment cost Total 1,525,204 Investment cost 3,494 t 279,520
40 MRF, MBS, landfill, Transfer station Analytical Financial Data of Scenario 3b for North-East Region Quantities Investment cost MRF 10,416 t/y 1,041,600 MBS 43,008 t/y 5,160,960 Landfill (phase A) 29,721 m 2 2,674,883 Landfill (Total) 79,523 m 2 7,157,088 Infrastructure works Transfer station Total (with A phase of landfill) - 500, ,000 9,877,443 Total 14,359,648 Collection equipment Mixed waste bins (1.1 m 3 bins) Collection vehicles for mixed waste Home composting bins (0.2 m 3 bins) Recyclable waste bins (1.1 m 3 bins) Recyclable waste bins (0.12 m 3 bins) Trucks for green waste Quantities Investment cost 1, , ,430,000 4, ,000 1, ,800 6, , ,000 Total 2,858,012 Intangible components/acqui sition of land TA& supervision 750,000 Publicity 50,000 Public utility works 300,000 Acquisition of land 478,093 Green points Investment cost (7 green points) 560,000 Aerobic Composting for organic and green waste Biological treatment for organic and green waste (total) Quantities Investment cost Total 1,578,093 Investment cost 2,688 t 215,040
41 Action Plan may be divided into the following periods Proposed Action Plan 1. Priority measures for a period of up to three years ( ) 2. Short term measures for a period of up to five years (-2019) 3. Medium term measures for a period of six to ten years ( ) 4. Long term measures for a period longer than ten years (-2042) 1 st period : The maturation of the priority projects will take place and the raising of public awareness will commence 2 nd period : Supply of the main collection equipment i.e. collection vehicles and bins. Initiation of construction of priority infrastructures, continuation of raising of public awareness through campaigns Completion of construction of priority infrastructures (landfill for residues-cell A, Material Recovery Facility, Green Points, Transfer station, MBS plant). Review of the Regional Waste Management Plan, implementation of any required additional investments, which may be pending or determined in the revised RWMP, closure and rehabilitation of the non conforming landfills and dumpsites. The remediation procedure will be applied according to the remediation plan, i.e. very high-risk landfills and dumpsites are first priority and the remediation of existing high-risk and medium risk landfills and illegal dumpsites will follow. Public awareness campaigns on waste management and waste prevention. Implementation of bundle of measures for waste prevention. Review of the Regional Waste Management Plan. Construction of second landfill cell for residues. Substitution of old waste collection, transportation and treatment equipment, review of RWMP, implementation of any required additional investments (according to revised RWMP). Construction of third landfill cell for residues.

42 Thank you for your attention Theofanis Lolos Tel