Wind Energy Update. Larry Flowers National Wind Technology Center, NREL Arizona - September, 2009
|
|
|
- Kerrie Caldwell
- 5 years ago
- Views:
Transcription


1 Wind Energy Update Larry Flowers National Wind Technology Center, NREL Arizona - September, 2009

2

")
3 Installed Wind Capacities ( 99 09) *Preliminary data
4 Annual Capacity (MW) Cumulative Capacity (MW) Four Years of Strong Growth: 2008: 8,558 MW Added; $16 billion Investment 9,000 8,000 7,000 Annual US Capacity (left scale) Cumulative US Capacity (right scale) 27,000 24,000 21,000 6,000 18,000 5,000 15,000 4,000 12,000 3,000 9,000 2,000 6,000 1,000 3, Wind Market Report; LBL

5 Geographic Spread of Wind Projects in the United States Is Reasonably Broad
6 Texas Easily Led Other States in Both Annual and Cumulative Capacity Annual Capacity (2008, MW) Cumulative Capacity (end of 2008, MW) Estimated Percentage of In-State Generation Texas 2,671 Texas 7,118 Iowa 13.3% Iowa 1,600 Iowa 2,791 Minnesota 10.4% Minnesota 456 California 2,517 South Dakota 8.8% Kansas 450 Minnesota 1,753 North Dakota 7.1% New York 407 Washington 1,447 Kansas 6.7% Wyoming 388 Colorado 1,068 Colorado 6.6% North Dakota 370 Oregon 1,067 Oregon 5.4% Wisconsin 342 Illinois 915 Texas 5.3% Washington 284 New York 832 New Mexico 4.5% West Virginia 264 Oklahoma 831 Wyoming 4.1% Illinois 216 Kansas 815 Washington 3.9% Oregon 185 North Dakota 714 Oklahoma 3.7% Oklahoma 142 Wyoming 676 Montana 3.4% Indiana 131 New Mexico 497 California 3.1% Michigan 127 Wisconsin 395 Hawaii 2.2% Montana 125 Pennsylvania 361 Idaho 1.6% Missouri 106 West Virginia 330 New York 1.4% South Dakota 89 Montana 272 Illinois 1.4% California 89 South Dakota 187 Wisconsin 1.3% Pennsylvania 67 Missouri 163 West Virginia 0.9% Rest of U.S. 52 Rest of U.S. 622 Rest of U.S. 0.2% TOTAL 8,558 TOTAL 25,369 TOTAL 1.8% Source: AWEA project database, EIA, Berkeley Lab estimates 13 states had >500 MW of wind capacity at the end of 2008 (7 had >1000 MW, 3 had >2500 MW) 2 states (IA and MN) have in-state wind generation that exceeds 10% of total in-state generation (6 other states exceed 5%)
7 Denmark Spain Portugal Ireland Germany Greece Netherlands India Austria UK Italy U.S. France Australia Sweden Brazil Turkey Canada China Japan TOTAL Projected Wind Generation as a Proportion of Electricity Consumption U.S Lagging Other Countries in Wind As a Percentage of Electricity Consumption 22% 20% 18% 16% 14% 12% 10% 8% 6% 4% 2% Approximate Wind Penetration, end of 2008 Approximate Wind Penetration, end of 2007 Approximate Wind Penetration, end of % Note: Figure only includes the 20 countries with the most installed wind capacity at the end of 2008
8 Annual Capacity Additions (GW) Wind Is a Major Source of New Generation Capacity Additions: Wind Contributed 42% of New Additions in the US in % wind Other non-renewable 60 3% wind Coal 50 4% wind Gas (non-ccgt) Gas (CCGT) % wind 2% wind Other renewable Wind 20 12% wind 18% wind 35% wind 42% wind Wind was the 2 nd -largest resource added for the 4 th -straight year
9 Nameplate Capacity (GW) Nearly 300 GW of Wind in Transmission Interconnection Queues 300 Entered Queue in 2008 Total in Queue at end of Twice as much wind as next-largest resource (natural gas) in queues Wind Natural Gas Coal Nuclear Solar Other MISO (64 GW), ERCOT (52 GW), SPP (48), and PJM (43 GW) account for >70% of total wind in queues Not all of this capacity will be built.

10 Drivers for Wind Power Declining Wind Costs Fuel Price Uncertainty Federal and State Policies Economic Development Public Support Green Power Energy Security Carbon Risk
11 Installed Project Cost (2008 $/kw) Installed Project Costs Rose Substantially, After a Long Period of Decline 4,500 4,000 3,500 3,000 Individual Project Cost (283 online projects totaling 18,641 MW) Capacity-Weighted Average Project Cost Polynomial Trend Line 2,500 2,000 1,500 1, Increase of ~$700/kW Sample of 3,600 MW of projects proposed for construction in 2009 (not shown in graphic) are ~$205/kW higher still (averaging ~$2,120/kW)

12 2008 Wind Market Report; LBL As a Result of Foregoing Trends, Wind Prices Have Been Rising Since Wind power prices bottomed out with projects built in Projects built in 2008 are ~$15-20/MWh higher on average
13 2008 $/MWh Wind Has Been Competitive with Wholesale Power Prices in Recent Years Wind project sample includes projects built from Nationwide Wholesale Power Price Range (for a flat block of power) Cumulative Capacity-Weighted Average Wind Power Price (with 25% and 75% quartiles) projects 62 projects 80 projects 98 projects 117 projects 145 projects 2,268 MW 3,069 MW 4,083 MW 5,165 MW 7,654 MW 9,873 MW Wholesale price range reflects flat block of power across 23 pricing nodes Wind power prices include sample of projects built from
14 2008 $/MWh Even Among More-Recent Projects, Wind Was Competitive in Most Regions in Wind project sample includes projects built from Average 2008 Wholesale Power Price Range (by region) 2008 Capacity-Weighted Average Wind Power Price (by region) Individual Project 2008 Wind Power Price (by region) Texas Heartland Mountain Northwest Great Lakes California East New England Total US 2 projects 28 projects 10 projects 5 projects 6 projects 3 projects 4 projects 2 projects 60 projects 241 MW 2,133 MW 1,115 MW 831 MW 713 MW 233 MW 170 MW 29 MW 5,465 MW Note: Within a region there are a range of wholesale power prices because multiple wholesale price hubs exist in each area (see earlier map)
15 2008$/MWh Source: LBL Comparative Generation Costs Average Price of Wind Power With PTC Wholesale Price Range for Flat Block of Power Operating Cost of Natural Gas Combined Cycle 0
16 Soaring Demand Spurs Expansion of U.S. Wind Turbine Manufacturing
17 2006$/MWh CO 2 prices significantly increase the cost of coal Levelized Cost of Electricity (2010) vs. CO2 Price Coal PC Coal IGCC Coal IGCC w/ccs Gas CC Nuclear Wind Class 6 Wind Class 4 Wind Offshore Class Carbon Price ($/ton CO2)

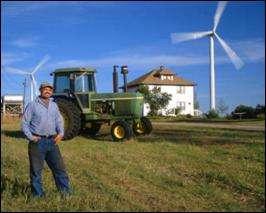
18 Economic Development Opportunities Land Lease Payments: 3-5% of gross revenue $ /MW/year Local property tax revenue: 100 MW often brings in on the order of $500K-$1 million/yr jobs/ 100 MW during construction 6-8 permanent O&M jobs per 100 MW Local construction and service industry: Foundations, roads-- often done locally Investment as Equity Owners: production tax credit, accelerated depreciation, project revenues Manufacturing and Assembly plants expanding in U.S.-- single most significant economic development opportunity
 Landowner payments: $2 million/year, $65 million over 30-year period 300 350 workers during peak construction (80% local) 16 18 O&M positions Total annual tax payments:")
19 Peetz Table Wind Energy Center, CO MW (1.5-MW turbines) Landowner payments: $2 million/year, $65 million over 30-year period workers during peak construction (80% local) O&M positions Total annual tax payments: $2.3 million/year (10% of total county budget); $70 million over 30 years Located near Peetz, CO Owned by FPL Energy Constructed in 2007
 Landowner payments: $300,000 in annual lease payments 150 workers during peak construction 6 fulltime O&M positions Property taxes: $17 million")
20 Weatherford Wind Energy Center, OK 147 MW (1.5-MW turbines) Landowner payments: $300,000 in annual lease payments 150 workers during peak construction 6 fulltime O&M positions Property taxes: $17 million over 20 years Sawartzky Construction received $300,000 in revenue from the project Owned by FPL Energy Constructed in 2005
21 21 Jobs and Economic Impacts from the JEDI Model 1,000 MW of New Wind Power in Arizona JEDI Model Version W e Project Development & Onsite Labor Impacts Landowner Revenue: $3 million/year Local Property Taxes: $6.2 million/year Construction Phase: 509 new jobs $42.7 million to local economies Operational Phase: 51 new jobs $3.8 M/year to local economies Local Revenue, Turbine, & Supply Chain Impacts Construction Phase: 3,109 new jobs $423.3 million to local economies Operational Phase: 81 new jobs $17.6 million/year to local economies Induced Impacts Construction Phase: 1,290 new jobs $147.6 million to local economies Operational Phase: 68 new jobs $7.8 million/year to local economies Construction Phase = 1-2 years Operational Phase = 20+ years Total economic benefit: New local jobs during construction: New local long-term jobs: $1.20 billion 4,
22 WA: 15% by 2020* NV: 25% by 2025* CA: 20% by 2010 Renewable Portfolio Standards MT: 15% by 2015 OR: 25% by 2025 (large utilities)* 5% - 10% by 2025 (smaller utilities) UT: 20% by 2025* AZ: 15% by / August 2009 ND: 10% by 2015 SD: 10% by 2015 CO: 20% by 2020 (IOUs) 10% by 2020 (co-ops & large munis)* KS: 20% by 2020 NM: 20% by 2020 (IOUs) 10% by 2020 (co-ops) MN: 25% by 2025 (Xcel: 30% by 2020) WI: Varies by utility; 10% by 2015 goal IA: 105 MW IL: 25% by 2025 MO: 15% by 2021 VT: (1) RE meets any increase in retail sales by 2012; (2) 20% RE & CHP by 2017 MI: 10% + 1,100 MW by 2015* NY: 24% by 2013 OH: 25% by 2025 VA: 15% by 2025* NC: 12.5% by 2021 (IOUs) 10% by 2018 (co-ops & munis) ME: 30% by 2000 New RE: 10% by 2017 NH: 23.8% by 2025 MA: 15% by % annual increase (Class I Renewables) RI: 16% by 2020 CT: 23% by 2020 PA: 18% by 2020 NJ: 22.5% by 2021 MD: 20% by 2022 DE: 20% by 2019* DC: 20% by 2020 HI: 40% by 2030 State renewable portfolio standard State renewable portfolio goal Solar water heating eligible TX: 5,880 MW by 2015 Minimum solar or customer-sited requirement * Extra credit for solar or customer-sited renewables Includes separate tier of non-renewable alternative resources 29 states & DC have an RPS 5 states have goals

23 Environmental Benefits No SOx or NOx No particulates No mercury No CO2 No water
24
25
26 The Wind Project Development Process Site Selection Land Agreements Wind Assessment Environmental Review Economic Modeling Interconnection Studies Permitting Sales Agreements Financing Turbine Procurement Construction Contracting Operations & Maintenance

27 Key Issues for Wind Power Policy Uncertainty Siting and Permitting: avian, noise, visual, federal land Transmission: FERC rules, access, new lines Operational impacts: intermittency, ancillary services, allocation of costs Accounting for non-monetary value: green power, no fuel price risk, reduced emissions

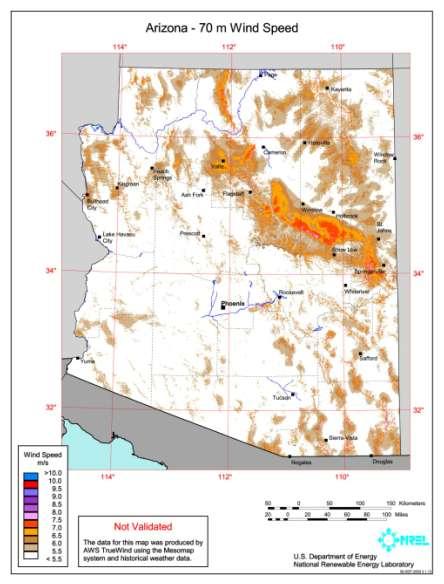
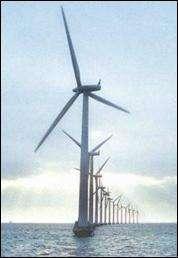
28 Arizona Wind Resources

29 The future ain t what it used to be. - Yogi Berra
30 Levelized Cost of Energy, $/MWh 2010 Costs w/ PTC, $1,600/MW-mile, w/o Integration costs Onshore Class 7 Class 6 Class 5 Offshore Class 7 Class 6 Class 5 10% Available Transmission 100 Class 4 Class 3 Class 4 Class ,000 Quantity Available, GW
31 46 States Would Have Substantial Wind Development by 2030 Wind Capacity Total Installed (2030) (GW) > 10 Includes offshore wind. The black open square in the center of a state represents the land area needed for a single wind farm to produce the projected installed capacity in that state. The brown square represents the actual land area that would be dedicated to the wind turbines (2% of the black open square).
32 Billions of 2006 Dollars Economic Costs of 20% Wind Scenario $3000 $2500 $2000 $1500 Incremental investment cost of 20% Wind Scenario 2% investment difference between 20% Wind and No New Wind $1000 $500 $0 No New Wind Wind O&M Costs Wind Capital Costs Transmission Costs 20% Wind Fuel Costs Conventional O&M Costs Conventional Capital Costs
33 20% Wind Scenario Impact on Generation Mix in 2030 Reduces electric utility natural gas consumption by 50% Reduces total natural gas consumption by 11% Natural gas consumer benefits: $ billion * Reduces electric utility coal consumption by 18% Avoids construction of 80 GW of new coal power plants Source *: Hand et al., % 80% 60% 40% 20% 0% U.S. electrical energy mix No New Wind Natural Gas Coal Nuclear 20% Wind Hydro Wind

34 34 National (U.S.) Economic Impacts Cumulative Impacts from From the 20% Scenario 300 GW new Onshore and Offshore Development JEDI Model Version W e Project Development & Onsite Labor Impacts Landowner Revenue: $783 million Local Property Taxes: $1,877 million Construction Phase: 834,072 FTE jobs $65 billion to the US economy Operational Phase: 366,441 FTE jobs $17 B to the US economy Local Revenue, Turbine, & Supply Chain Impacts Construction Phase: 2.63 M FTE jobs $526 billion to the US economy Operational Phase: 1.3 M FTE jobs $207 billion to the US economy Induced Impacts Construction Phase: 2.75 M FTE jobs $353 billion to the US economy Operational Phase: 1.64 M FTE jobs $192 billion to the US economy Construction Phase = 1-2 years Operational Phase = 20+ years Total economic benefit: $1.36 trillion New local jobs during construction: 6.2 M FTE New local long-term jobs: 3.3 M FTE
35 Arizona Economic Impacts From the 20% Scenario 2,717 MW new development Wind energy s economic ripple effect Direct Impacts Payments to Landowners: $7 Million/yr Local Property Tax Revenue: $17 Million/yr Construction Phase: 3,800 new jobs $510 M to local economies Operational Phase: 600 new long-term jobs $60 M/yr to local economies Indirect & Induced Impacts Construction Phase: 4,100 new jobs $400 M to local economies Operational Phase: 500 local jobs $55 M/yr to local economies Totals (construction + 20yrs) Total economic benefit = $3.1 B New local jobs during construction = 7,900 New local long-term jobs = 1,200 All jobs rounded to the nearest hundred jobs; Millions of dollars greater than 10 million are rounded to the nearest five million Construction Phase = 1-2 years Operational Phase = 20+ years
36 CO 2 Emissions in the Electric Sector (million metric tons) CO2 Emissions from the Electricity Sector 4,500 4,000 3,500 3,000 2,500 2,000 1,500 1, No New Wind Scenario CO 2 emissions 20% Wind Scenario CO 2 emissions USCAP path to 80% below today s levels by

37 Cumulative Water Savings from 20% Scenario Reduces water consumption of 4 trillion gallons through 2030 (represents a reduction in electric sector water consumption by 17% in 2030)
38 Results: Costs & Benefits Incremental direct cost to society Reductions in emissions of greenhouse gasses and other atmospheric pollutants Reductions in water consumption Jobs created and other economic benefits Reductions in natural gas use and price pressure $43 billion 825 M tons (2030) $98 billion 8% total electric 17% in ,000 direct $450 billion total 11% $150 billion Net Benefits: $205B + Water savings
39 Annual Capacity (GW) Cumulative Capacity (GW) U.S. Remains on Early Track To Meet 20% of Nation s Electricity with Wind by annual projections (EER) Deployment Path in 20% Wind Report (annual) Actual Wind Installations (annual) Deployment Path in 20% Wind Report (cumulative) But ramping up to ~16 GW/year and maintaining that pace for a decade is an enormous challenge, requiring proactive policy, substantial transmission expansion, mitigation of output variability, and eased siting and permitting processes


40 Carpe Ventem