Regulatory Challenges, Developments, and Issues Confronting the IUB
|
|
|
- Alberta Dana Carson
- 5 years ago
- Views:
Transcription
1 Regulatory Challenges, Developments, and Issues Confronting the IUB NARUC Energy Regulatory Partnership Program The Public Services Regulatory Commission of Armenia and The Iowa Utilities Board by Robert B. Berntsen Chair of the Iowa Utilities Board June 15,
2 Regulatory Challenges, Developments, and Issues Rate Case Challenges Economic Hardship Key Indicators, Unemployment Natural Disasters Renewables Developments Climate Regulation Transmission Build Out New Energy Policy Drivers UMTDI, CARP, EIPC Issues Demand/Capacity Projections Service Quality/Consumer Issues 2
3 Economic Hardship Key Economic Indicators Indicators 2009 Oct Nov Dec 2010 Jan Feb Mar Agricultural Futures Price Index Corn (cents/bushel) Soybean (cents/bushel) Hog (cents/pound) Cattle (cents/pound) Iowa Stock Market Index Yield Spread Building Permits Average Weekly Unemployment Claims 8,010 7,863 7,725 7,564 7,298 6,980 Average Weekly Manufacturing Hours New Orders Index (percent) Diesel Fuel Consumption (mil gallons) Also, in January 2010: unemployment up to 6.7% (was 4.4% prior year); 40,000 Iowans lost jobs; 113,100 unemployed 3


4 Natural Disasters 08 Flood Flood Waters impacted 181 miles of overhead distribution line and 62.4 miles of underground distribution line. At one point during the flood, 23 substations in the Cedar Rapids area were out of service due to loss of supply from the two Cedar Rapids generating stations. 4


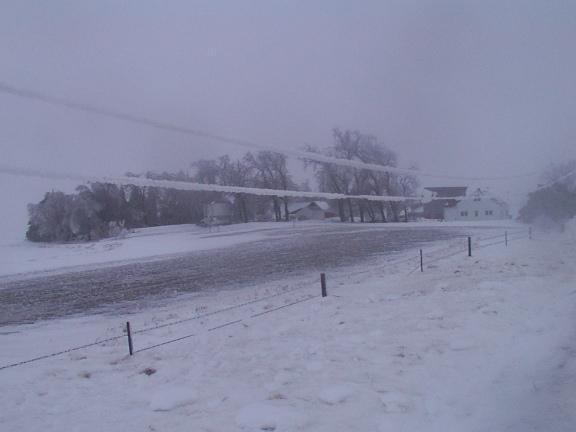

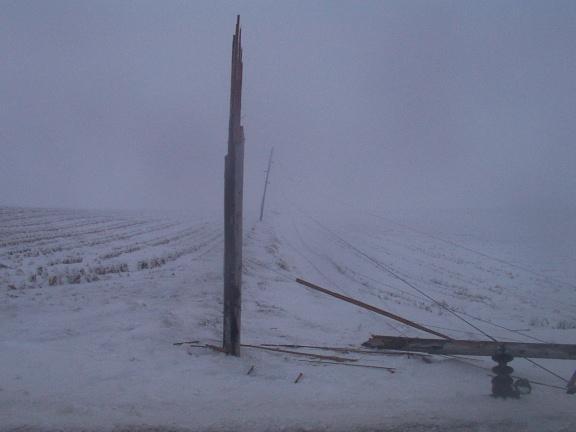
5 Natural Disasters Winter Storms 5

6 Natural Disasters Winter Storms 6
7 Renewables Merchant Generators vs. IOUs Iowa has become an epicenter for wind development. Regulated IOUs as well as independent merchant generators are building wind farms in Iowa. Federal stimulus money has been a significant driver of wind development. If a national RES is created, it would further incent development. 2,534 towers are up and running in Iowa today; 3,670 MW 121 turbines planned in the immediate future; 200 MW 534 towers added in 2009; 879 MW 78 installations in Iowa (Installation is defined as any single construction project. For example, a single school turbine and the third major addition to a particular farm would both be considered installations) source: Iowa Office of Energy Independence RPU : MidAmerican Energy Company Advanced Ratemaking Principles (1001 MW Wind) 7
8 Climate Regulation "The elephant in the room is carbon policy. It is difficult to plan when you don t know exactly what we are planning for." John Norris, FERC Commissioner In 2009, federal climate legislation stalled. Recently, however, climate regulation has returned to the forefront. What will it look like? Proposal Obama Proposal Waxman-Markey Kerry-Lieberman- Graham Structure Economy-wide cap and trade, renewable electricity and energy efficiency standards, clean energy investment Utility, industry, and petroleum sector cap, renewable electricity and energy efficiency standards, clean energy investment Utility (2012) and industry (2016) cap and trade with linked fuel carbon fee, renewable electricity and energy efficiency standards, consumer rebates Emissions Reductions 15% by % by % by % by % by % by 2050 (for capped sectors) Allowances Full auction Allocations based on historical emissions (50%) and retail sales (50%)? 8
9 CO 2 Emissions (Short Tons) Percentage of Baseline Emissions Climate Regulation 30,000,000 25,000,000 20,000,000 15,000,000 10,000,000 5,000,000 0 MidAmerican Energy (Combined Cycle Case) - Allowances Versus Emissions Gas Unit CO2 Emissions Coal Unit CO2 Emissions Allocated Allowances % of Baseline Waxman-Markey Target 140% 130% 120% 110% 100% 90% 80% 70% 60% 50% 40% 30% 20% 10% 0% 9
10 New Energy Policy Drivers Renewable Portfolio Standards WA: 15% by 2020* OR: 25% by 2025 (large utilities)* 5% - 10% by 2025 (smaller utilities) NV: 25% by 2025* CA: 33% by 2020 AZ: 15% by 2025 MT: 15% by 2015 UT: 20% by 2025* ND: 10% by 2015 SD: 10% by 2015 CO: 20% by 2020 (IOUs) 10% by 2020 (co-ops & large munis)* NM: 20% by 2020 (IOUs) 10% by 2020 (co-ops) KS: 20% by 2020 MN: 25% by 2025 (Xcel: 30% by 2020) WI: Varies by utility; 10% by 2015 goal IA: 105 MW IL: 25% by 2025 MO: 15% by 2021 VT: (1) RE meets any increase in retail sales by 2012; (2) 20% RE & CHP by 2017 MI: 10% + 1,100 MW by 2015* NY: 24% by 2013 OH: 25% by 2025 WV: 25% by 2025* VA: 15% by 2025* NC: 12.5% by 2021 (IOUs) 10% by 2018 (co-ops & munis) ME: 30% by 2000 New RE: 10% by 2017 NH: 23.8% by 2025 MA: 15% by % annual increase (Class I Renewables) RI: 16% by 2020 CT: 23% by 2020 PA: 18% by 2020 NJ: 22.5% by 2021 MD: 20% by 2022 DE: 20% by 2019* DC: 20% by 2020 HI: 40% by 2030 TX: 5,880 MW by states & DC have an RPS 6 states have goals Notes: State renewable portfolio standard State renewable portfolio goal Solar water heating eligible ( / October 2009) Minimum solar or customer-sited requirement * Extra credit for solar or customer-sited renewables Includes non-renewable alternative resources (1) Despite relatively small statutory RPS, Iowa is currently #2 in installed wind capacity with 3,043 MW, per AWEA. (2) Source of RPS map: Database of State Incentives for Renewables and Efficiency, 10

11 New Energy Policy Drivers Wind Potential 11
 Source: U.S. DOE / NREL, http://www.energysavers.gov/pdfs/130.")
12 New Energy Policy Drivers Solar Potential (for Concentrating Solar Power) Source: U.S. DOE / NREL, 12
13 Upper Midwest Transmission Development Initiative (UMTDI) Effort to coordinate wind resources, transmission and cost allocation to satisfy needs After stakeholder input, recommended 5-state Renewable Energy Zones (REZ) Further study of "no-regrets" projects, at a capped cost Assumptions adopted by broader MISO Regional Generation Outlet Study (RGOS) Greater policymaker awareness of costs, benefits and issues 14

14 UMTDI Map 15

15 Cost Allocation and Regional Planning (CARP) Effort led by Organization of MISO States (OMS) 2009 through July 2010 Extremely detailed effort to guide new cost allocation within MISO States lead CARP and chair the MISO cost allocation effort RECB TF 16

16 Eastern Interconnection Planning 17
17 Eastern Interconnection Planning $80M in Recovery Act funding. "Seed money" to create standing analytic capabilities over long term. DOE is awarding $60M to five interconnection level entities: East: EIPC and EISPC West: WECC and WGA Texas: ERCOT $20M for technical support through National Laboratories Eastern Interconnect Awardees "Topic A" (Eastern Interconnection Planning Collaborative) (EIPC)); and "Topic B" (Eastern Interconnection States Planning Council (EISPC)) - 39 States and D.C.; represented by State Public Utility Commissions and Governors Offices 18
18 Eastern Interconnection Planning Topic A and Topic B groups will perform two different kinds of work: Topic A: inclusive, collaborative interconnection-level analysis and planning, to be done under the guidance of a "stakeholder steering committee" (SSC). At least 1/3 of the SSC must be state officials. Topic B: cooperation among states on electric resource planning and priorities (as input to Topic A work). SSC to "provide strategic guidance to the Applicant s analysts on the scenarios to be modeled, the modeling tools to be used, key assumptions for the scenarios, and other essential activities." Formation has been controversial Topic B sees role as critical to success; wants significant input with SSC 19
19 Demand/Capacity Projections Interstate Power and Light MidAmerican Energy Company Demand Capacity Reserve Margin Demand Capacity Reserve Margin Year Megawatts Megawatts (%) Megawatts Megawatts (%) % % % % % % % % % % % % % % % % % % % % % Interstate Power and Light Projections are from their Minnesota 2007 Resource Plan filed with the Board on June 2, MidAmerican Energy company Projections are filed under Board docket number RPU Reserve margins are necessary to ensure reliability and adequate resources to serve load. Generally, 15% reserve margin is adequate to meet the loss of load expectation of 0.1 day in one year. Iowa utilities have adequate reserve margins to serve their projected load for the next decade. 20
20 Service Quality/Consumer Issues Service Quality Number of Complaints Types of complaints (ranked ) Year Total #Complaints* (ranked) -Billing ,909 -Disconnect ,111 -Meter Reading ,241 -Payment Arrangement ,556 -Poor Customer Service ,429 *includes verbal & written correspondence, does not include misdialed calls Consumer Issues Affordability Payment Options Payment Assistance Education -Utility Bills -Efficiency and Conservation 21
21 Questions? Robert Berntsen Iowa Utilities Board NARUC Energy Regulatory Partnership Program The Public Services Regulatory Commission of Armenia and The Iowa Utilities Board 22