Sustainable mobility: Challenges for the transition
|
|
|
- Roberta Benson
- 5 years ago
- Views:
Transcription
1 Sustainable mobility: Challenges for the transition Amela Ajanovic Energy Economics Group Vienna University of Technology Milan, December 2018
2 Content Introduction Historical developments Policy framework Standards vs. taxes Electric vehicles Conclusion
3 Introduction Basic principle: Service: km driven S=f(E, η (Tc), η (Tis)) Fuel mix, Fuel demand Efficiency: Liter/100 km Infrastructur


4 Introduction Amount of transport services per capita Horse power Sailing ship based on non-commercial renewable energy based on commercial energy Electricity, combustion Steam engine machine, steam railway time

5 Transport sector 93% oil products' share of final energy consumption for transport, making the sector the leastdiversified Countries with largest conventional oil reserves


6 Final energy consumption by sector in the EU, 2015

7 Final energy consumption by sector 2015 in the EU

8 GHG emissions in EU 28 IEA,2017
9 The challenges for EU climate and energy policies Mitigate global warming Improve air quality Car passenger transport Reduce energy consumption Effective policies and measures
10 EU targets % ICE -50% in city No ICE in city gco2/km 20% GHG (2008) 60% GHG (1990) 95 gco2/km The White Paper on Transport Policy Targets and average CO 2 emissions from new passenger cars in EU countries
11 Electric vehicles Paris Declaration on Electro-Mobility and Climate Change & Call to Action: more than 100 million EVs 400 million two and three-wheelers
12 CO 2 emissions in passenger car transport CO 2 emissions Energy x = x CO 2 emissions coefficient = On-road power-specific x Total vkm fuel efficiency driven = Test-cycle fuel x Driving coefficient intensity behaviour x Power (capacity) of car to be reduced e.g. by kw-specific registration tax lower coefficient for biofuels or electricity to be improved by automobile manufacture to be reduced by eco-driving to be influenced by fuel taxes or fuel intensity improvements Standards Education Fuel tax Registration tax Subsidies, quotas Policy instruments Impact factors on CO 2 emissions in the car passenger transport sector


13 Standards USA, Canada 2025: 103 gco2/km EU 2021: 95 gco2/km China 2020: 117 gco2/km Japan 2020: 105 gco2/km India 2021: 113 gco2/km
14 Standards Next targets average emissions 15% lower than in average emissions 30% lower than in 2021 Test procedure: New European Driving Cycle (NEDC) Worldwide Harmonised Light Vehicle Test Procedure (WLTP)

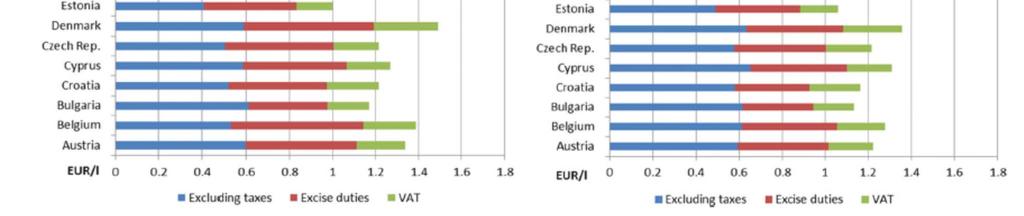
15 Fuel taxes in the EU
16 Tax vs. standard Price of service P t Preis (p) der EDL Fiscal measure (tax) P 0 P s Technical measure ΔE E 1 E 0 η 1 η 0 Energieverbrauch kwh Energy consumption
17 Rebound effect 2 2 th 2 pr 1 1 S 2 =vkm 2 E REB E pr save S 1 =vkm 1 E th 2 E pr 2 E 1 E E th save
18 Standards & taxes Ps Ps 0 =Ps 2 1 new efficiency Tax effect 0 old efficiency Efficiency effect Ps 1 E 2 ΔE tax E 1 ΔE η E 0 E How taxes and standards interact and how they can be implemented in a combined optimal way for society


19 Electric vehicles
20 Environmental assessment Well-to-Wheel (WTW) Primary energy source Fuel TTW_fuel Mobility Car TTW_car Well-to-Tank (WTT) Tank-to-Wheel (TTW)


21 Environmental assessment CO 2 emissions per km driven for various types of EV in comparison to conventional cars (power of car: 80kW)
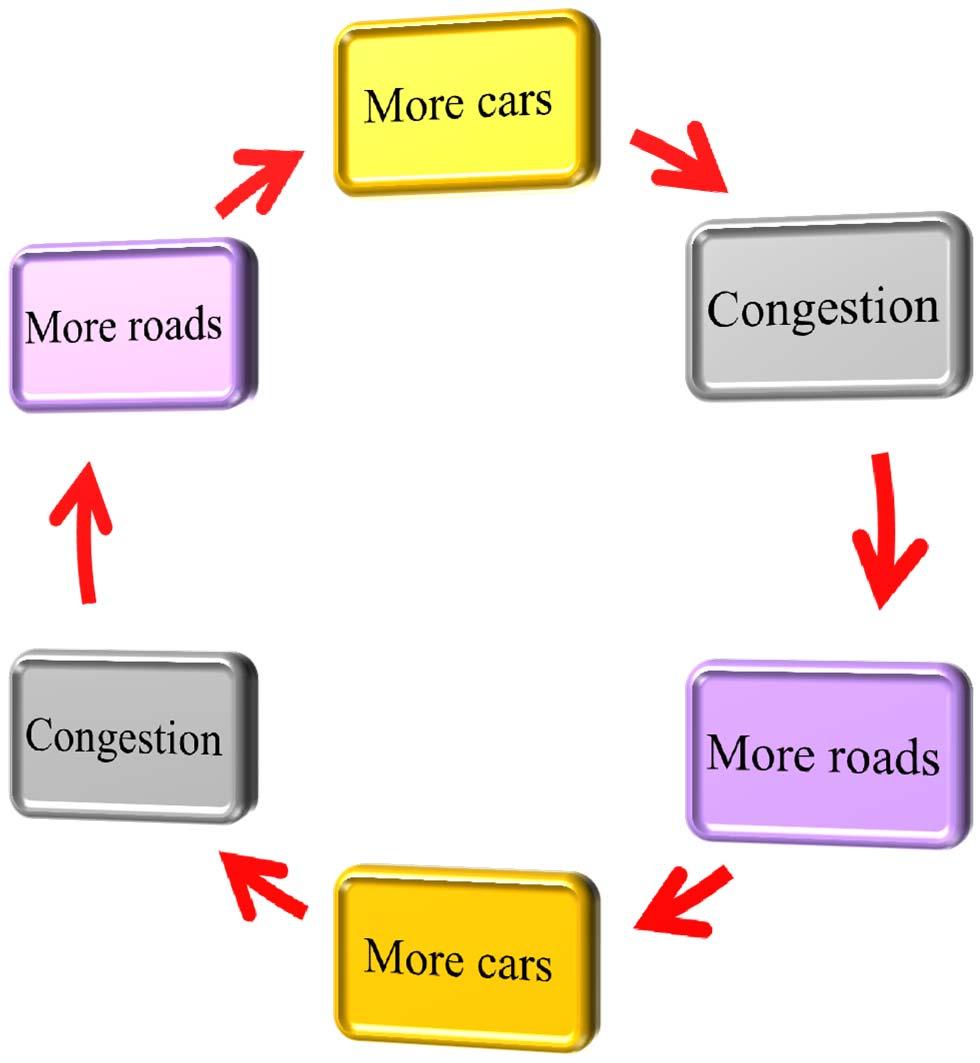
22 Car-oriented mobility

23 Mobility Car-oriented transport development
24 Strategies for energy efficient mobility Energy efficiency of mobility System efficiency Travel efficiency Vehicle efficiency AVOID unnecessary travel and reduce trip distances SHIFT towards more sustainable modes IMPROVE transport practices and technologies
25 Conclusions Policy framework not sufficient Standards. rebound effect a harmonization of taxes in EU countries and their adaptation to the CO 2 targets..contribution to the reduction of the negative impacts of the rebound effect Electric vehicles new policy design Systematic approach
26