Management for the Next Phase of the
|
|
|
- Bruce Osborne
- 5 years ago
- Views:
Transcription

1 THE PENRITH LAKES SCHEME Mine Rehabilitation hbl Works and Management for the Next Phase of the Penrith ihlakes Scheme
2 Overview of Presentation Summary of the Penrith Lakes Scheme Key Elements of Scheme Water Management Stormwater Management Flooding Response Water Infrastructure Lake Establishment Catchment modelling Water Quality Model Applications / Direction


3 Regional Context


4 History of Penrith Lakes Site 1790s Quarrying first commenced Quarrying for Warragamba Dam started in State Government sold holdings to Blue Metal Industries Castlereagh Steering committee formed in 1970 Penrith Lakes Development Corporation formed in 1980 RES published based on a 4 Lake Scheme Final Water Management Plan lodged 2014 Quarrying completed 1987 Deed of Agreement Signed 2016 Final dedication of the Scheme Aboriginal occupation
5 Past and Future The Past The Future 1985 Artists impression of the completed Lakes Scheme. Total Scheme covers 1,935 ha Ha of completed landforms 770 Ha holding 38 Gigalitres of water
")


6 Dedicated Lakes and Parks Sydney International Regatta Centre (SIRC) 196 ha successfully completed and dedicated to Government as the first stage of the Lakes Scheme. SIRC is one of the best rowing and sprint kayak courses in the world & won international acclaim during the Sydney 2000 Olympic Games. Now a popular sporting, corporate and social venue and receives an average of 40,000 visitors a month. Penrith Whitewater Stadium The Stadium was the competition venue for the canoe/kayak slalom events during the Sydney 2000 Olympic Games.

7 Scheme Water Management


8 Stormwater Management


9 Gravity Flow System
10 Gravity Flow System


11 Scheme Flooding Response
12 Water Infrastructure


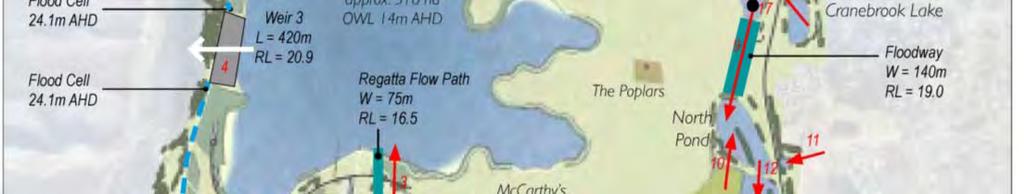


13 Water Infrastructure
14 Infrastructure details 2012 Scheme Water Management Plan includes: Reduced river inundation from a 5 year ARI event to a 10 year ARI, with no recreational lakes impacted until a 25 year ARI. Reduced d risk of noxious species, sediment and water quality contamination. Riverbank flood cells protecting cultural and heritage values. Networks of flowpaths across the Scheme allowing for flood waters to uniformly increase and protect against extreme scouring flows. Flood outlet pipes that allow for reticulation with the riverbank under normal operating conditions. Reduced d recurrent maintenance costs.
15 Water Quality Management


16 Biodiversity Master Plan Landscape Class Guideline Woodland ooda d Vegetation >30% of site ste Core Conservation Vegetation Riparian Corridors All Vegetation Communities Intensive Land Use >10% of site, hectare size >100 metres wide hectares in size and <2 kilometres apart <30% of site


17 Lake Establishment Lakes and foreshores planted with native aquatic and terrestrial ilplants Rock and woody snags are placed prior to lk lake filling for fish and invertebrate habitat As lake ecology develops As lake ecology develops Australian Bass are stocked as a top order predator


18 Ecological Monitoring The Integrated Monitoring Program has reported on: Landscape Function Analysis -constructed t lands and static ti environments show comparable soil performance. Effective noxious weed management - including the control and eradication of Salvinia and Water Hyacinth from water bodies and detention basins. Reintroduction of Species 9 native frog species, 165 bird 23 mammals and 15 reptile species are recorded as reintroduced species 61 families of macroinvertebrates t routinely monitored showing developing communities routinely monitored across the scheme. 35 hectares of native grass farms have been established producing 7 species.

 in")

19 Water Quality Profiling Cyanobacterial Biovo olume (mm 3 /L) Duralia Lake Monthly Cyanobacterial Biovolumes (January 2008 December 2012) Monthly Average Biovolume Primary Contact Guideline Compliance monitoring for NHMRC Guidelines for Recreational Water (2008) in collaboration with the Public Health Unit. Physical and biological profiling data currently being incorporated into a scheme- wide water quality model
20 Water Quality Performance 79% Total Phosphorus and 47% Total Nitrogen reduction at the Final Basin 91% Total Phosphorus and 73% Total Nitrogen removal at the SIRC Lakes 95% Primary Contact in the SIRC Lakes


21 Water Quality Model Water quality model works Nepean River Pump and Pipeline delivering 86ML/Day 52ha Southern Wetland System


22 Nutrient Analysis Varied catchment landuse conditions and localised storm events have challenged traditional modelling approaches Preliminary observations of lake modelling suggests both P and N nutrient limitation for cyanobacterial growth Catchment inflows with wetland treatment systems provide substantial nutrient removal capabilities Feb 2012 Rainfall event Terry Hills BoM Radar Image


23 Applications of the WQM Assess the impacts of evolving land use in the surrounding the catchments Impacts of changes to river water quality and climate change Model the likely performance of the Scheme and set stormwater targets Assess the impacts of installing water quality infrastructure
24 Where to From Here? Urban development potential for the Scheme Nominate standards for lake performance and ecology requirements Applications of WSUD within and around the Scheme Vital management tool for local l authorities to ensure the longevity of the Scheme Quarry Shareholders leave a highly valuable asset for to the community


25 Thank you