Toward Innovative Approaches for Improving Water Quality: Linking Eco-Hydrology with Ecosystem Services at the Watershed Scale
|
|
|
- Dwain Warner
- 5 years ago
- Views:
Transcription


1 Toward Innovative Approaches for Improving Water Quality: Linking Eco-Hydrology with Ecosystem Services at the Watershed Scale Luc Claessens 1 and Gerald Kauffman 2 1 Department of Geography; 2 Water Resources Agency University of Delaware Delaware Estuary Science & Environmental Summit January 27, 2015


 Delaware Water Resources")
2 Acknowledgments Students: Kelsey Moxey, Tom Santangelo, Sandra Demberger Dr. Joanna York, University of Delaware Chester County Conservation District Funding: Delaware Environmental Institute (seed grant) Delaware EPSCoR (internship) Delaware Water Resources Center (internship)
3 Outline of Talk Background Study area and trends in water quality Effect of land-use and land management on nitrogen Mushroom farming and geospatial analysis Riparian buffers and geospatial analysis Monitoring of spatial and temporal patterns Alternative N reduction strategies

4 Background Agriculture and urbanization can lead to increased nitrogen export, which impacts downstream aquatic ecosystems. To reduce impact, best management practices (BMPs) are promoted (e.g., riparian buffers, stormwater retrofits). Implementing BMPs can require major investments, while there are still large uncertainties regarding their effectiveness and timeline of response. Key question: Are BMPs cost-effective? Examine approaches that are fast-response, innovative and cost-effective, perhaps applied within payment for ecosystem services scheme or nutrient trading.
? Q: What time scales of continuous sensing best capture and explain critical N process controls? 2.")
5 Goals 1. Gain detailed understanding of spatial and temporal variation of nitrogen export at subwatershed scale Q: Where are N hotspots and what are the legacies? Q: What are the sector contributions (ag, urban, etc.)? Q: What time scales of continuous sensing best capture and explain critical N process controls? 2. Evaluate N reduction benefits of current strategies Q: What is the potential for N removal using riparian buffers for areas targeted for restoration? 3. Assess feasibility of alternative N reduction strategies Q: What is the technical, economic and management feasibility of using bioreactors and other innovative nutrient reduction measures? Q: How can we develop a watershed approaches for ecosystem services vs. farm-based approach?
6 Outline of Talk Background and nitrogen Study area and trends in water quality Effect of land-use and land management on nitrogen Mushroom farming and geospatial analysis Riparian buffers and geospatial analysis Monitoring of spatial and temporal patterns Alternative N reduction strategies


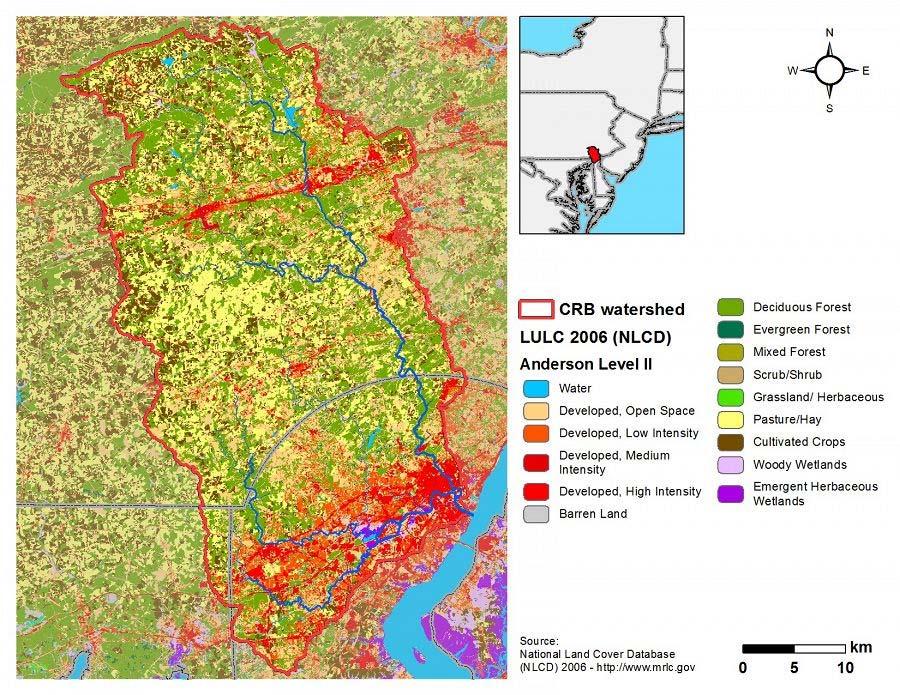
7 Study Area Christina River Basin
8

9 The Christina River Basin has some of the highest nitrogen loads in the East.

10 A pollution diet for the Christina River Basin Our study concentrates on areas with the largest nitrogen TMDL reductions A TDML is a calculation of the maximum amount of a pollutant that a waterbody can receive and still meet water quality standards, and an allocation of that load among the various sources of that pollutant. (EPA website)
11 Long-term patterns of stream nitrate show that nitrate levels have not improved, illustrating the need for better N removal practices. Flow-adjusted nitrate patterns, analyzed using WRTDS model (Hirsh et al., 2010) (Weighted Regression on Time, Discharge, & Season)

12


13 ... although farmers use of conservation practices in the Delaware River Basin has made good progress toward reducing sediment, nutrient, and pesticide losses from farm fields, significant conservation treatment is still needed to reduce nonpoint agricultural sources of pollution.

14 While BMPs like riparian buffers are heavily promoted to improve water quality, there is evidence that such improvements could take many years to decades (e.g., Tesoriero et al., 2013). Observations presented in this article establish that lag times on the order of decades occur in some streams and that legacy nitrate sources can result in increases in nitrate concentrations over time regardless of changes in current land use practices.
15 Hence there is an urgent need to examine other approaches that are fast-response, innovative and cost-effective, and that perhaps could be applied within a payment for ecosystem services scheme or nutrient trading.
16 Outline of Talk Background and nitrogen Study area and trends in water quality Effect of land-use and land management on nitrogen Mushroom farming and geospatial analysis Riparian buffers and geospatial analysis Monitoring of spatial and temporal patterns Alternative N reduction strategies

.")
17 Snapshot Sampling ~60 stations; sampled in April 2011 during baseflow. Range of land-use (forested, agricultural, developed, mixed). Mostly headwater streams. Newark


 in agricultural")
18 Effect of Land-Use Mushroom farms Forest Development N conc. has direct relationship with non-forested land-use. Urbanized areas have relatively low N conc.; N reduction efforts in these areas will lead to only minimal improvements. Concentrated sources (loading and flow) in agricultural areas are excellent opportunities for targeted N reduction efforts.
19 Outline of Talk Background and nitrogen Study area and trends in water quality Effect of land-use and land management on nitrogen Mushroom farming and geospatial analysis Riparian buffers and geospatial analysis Monitoring of spatial and temporal patterns Alternative N reduction strategies Check out the poster of Kelsey Moxey


 ----2 to 3 weeks-----")
20 Mushroom Farming Step 1: Mushroom Substrate Mixing ingredients (e.g., hay, horse bedding, poultry litter, cocoa shells, gypsum, water) Step 2: Growing Mushrooms Pasteurization, spawning, casing, pinning Step 3: Spent Substrate Compost Aging (passive & active) to 3 weeks to 3 years to 8 weeks----

21 Nitrogen Fluxes (tons/year)
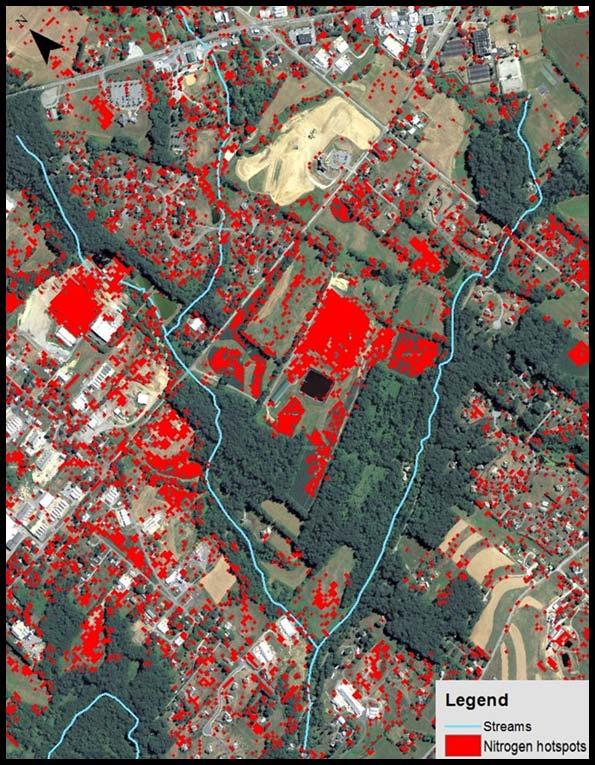
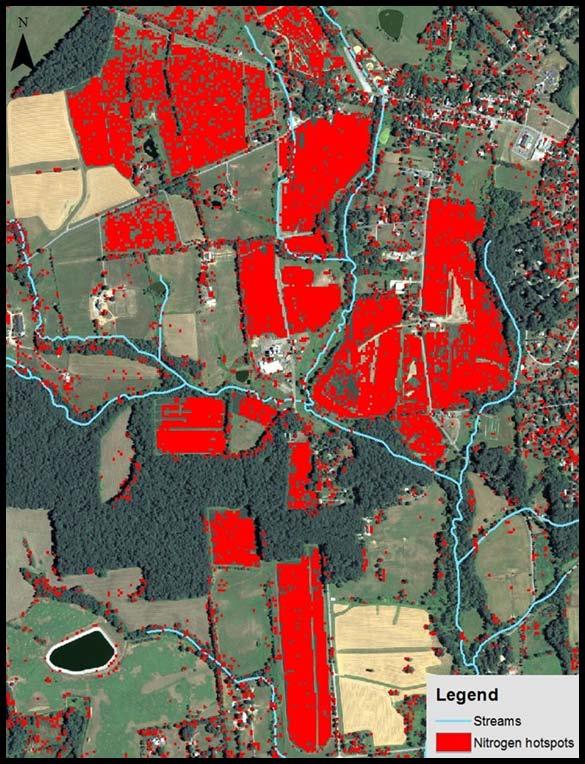
22 In the past, mushroom compost has been over applied to fields in the region. Knowing the locations is important for identifying N hot spots and legacies, and to design N removal practices. Question: Can we use geospatial analysis to identify these locations of compost field applications?

23 Classification using remote sensing Data: NAIP (National Agriculture Imagery Program), 1m resolution, 4 band, July Spectral bands: blue, green, red, near infrared Training samples for mushroom compost delineation Classification method: Maximum likelihood classification


24 Known locations are correctly classified


25 Also unknown locations are detected Visual evidence 1992
26
27
28
29 Outline of Talk Background and nitrogen Study area and trends in water quality Effect of land-use and land management on nitrogen Mushroom farming and geospatial analysis Riparian buffers and geospatial analysis Monitoring of spatial and temporal patterns Alternative N reduction strategies Check out the poster of Tom Santangelo

30 Evaluate N reduction benefits of current strategies Q: What is the potential for N removal using riparian buffers for areas targeted for restoration?

 Nitrogen delivery from upland")
31 Riparian Buffers Functions of Riparian Buffers Reduce nutrient and sediment transport Contribute organic detritus to soil Provide terrestrial and aquatic habitat Cool stream temperature Bank stability Etc. Factors for nitrogen removal General characteristics (width, age, type) Nitrogen delivery from upland Hydrologic factors Water flux Residence time Wetness Soil & geologic factors Tesoriero et al., 2012

32 Recent Findings (Sweeney and Newbold, 2014) An extensive literature review of empirical studies shows that lateral water flux and buffer width are key factors in buffer effectiveness.
33 While the factors controlling riparian N removal are generally well know, their spatial application for management purposes is not yet sufficiently developed. Building on the empirical Sweeney & Newbold (2014) equations we are developing a spatially explicit GIS model that can be used for prioritizing buffer locations and widths, as to meet desired reductions in N loading.
34


35 Results for existing buffer widths

36 Buffer widths for 90% N removal
37 Buffer widths for 90% N removal
38 Outline of Talk Background and nitrogen Study area and trends in water quality Effect of land-use and land management on nitrogen Mushroom farming and geospatial analysis Riparian buffers and geospatial analysis Monitoring of spatial and temporal patterns Alternative N reduction strategies
39 Assess feasibility of alternative N reduction strategies Q: What is the technical, economic and management feasibility of using reactive barriers and other innovative nutrient reduction measures?
40 Because of uncertainty in BMP effectiveness and associated lag times, there is a need for N reduction approaches that are innovative, fast-response, and cost-effective. Innovative both in technical aspects (environmental science and engineering) and in management aspects (policy).

41 There remains a critical need for systematic empirical studies documenting N-removal efficiency among EEPs and potential environmental and economic tradeoffs...


42 Enhancing N Removal Innovative Approach Technical Aspects Permeable reactive barriers, denitrification walls ( Organic carbon substrate immediate N reduction Potentially treat surface water no long lag times associated with most BMPs immediate lowering of stream N


43 Innovative Approach Policy Aspects (Source: Kauffman and Jones, 2014)
. N source tracking (stable isotopes). Preliminary design of innovative practices.")
44 Next Steps Geospatial and process-based modeling (riparian buffers; remote sensing of N hotspots). WQ monitoring (continuous sensing; baseflow and stormflow). N source tracking (stable isotopes). Preliminary design of innovative practices. Economic analysis (cost and benefits; funding structure).
45