Steve Widdicombe. How do we put all the pieces together to appreciate the bigger
|
|
|
- Morgan Nelson
- 5 years ago
- Views:
Transcription

, 4 th 8 th June, 2018, Washington D.C., USA")
1 @steve_swi How do we put all the pieces together to appreciate the bigger picture? Steve Widdicombe Session 11: Benthic and Pelagic system responses in a Changing Ocean: From Genes to Ecosystem Level Functioning 4th International Symposium on the Effect of Climate Change on the World's Oceans (ECCWO), 4 th 8 th June, 2018, Washington D.C., USA

 Lessons learned")

2 Shifting Objectives Individuals to Ecosystems U Riebesell, J-P Gattuso (2015) Lessons learned from ocean acidification research. Nature Climate Change 5:

 and within individuals o Climate")
3 Two Major Challenges Time o Climate is changing over years and decades o Experiments are generally short in duration; days, weeks; months o Shock response vs long term acclimation adaptation Complexity o Multiple stressors o Interactions occur between species, but also within species (between populations) and within individuals o Climate vs weather
 Measured ph [on L4 buoy] (red dots) Trend analysis Seasonal fit (grey line) Extreme events are")
 Trend analysis Seasonal fit (grey line) 2008 2009 2010 2011 2012 2013 2014 2015")
4 Climate vs Weather Measured DIC (black dots) Trend analysis Seasonal fit (grey line) Calculated ph [from DIC & TA] (black dots) Measured ph [on L4 buoy] (red dots) Trend analysis Seasonal fit (grey line) Extreme events are really important but gradual (chronic) change can have impacts across life times & generations Calculated Ω [from DIC & TA] (black dots) Trend analysis Seasonal fit (grey line)


5 A story 10 years in the making. Lowered ph causes significant increase in respiratory rate Regrowth significantly longer at lowered ph ph significantly affects calcium content in arm regrowth Arm regrowth has significantly higher calcium content than established arms umol oxygen/day/g animal ± 95% CI length mm ± 95% CI ph ph treatment What s the cost? % calcium/ g of arm ± 95% CI established regrowth ph


6 The payoff control


7 Energetic Trade-offs Within Individuals FEEDING GROWTH MAINTENANCE REPRODUCTION Whole Organism Approach Important to consider how changes in one physiological process can affect other, interdependent process. Physiological Trade-Offs
8 Dynamic Energy Budget Models a link to populations Feeding Ecological and ecosystem level processes Once you know the response of key ecological processes you can project the consequences for populations and distributions

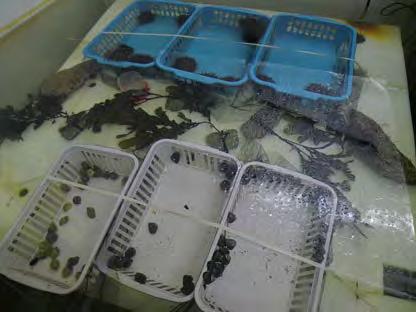
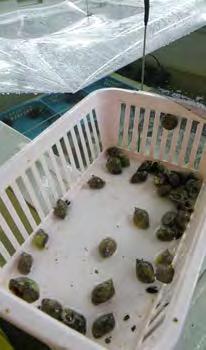
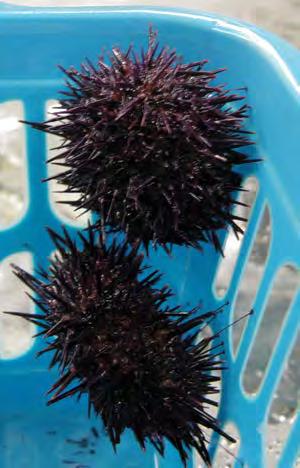
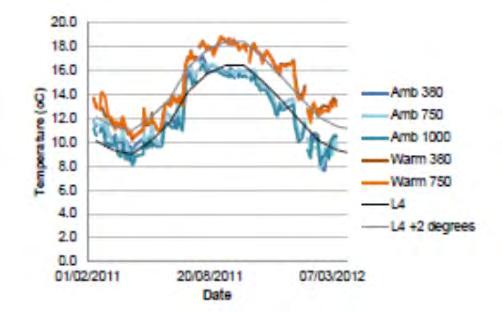
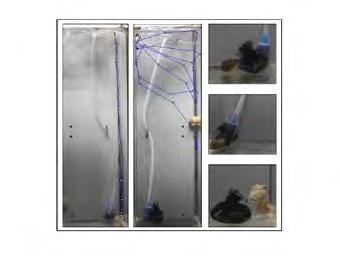
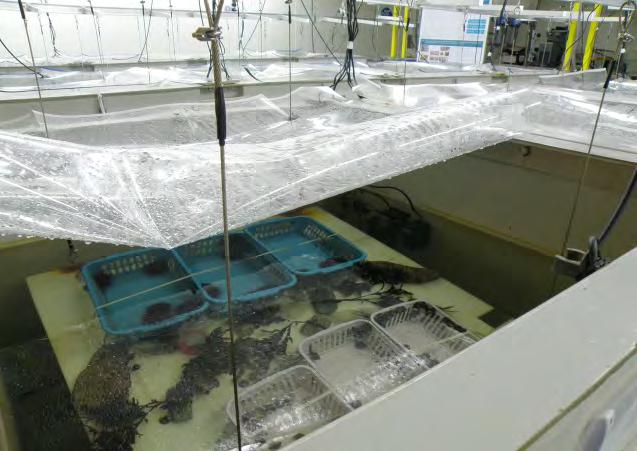
9 Long-term Ocean Acidification Experiment


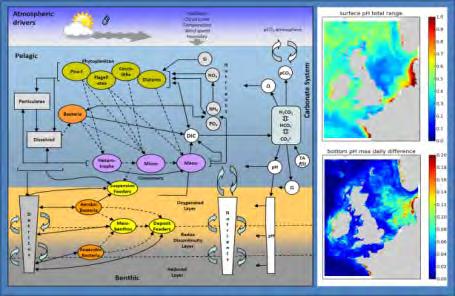


10 Blending together the knowledge
 Quantifying ecosystem-level consequences of ocean acidification and warming by scaling up individual level responses of a predator snail and its trophic interactions.")
11 % Change in Nucella lapillus abundance Warm OA Warm + OA 4 th IPCC Business-asusual 5 th IPCC lower emissions 5 th IPCC higher emissions AM Queirós, et al. (2015) Quantifying ecosystem-level consequences of ocean acidification and warming by scaling up individual level responses of a predator snail and its trophic interactions. Global Change Biology 21(1):
 relative to the 1990s the LFI had begun to improve (with an expected time lag).")


12 Using climate change knowledge to support management and policy Large Fish Index Where fishing effort was reduced in the 2000s (along the UK coast) relative to the 1990s the LFI had begun to improve (with an expected time lag). But High effort Low effort LFI (a) (b) (c) LFI Recovery wasn t happening as fast or as completely as expected in some areas..why? 4 W E 4 W E 4 W E High LFI Low LFI Recovering Engelhard et al (2015) Effort reduction and the large fish indicator: spatial trends reveal positive impacts of recent European fleet reduction schemes. Environmental Conservation 42: doi: /S
13 Using climate change knowledge to support management and policy Queirós et al (2018) Climate change alters fish community size structure, requiring adaptive policy targets. Fish & Fisheries. 00: Used a size-spectrum dynamic bioclimate envelope model (SS-DBEM, Fernandes et al., 2013) to project the response of 7 species of fish to climate change in 5 areas of the North Sea. This model considers how species physiology, growth, population dynamics and dispersal potential respond to temperature, oxygen, salinity, depth, ph and primary production; how each species is able to compete for basal resources within the simulated species assemblage; and the effect of food and temperature on the size-structure of individual populations.


14 In some places targets could become impossible to meet!

15 BUT Not all populations are the same! Integrated population genetics with experimental data for growth and mineralisation, physiology and metabolomics. The sensitivity of populations of the gastropod Littorina littorea to future OA was shaped by regional adaptation. Populations towards the species range edges exhibited greater shell dissolution and the inability to upregulate their metabolism when exposed to low ph, thus appearing most sensitive to low seawater ph. Future levels of OA could mediate temperature-driven shifts in species distributions, thereby influencing future biogeography and the functioning of marine ecosystems. P Calosi et al (2017) Regional adaptation defines sensitivity to future ocean acidification. Nature Communications 8: DOI /ncomms13994 Figure 1: Genetic structure of Littorina littorea populations. Thermal map of Europe from the POLCOMS-ERSEM biogeochemical model showing sampling locations and genetic structure of the six different populations of L. littorea sampled across the Northwest Atlantic latitudinal gradient (from 42 to 70 ). Pie charts = proportion of common haplotypes (grey), shared between climatic regions (pastel colours, northern = blue, mid = green, southern = pink), private to individual sites (primary colours).

 Species-specific response to ocean acidification should account for local adaptation and adaptive plasticity. Nature Ecology and Evolution 1(4): UNSP 0084.")
16 Local adaptation is driven by local environmental variability Explored the highly varied conditions across the he coastal ecosystems of the Humboldt Current System (HCS) off Chile A meta-analysis revealed adaptive intraspecific variability in the response of individuals to pco 2 changes among local populations. This variability in response leads to inter- populations variability that reveals the potential role of local adaptation and/or adaptive phenotypic plasticity in increasing resilience of species to environmental change. CA Vargas et al (2017) Species-specific response to ocean acidification should account for local adaptation and adaptive plasticity. Nature Ecology and Evolution 1(4): UNSP DOI /s Figure 1 Temporal series (line plots) and frequency analysis (bars plots) of surface (upper 10 m depth) pco 2 (µatm) for different coastal environments along the Chilean coast.


17 We largely neglect differences between individuals Studies are heavily biased towards survivors More consideration should be given to the range of responses rather than the mean Ultimately, variability at the level of the individual will drive localised adaption


18 The importance of gender Individuals of blue mussels were exposed to elevated temperature and pco 2. Then also exposed to a pathogen. The metabolites produced in response to these stressors were determined. Large difference in response observed between males and females

19 The Importance of Sex Differences between and response to elevated pco 2 investigated in < 4 % of studies to date, often being precluded by the difficulty of determining sex nondestructively, particularly in early life stages. But, sex significantly impacts organism responses to OA, differentially affecting physiology, reproduction, biochemistry and ultimately survival. Impacts do not always conform to ecological theory based on differential resource allocation towards reproduction, which would predict females to be more sensitive to OA due to the higher production cost of eggs compared to sperm. Non-sex specific studies may overlook subtle but ecologically significant differences in the responses of males and females to OA, with consequences for forecasting the fate of natural populations in a near-future ocean. Figure 1. Overview of the systematic map process. Values (n = x) are the number of studies at each stage. Asterisk indicates partial record for number of papers published in 2016 as literature sourced on 22/06/ RP Ellis et al (2017) Does sex really matter? Explaining intraspecies variation in ocean acidification responses. Biology Letters 13(2): DOI /rsbl


20 Summary Experiments Models No experiments or studies are a perfect mimic for climate change. Except 1!!! Complexity and variability are all around us, and increases as we move across spatial, temporal and organisational scales. We need to except this and work with it. Appreciate where the system has been, in order to understand where it is going. Find ways to pull knowledge together to conceptually understand, but also challenge, the system and its response. Models and experiments need to coevolve.

21 Thank you