New trends in HVAC systems and equipment
|
|
|
- Rodney Stafford
- 5 years ago
- Views:
Transcription

1 All Seasons CLIMATE COMFORT Heating Air Conditioning New trends in HVAC systems and equipment Applied Systems Refrigeration Martin Dieryckx Environment research center Daikin Europe NV
2 EU policies Non Energy 20% less primary energy use compared to 2020 projections 20% Energy 61% 80% 80% of CO2 emissions in EU is caused by energy consumption Economy Global Warming ENERGY CO2 eq. emissions : 20% reduction by 2020 New proposal = 30% by 2020 (DG climate May 2010) Security of supply 20% share of Renewable Energy sources by
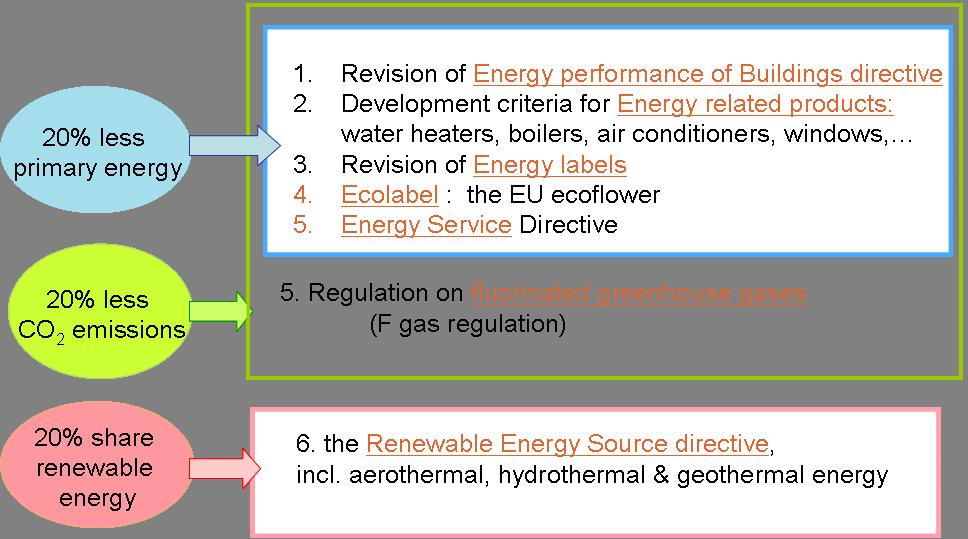
3 How is policy translated? % less primary energy 20% less CO2 emissions 20% share renewable energy Revision of Energy performance of Buildings directive Development criteria for Energy related products: water heaters, boilers, air conditioners, windows, Revision of Energy labels Ecolabel : the EU ecoflower Energy Service Directive 5. Regulation on fluorinated greenhouse gases (F gas regulation) 6. the Renewable Energy Source directive, incl. aerothermal, hydrothermal & geothermal energy 3
4 Energy facts in Europe 2015 Industry 27% 28% 10-25% 10-25% 10-25% Comfort Hot Hot Water Water Cooling 3% 41% 41% 31% 32% HVAC Buildings Others 20% 50-60% 50-60% Space Space Heating Hot 8% Water Comfort Cooling Others Space Heating 20% Energy for Transport % 2015and beyond Main portion (41%) of energy consumption is related to buildings Energy Performance of Buildings directive HVAC sector (33%) is largest energy consumer in the EU. Space heating and hot water heating are the major part while comfort cooling has a strong increase. To minimise the impact, we require drastic Energy efficiency improvements for hot water heating, space heating and comfort cooling equipment. Energy related product requirements in the EU 4
5 Energy performance of Buildings directive 5
6 Energy performance of buildings (EPBD) in the EU Direction is set towards net Zero Energy Buildings (nzeb) & Scope is extended before: more than1000 m2 Now : all buildings 6
 Energy")


 during a year.")

7 Nearly Zero Energy Buildings Level has to be defined by every member state Target newest EPBD : nearly Zero Energy Building (2020) Energy conservation e.g. Passive house Generation of renewable energy on site e.g. Photovoltaic, wind energy, Net ZERO ENERGY BUILDING Simplified definition: Produce as much primary energy (export) as you use (import) during a year. Remark: for residential: HVAC-energy for commercial: HVAC-energy + lighting Can both be nzeb High Efficient building Large energy savings low energy consumption small production needed See next page for Normal efficient literal definition building Standard energy savings standard energy consumption Large production needed 7

8 DEFINITION "nearly zero energy building" means a building that has a very high energy performance, determined in accordance with Annex I. The nearly zero or very low amount of energy required should to a very significant extent be covered by energy from renewable sources, including renewable energy produced on-site or nearby Annex I: The methodology shall be laid down taking into consideration at least the following aspects: (a) the following actual thermal characteristics of the building (including its internal partitions). (i) thermal capacity; (ii) insulation; (iii) passive heating; (iv) cooling elements; and (v) thermal bridges; (b) heating installation and hot water supply, including their insulation characteristics; (c) air-conditioning installations (d) natural and mechanical ventilation, which may include air-tightness (e) built-in lighting installation (mainly in the non-residential sector); (f) the design, positioning and orientation of the buildings, including outdoor climate; 8
9 Timing EPBD 2015: certain percentage of the buildings should be nearly zero energy shall be defined by the member states 2018: all new public buildings have to be nearly zero energy 2020: all new buildings have to be nearly zero energy General direction in view of EPBD Better insulation of buildings More tight buildings Better orientation of buildings Lower heating load, limited cooling load, Enhanced ventilation/ purification to keep indoor air quality High efficient ventilation/purification and hot water production including recovery techniques become more important 9

10 COMPARISON HEATING LOADS AND HEATING SYSTEM Comparison heating loads (Source: IEA HPP Annex 32) CURRENT PRACTICE Big investment VENTILATION ACCOUNTS FOR 50% of heat losses Low Energy house with heat reclaim ventilation: 45 kwh/m².y 10
11 What is the trend? -Most important for business = customers decision -Several factors will influence the customers decision: Tendency Cost BAT Tendency to decrease Legal requirement Incentives Total life cycle cost Running cost Tendency to increase due to energy prices Investment cost LLCC (least life cycle cost) Energy consumption kwh/year -Complex Customer perception of these factors will decide -Investment cost is always an important factor Legal requirements and incentives to move towards LLCC. 11

 EMITTERS 4 Fan Coils 5 LT radiators 6 Floor heating")
12 Heating Example Daikin Altherma, the intelligent way to comfort CAPACITY RANGE: - room heating : kw - domestic hot water: l Solar panel - room cooling: kw COMPONENTS: 1 Outdoor unit (6 types) 2 Indoor unit = Hydrobox 3 Domestic hot water tank (optional) EMITTERS 4 Fan Coils 5 LT radiators 6 Floor heating 12

13 Daikin launches a NEW heatpump series Heating Leaving water temperatures up to 80C Cooling Leaving water temperatures starts from 5C Domestic hot water Tank temperatures up to 70C First system in the world! 13


14 concept explanation Layout of the product: apartment with indoor unit and outdoor unit. 1 or more in/outdoor units Daikin altherma HT for apartment buildings and collective housing = 1 or more outdoor unit(s) + several indoor units => a modular system Heating Cooling outdoor = indoor outdoor unit Indoor unit + hydro box DHW tank Modular system 1 APARTMENT 5.6kW 5.0kW 9kW 8kW TOTAL BUILDING 23 kw 20 kw 1P, 230V 45 kw 40 kw Install separate outdoor units to reach higher capacities (separate systems) 3P, 400V 14
15 Energy related products directive and energy labels 15
16 Eco-design for energy using products (EUP) in the EU EU target = Top runner on global level Energy label as driver Extended to energy related products (ERP) 16
17 Framework directive10th 2009/125/EC REHVA WORLD CONGRESS Commissions Energy (ENER) and Enterprise (ENTR) 1. boilers 10.Airconditioner<12kW 20. Local room heating prod. 2. waterheaters 11. motors, fans, Central heat. prod hot air 3. PC 12. comm. Refriger. 22. ovens 4. copiers 13. dom. Refriger 23. Hobs & grills 5. TV, 14. dishwashers 24. prof.washing machines, dryers, dishwashers 6. Stand by loss 15. Fossil fuel burner 25. Non tertiary coffee mach. 7. Battery charger 16. Laundry driers 26. Networked stand by loss 8. Office lights 17. Vacuum cleaners ENTR 1 refrigeration 9. Street lights 18. Set top boxes ENTR 2 transformers 19. Domestic lighting ENTR 3 mulitmedia Studies finished ENTR 6 airco and ventilation Ongoing 17
18 EUP lot 1- boilers Market share %PE All technologies in 1 label on primary energy efficiency Vertical ground source HP Gas fired HP <1% Best air based HP Average horizontal groundsource HP <1% A % A++ 103% Best solar assisted gas boiler Micro CHP A+ 87% Best condensing boiler Average condensing boiler A 79% B 71% Ban in 2015 Best low temperature boiler Average low temperature boiler C 64% D 56% E 48% Improve energy efficiency = push for renewable energy F 40% 34% G 2% 8% 10% 12% 15% Low end low temperature boiler 30% Average atmospheric 15% low-end atmospheric Electric resistance 6% *based on available information, in EUP lot 1 18
19 EUP lot 10 - cooling present Rescaling of energy label. Ban of non inverter technology te r inver A B C D E F G 3,2 3 2,8 2,6 2,4 2,2 2,2 N on inver ter Future 2013 EUP A/C 12kW A+++ A++ A+ A B C D F G 7 6,4 5,9 5,2 4,3 3,6 3,1 2,7 2,3 A B C D E F G 7 6,4 5,9 5,2 4,3 3,6 3,1 Ban 2015 Ban 2013 Seasonal EER including standby and off mode 35C 19


20 Highest efficiency in its segment Split type unit Inverter controlled Temperature control Humidity control Ventilation 20
21 Renewable energy source directive 21
22 BE BG CZ DK DE EE IE EL ES FR IT CY LV LT LU HU MT NL AT PL PT RO SI SK FI SE UK National targets for % 2.2% 30% 20% 10% 40% Renewable energy share 13% 9.4% RES share inshare 2005in 2005 RES 16% 6.1% 13% 17.0% 30% 5.8% RES RES share inshare 2020in % 18.0% 3.1% 25% 16% 6.9% 18% 8.7% 20% 10.3% 23% 5.2% 17% 2.9% 13% 32.6% 15% 0.9% 40% 23% 11% 4.3% 13% 0% 10% 2.4% 14% 23.3% 7.2% 34% 15% 20.5% 17.8% 16% 6.7% 31% 24% 25% 14% 28.5% 38% 39.8% 49% 15% 1.3% 22


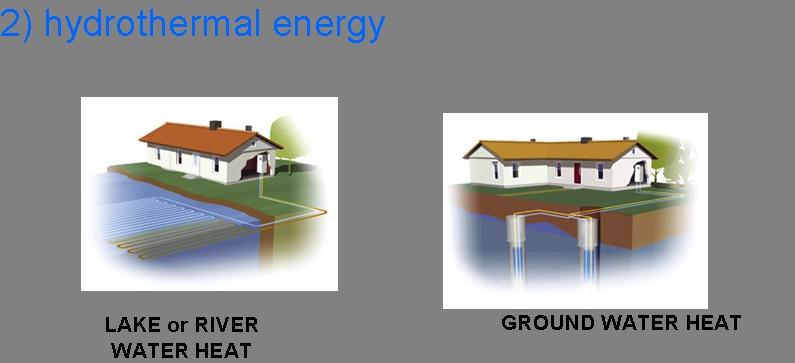

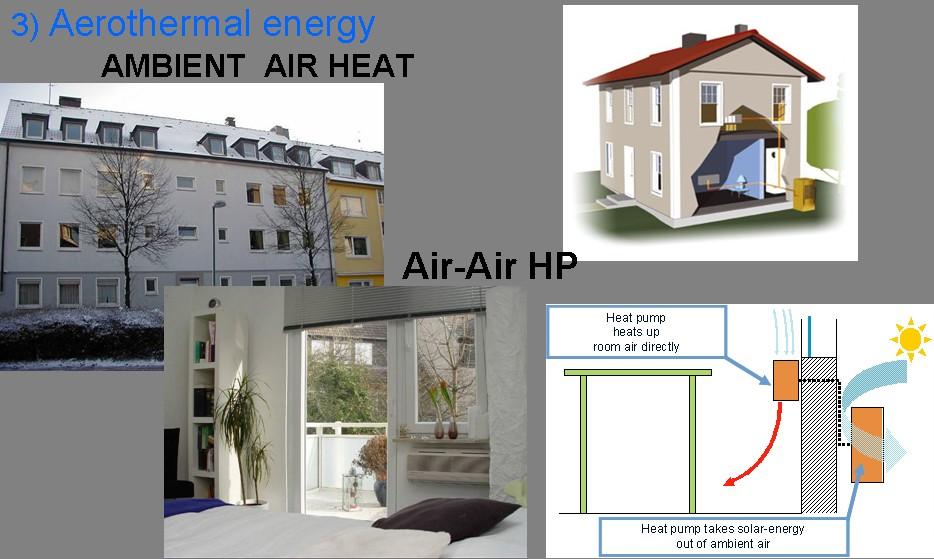
23 Air-, ground- and water energy are recognised as renewable energy Heat pumps are a tool to exploit these sources 23
24 How to count air-, ground- and water energy exploited with heat pumps Minimum requirements Counting of RES Primary energy 100 Power plant Electricity Renewable Ambient heat Useful heat >115 HP 24
25 Impact to the heat pump market CO2/kWh Power plant efficiency 0.4 Power plant CO2 emission 460 g/kwh Target 0 g/kwh Power plant efficiency is increasing CO2 emissions per kwh is dropping with zero emission target for 2050 Minimum requirement for SPF is decreasing SPF actual 2.88 Hydronic Heat pump Market forecast 2.63 Minimum requirement year Seasonal efficiency of heat pumps is increasing due to energy label 2.5 times times Depend on oil and gas price? year
26 Energy service directive 26


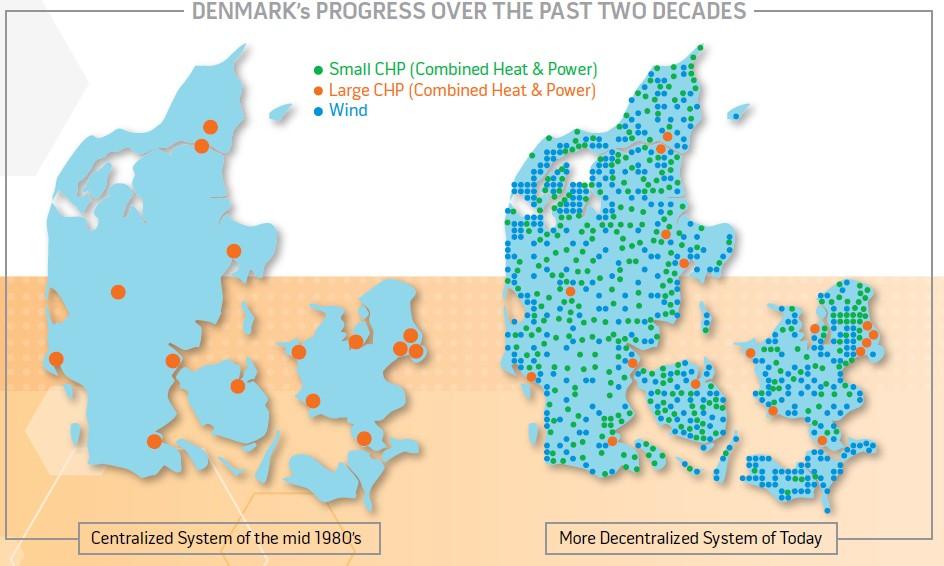
27 CURRENT GRID FROM Centralized, producer-controlled network Central power plant SMART GRID Merging of electricity infrastructure and communication infrastructure TO Less centralized and more consumerinteractive network 27
28 28
29 29
30 What role can the HVAC industry play? Adaptation of the electricity use to the intermitted electricity supply will become in important criteria for competitiveness in the market. The smart Grid requires smart Consumers. Building inertia can be considered as a huge energy battery Heat pumps can provide efficient hot water production and thermal energy storage -Intelligent use of the available electricity and energy storage technologies will become a key factor for HVAC systems. -The most economic solution will be the winner 30
31 Regulation on fluorinated gases 31
32 In case of Residential A/C Commercial A/C Energy-efficiencies Annual efficiency (APF) comparison (R410A ratio) Case of 4kW Room A/C by JRAIA Peak power comparison (R410 ratio) under cooling condition Outside 35C, room 27CDB/19.5 CWB HFO1234yf (1.2 kg) 5 HFC32 (1.2kg) 4 R290 (0.49kg) 3 R744 (CO2)(1.05Kg) 2 HFC410A (1.4kg) 1 0 Efficiency ratio Consideration: As for annual efficiency of APF, CO2 is the worst, HFO needs further optimization, and the rest of the candidates are equivalent to R410A Power ratio Consideration: A big difference exists in the peak power under cooling condition. HFO and CO2 will cause the peak power problem in large cities. Calculation conditions: HFO1234yf A/C is modified to improve efficiency, such as an increase in the pipe size of heat exchanger. Note: for cold climates CO2 shows good performance 32
33 Total overview of candidates Nedo conference (Feb 10) : Daikin view for refrigerant candidates : Application MAC Direct expansion AC Exist. refrigerant Possible new refrigerant HFC134a HFO1234yf, CO2 HFC410A High outdoor temperature, warm area HFC32 Other Cold area HFC32 CO2 Positive displacement chiller HFC134a Large size HFO1234yf HFC407C HFC410A Medium to small size HFC32 Other Centrifugal water chiller HFC134a Water heater, hot water heating HFC134a Hot water heating HFO1234yf HFC407C HFC410A Water heater & hot water heating HFC32 Other CO2 HFO1234yf Hot water supply only CO2 33
34 All Seasons CLIMATE COMFORT Heating Air Conditioning New trends in HVAC systems and equipment Applied Systems Refrigeration Martin Dieryckx Environment research center Daikin Europe NV