Utilization of Continuous Water Quality Monitoring for Assessing and Modeling Pollutant Export from Agricultural Catchments
|
|
|
- Vernon Cummings
- 5 years ago
- Views:
Transcription


1 Utilization of Continuous Water Quality Monitoring for Assessing and Modeling Pollutant Export from Agricultural Catchments Colin Ragush Andrew Sinclair, Dale Hebb (AAFC), Dr. Rob Jamieson

2 Water Quality and Hydrology in Agricultural Catchments Changes in hydrograph characteristics Larger peak flows Surface runoff Drainage tiles Sediment Transport Nutrient Export Microbial Contaminants

3 Beneficial Management Practices (BMPs) Agricultural management strategies that assure optimum plant growth while minimizing adverse environmental effects. Environmental aspects Soil conservation Water conservation Examples Nutrient Management Planning Time, method, type, and amount of fertilizer Conservation Tillage Buffer Zones Filter strips Riparian zones
4 Beneficial Management Practices (BMPs) BMP implementation is promoted by AAFC and provincial government agencies Significant investments in cost-sharing programs Key Questions: Which BMPs should be applied? Where should they be applied? What is the benefit?

5 Assessment of BMP Effectiveness Most BMPs have only been assessed at the plot or field scale Integrated assessments of BMP impacts at the watershed scale are lacking Measuring BMP impacts at the watershed scale presents several challenges: Pollutant export is episodic and driven by event hydrology How do we transfer results from monitored systems to other watersheds?

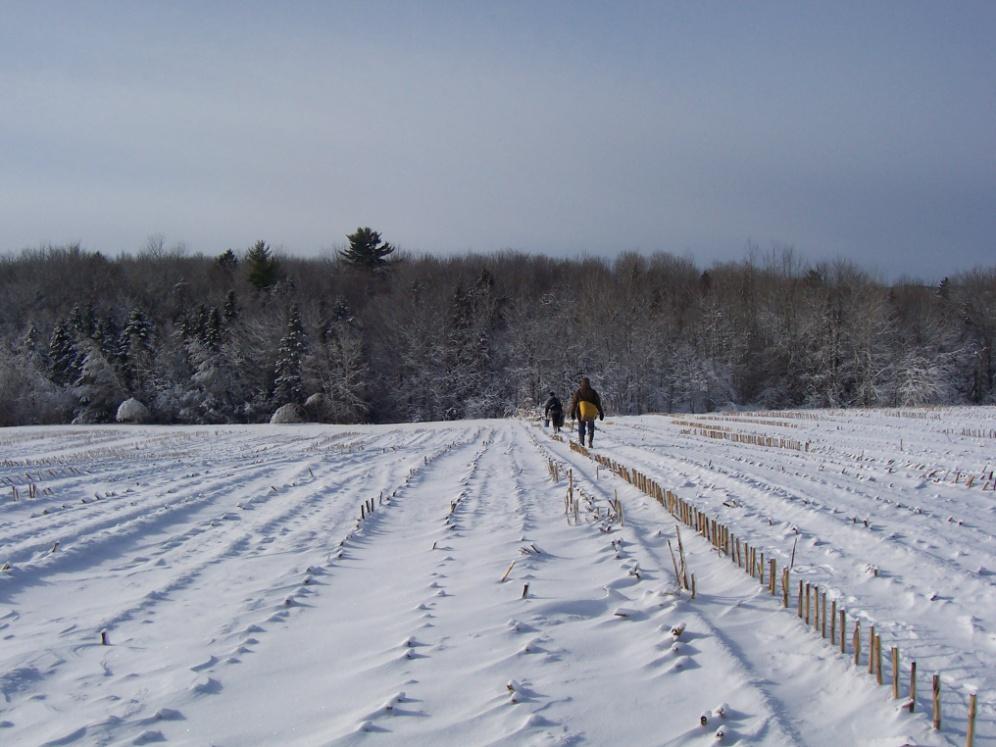

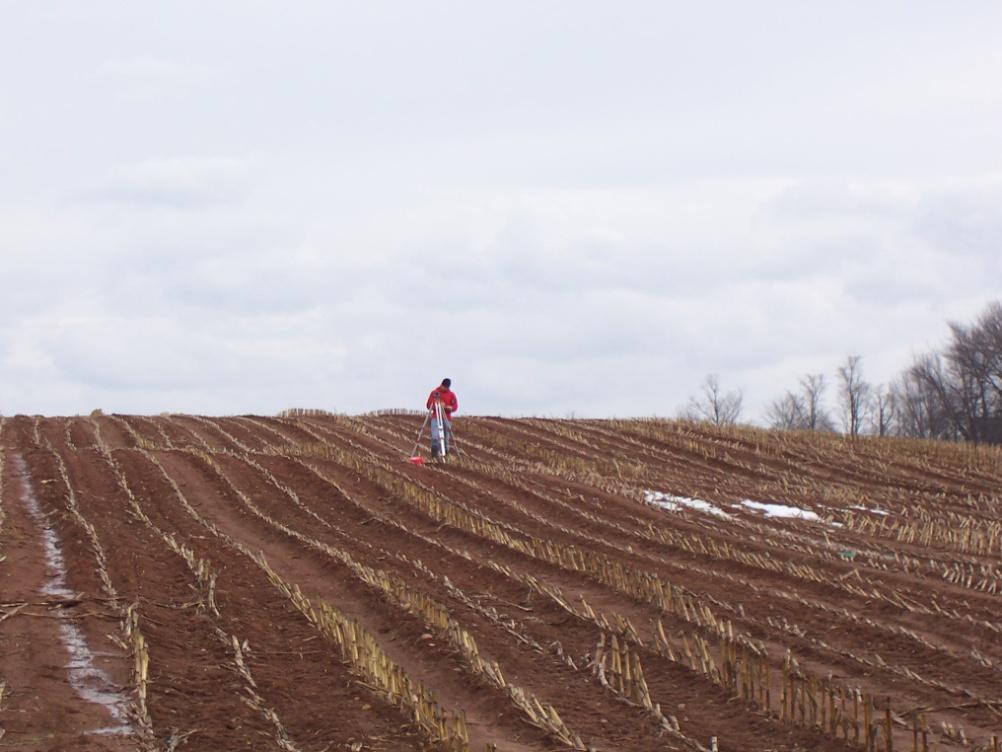
6 Dynamic Landscapes

7 Snide s Lake


8 Snide s Lake DT-1 DT-2 SN-7 SN-1 SN-10 SN-14 SN SN-4 SN-6 SN-12 SN-9 N
9 25.00 Continuous Monitoring at Snide s Lake TP Load (kg/day) Rainfall (mm) Date Rainfall DT 1 DT 2 SN 6 SN 3 AS Daily inflow TP loading, based on results of manual sampling program, out of Snide s Lake with precipitation data
")

10 Benefits of Continuous Monitoring The continuous monitoring program at SN-3 (Dec 2006 June 2007) had a TP load of 49 kg compared to 29 kg for the manual program for the same time period. (Sinclair, 2009)
11 Watershed Evaluation of Beneficial Management Practices (WEBS) Program Partnership of Agriculture and Agri-Food Canada with Ducks Unlimited Launched in sites Canada wide Components Measurement Measure impacts of BMPs on water quality at a watershed scale Modeling Develop and validate watershed simulation models Outcome Improved decision-support tools in agri-environmental science for BMP implementation


12 WEBs Sites

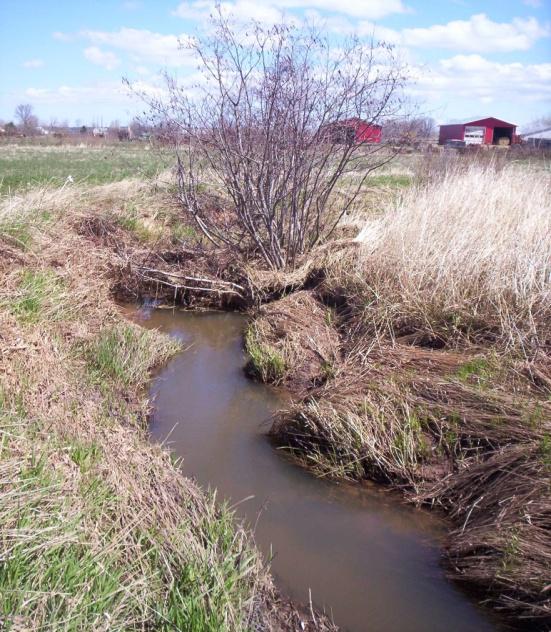
13 Thomas Brook Nova Scotia s WEBs Site
 and Post BMP")

14 Thomas Brook Watershed Monitoring Program BMPs Restricted Cattle Access to Riparian Zones Nutrient Management Planning Farmyard Runoff Management Monitoring Approach Pre ( ) and Post BMP ( ) implementation monitoring Nested watershed approach with 5 primary sampling stations equipped with continuous flow and autosampling instruments Continuous measurement of DO, ph, and temperature with YSI sondes

15
 5e+6 4e+6 3e+6 2e+6 1e+6 0 2001 2002 2003 2001 2002 2003 2001 2002 2003 C atchm ent 5 Catchment 3 Catchment 2 82% 22% 35% +")
16 Catchment Phosphorus Loadings Ilustration of Annual Variability Catchment 1 5 Catchment 2 Catchment 3 TP (kg ha -1 ) Col 1 1 vs vs Col Col 3 9 AVG 0 6e+6 Catchment 5 Catchment 4 Flow (m 3 ) 5e+6 4e+6 3e+6 2e+6 1e C atchm ent 5 Catchment 3 Catchment 2 82% 22% 35% + livestock
 is undergoing validation in most WEBS watersheds")

17 Model Development and Testing The Soil and Water Assessment Tool (SWAT) is undergoing validation in most WEBS watersheds Physically based computer simulation model developed by the USDA for predicting impacts of BMPs in mixed landuse watersheds
18 Overview of SWAT Continuous simulation model operates on a daily time step Most appropriate for long-term simulations Can predict impacts of land management practices on hydrology, sediment transport, nutrient export, and microbial water quality dynamics Computationally efficient and possesses user friendly GIS-based interface


19 SWAT Challenges Highly parameterized 25 parameters directly affect nitrogen species Not all parameters are measurable Integrated Watershed Model Assumptions or requirements of one sub-models might be overlooked Accurate calibration is a necessity to have confidence in model performance
20 SWAT Calibration and Validation Data requirements for calibration are intensive Requirements include: Year round monitoring Captures storm events Multiple years to account for annual variation Spatially targeted monitoring is needed to validate specific model processes
21 6.E+05 5.E+05 NSE = 0.84 R 2 = 0.90 Thomas Brook Calibration Total Monthly Flow (m 3 ) 4.E+05 3.E+05 2.E+05 1.E+05 0.E+00 Jan 04 Apr 04 Jul 04 Sep 04 Dec 04 Apr 05 Jul 05 Sep 05 Dec 05 Apr 06 Jul 06 Sep 06 Dec 06 Date Observed Simulated
22 1.E+06 NSE = 0.67 R 2 = 0.70 Thomas Brook Validation E+05 Total Monthly Flow (m 3 ) 6.E+05 4.E+05 2.E+05 0.E+00 Jan 07 Apr 07 Jul 07 Oct 07 Jan 08 Apr 08 Jul 08 Sep 08 Dec 08 Date Observed Simulated

23 SWAT Next Steps Calibration and validation of nutrient processed requires accurate land management data Nutrient transport will be calibrated and validated Alternative BMP scenarios will be examined

24 Summary BMP policies/strategies must be backed up with good scientific evidence BMP planning should be conducted at the watershed scale to ensure that BMPs have a positive effect on receiving water systems Continuous monitoring systems are required to verify BMP effectiveness and validate predictive tools