Highlights of CO 2 Science Jorge Sarmiento
|
|
|
- Jeffrey Mitchell
- 5 years ago
- Views:
Transcription
1 Highlights of CO 2 Science Jorge Sarmiento I. Carbon budget update for Sources: (1) Emissions from fossil fuel burning & cement production have surged (2) Estimates of land use change source may be converging. Sinks: (1) Atmospheric CO 2 growth rate has increased (2) Ocean uptake growth may have slowed. (3) Improved estimates of uptake by land plants and soils, but still a long way to go. II. A wedges report card III. Paleoclimate studies
2 Fossil fuel emissions have surged Carbon emissions from fossil fuels and cement Year Growth rate Period (%/yr) (20 yrs) (20 yrs) (7 yrs) 3.1 ( ) (G. Marland, 2007; 2005 and 2006 estimates based on BP energy statistics)
3 CO 2 emissions by top 10 emitters in CO2 Emissions (Pg C yr -1 ) USA China Russian Federation India Japan Germany Canada United Kingdom South Korea Iran G. Marland (pers. comm. based on BP energy statistics)
4 Land use source estimates may be converging IPCC-AR4 (2007) 1.4 ( ) 1.6 ( ) - Houghton (2007) 1.5 ± ± ± 0.8 Shevliakova, Pacala, et al. (in preparation) 1.1, ,1.4 - Land use emissions in Pg C/yr.
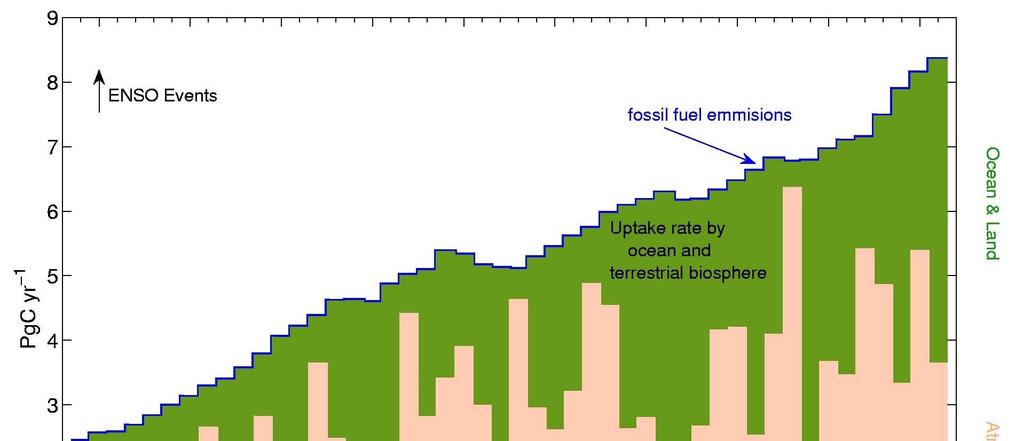

5 Atmospheric CO 2 growth rate has increased
6 Ocean uptake growth may have slowed Jacobson et al. (2007) ocean inverse Le Quˇrˇ et al. (2007) time varying model Lovenduski et al. (subm) time varying model uptake Ocean uptake in Pg C/yr. Uncertainty including interannual variability is 0.5 Pg C/yr.
7 Land carbon uptake estimated by difference Average % SOURCES Fossil fuel burning 5.5 ± ± ± % Tropical deforestation 1.4 ± ± ± % TOTAL 7.0 ± ± ± 0.9 SINKS Atmosphere 3.39 ± ± ± % 39% 47% 45% Ocean 1.6 ± ± ± % Land (by difference) 2.0 ± % 26% 2.8 ± % 29% 26% 2.2 ± % 29%
8 Land carbon budget for by region NET LAND (Jacobson et al., 2007) Sources (Shevliakova et al., in prep.) Sinks (Various & Phillips et al., in press) Unaccounted for Northern Hemisphere -3.0 ± 1.0 (sink) ± ± 1.1 (sink) Tropics & Southern Hemisphere +1.5 ± 1.1 (source) +1.4 ± 0.8 (deforestation) -0.8 ± ± 1.4 (source) Evidence for CO 2 fertilization continuous to be ambiguous. Sarmiento et al. (in prep.)
9 Highlights of CO 2 Science I. Carbon budget update II. A wedges report card A. Stabilization scenario revisited B. Avoided emissions revisited C. Report card III. Paleoclimate studies
10 Scenario for to stabilize CO 2 at 500 ppm (455 ppm in 2055) Atmospheric Land uptake: Ocean uptake: Allowable Units increase CO 2 fert. climate CO 2 disso. climate emissions Pg C ± ± ± 10-8 ± ± 40 Pg C yr ± ± ± ± ± 0.9 These simulations are the mean of 11 earth system models used in the IPCC 2007 AR4 report (Friedlingstein, pers.comm.) Note that CO 2 fertilization of land vegetation accounts for one-third of allowable emissions. Without this, the allowable emissions must be reduced by 34% Sarmiento et al. (in prep.)
11 Comparison of allowable emissions with Business as Usual. Table 1b. Avoided emissions required between 2005 and 2055 for the 500 ppm stabilization scenario based on the SRES low emissions B1 and high emissions A2r scenarios. Units B1 A2r SRES emissions Pg C Avoided emissions Pg C 190 ± ± 40 With land CO 2 fertilization wedges + 8 ± 2 15 ± 2 Without land CO 2 fertilization (4.6 ± 1.9 wedges) wedges 12 ± 1 20 ± 1 +A wedge is 25 Pg C of avoided emissions over the next 50 years. B1 is a low emissions BaU scenario A2r is a high emissions BaU scenario Avoided emissions are emissions that we must avoid if we are to stay on the 500 ppm stabilization scenario. Sarmiento et al. (in prep.)
12 Report card on the wedges Fossil fuel use: was assumed to be 7.0 Pg C yr -1 in 2005 it reached 8.4 Pg C yr -1 in 2006 and the growth rate has surged Avoided emissions were estimated at 7 wedges from 2005 to 2055 New estimate with the low emissions B1 scenario is 8 ± 2 wedges with CO 2 fertilization, 12 ± 1 wedges without it With high emissions A2r scenario, the corresponding numbers are 15 ± 2 and 20 ± 1 wedges The grade? Sarmiento et al. (in preparation)
13 Highlights of CO 2 Science I. Carbon budget update II. A wedges report card III. Paleoclimate studies A. Galbraith (Sarmiento group) coupled climate model development B. Bender climate reconstruction from ice cores 1. Mullins Valley, Antarctica, 10 MY ice, >0.5 MY CO 2 2. New initiative on Holocene ice cores C. Sigman polar ocean response to warming
14 New initiative: Collaborative studies of climate change in Holocene ice cores Lonnie Thompson library of ice cores from high elevation sites in tropics and temperate latitudes Last several hundred years dated by annual layer Prior periods contain undated records of temperature and precipitation (dust) Our contribution: date these cores by measuring concentration of methane (global synchronous changes; time histories from Antarctic ice cores Objective: New information about climate change during the last 10,000 yrs of warm climate Methane concentration QuickTime and a decompressor are needed to see this picture. 0 5,000 10,000 years
 +")
 = ice age stratification Brunelle et")
15 Evidence for stratification in the ice age North Pacific productivity (ice age: lower) + surface nutrient concentration (ice age: lower) = ice age stratification Brunelle et al., 2007
16 Polar ocean stratification in cold climates? Ice age observations (Antarctic, North Pacific): Reduced algal productivity but more complete consumption of upwelled nutrients implies increased stratification (reduced surface/deep exchange) Mechanism(?): Westerly winds shift equatorward during ice age, allowing fresh water to accumulate at the surface Colder ocean water makes a fresh water cap more able to reduce exchange Implications for anthropogenic warming: Most models predict Antarctic and North Pacific will stratify with warming Paleoclimate data for the ice age show the opposite sensitivity! If the ice age interpretation is right: - Antarctic and North Pacific will increase their overturning as climate warms - Naturally sequestered CO 2 will be released to the atmosphere - Algal productivity in these regions will increase and may change in character, affecting fisheries in unknown ways - Regional climate will change (e.g., perhaps reduced seasonality)