Vision 2020 and Beyond
|
|
|
- Christian Walton
- 5 years ago
- Views:
Transcription
1 Vision 2020 and Beyond Presentation to the CPS Energy Board October 5, 2009 Sustainable Growth Office
2 San Antonio Region is Growing - Bexar County Population Thousands 2,500 Census' newest population estimates show the Alamo City added more people than all but four other U.S. cities, growing by about 1.9 percent Express News July ,000 1,500 1, Source: Census data, Perryman report
3 Decade of 2020 and beyond Significant Power Gap 10,000 9,000 8,000 STEP Energy Efficiency 7,000 6, DG, Renewables, EE, or Other MW 5,000 4,000 3,000 2,000 1, Base Capacity (existing coal, gas, & nuclear) Calendar Year *Renewables shown as contribution to system peak demand % STP 3&4 Renewables*, DG
4 CPS Energy Anticipates Retiring 2300 MW of Gas Plants by 2030 DATE 2009/ 2010 PLANT (On-Line Dates) MW FUEL TYPE Tuttle/LCP ( ) 580 GAS STEAM TURBINE 2021 Braunig 1 (1966) 220 GAS STEAM TURBINE 2023 Braunig 2 (1968) 230 GAS STEAM TURBINE 2025 Braunig 3 (1970) 412 GAS STEAM TURBINE 2027 Sommers 1 (1972) 430 GAS STEAM TURBINE 2029 Sommers 2 (1974) 420 GAS STEAM TURBINE Total 2292
5 Sustainability Directive to Fill Power Gap starting in 2020 CPS Energy Board Sustainability Policy Vision 2020 Mission Verde All support a long term vision of utilization of renewable, distributed resources coupled with storage in a smart infrastructure.
6 April 5-7, 2009 Sustainability Workshop in San Antonio Building the Utility of the Future
7 Leveraging Ideas from Sustainability Report 3 rd Industrial Rev Reduce Bexar County GHG by 50% through EE and RE Renewable Energy Buildings as Power Plants Hydrogen & Energy Storage Smart Grid Infrastructure Requires $15-20B of investment $800 M per year over next two decades Initial new jobs of 1000 in 2010 Energy Efficiency Net gain in new jobs growing to 16,000
8 CPS Energy s Current Initiatives Pillar Programs Vision 2020 Goals Energy Efficiency Renewable Energy Buildings as Power Plants Storage STEP program Wind Solar Biomass Solartricity Producer program (10MW ) Pilot of 500kW, 2.8 MWh Zn- Br Flow Battery 771 MW 1200 MW No specific goals at this time Smart Grid AMI and Smart Grid ~700,000 electric meters by 2015

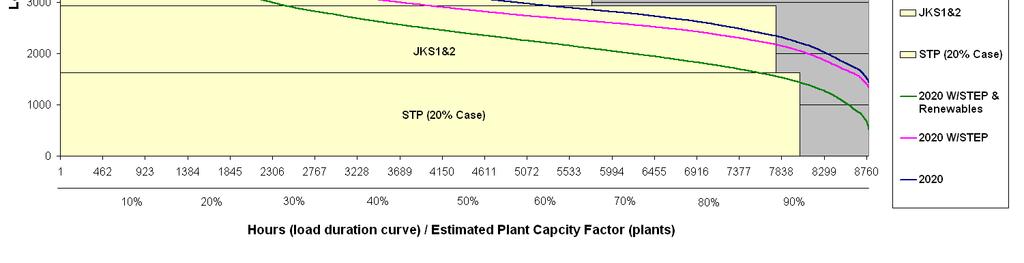
9 2020 Load Duration Curves 9
10 Renewable Plan 2020 August Hourly Output Peak Hour Meets Board 2020 Goals : - 20% of Peak Demand MW Solar 400 MW SA PV 10 MW (2019) SA PV 10 MW (2017) SA PV 10 MW (2015) SA PV 10 MW (2013) SA PV 10 MW (2011) West TX Trough - 40 MW (2012) Marfa Dish - 25 MW (2011) Sweetw MW (2007) CW Creek MW (2005) D Sky MW (2002) Cedro 150 MW (2010) South TX 100 MW (2015) Papalote MW (2010) Penascal 76.8 MW (2009) LFG B 8.0 MW (2012) LFG A 4.8 MW (2012) Covel 9.6 MW (2005) Hour of the Day 10
11 Challenges for Scaling DG Over the next decade, many issues need to be addressed to prepare for further expansion of Distributed Generation System Reliability Integrate advanced meters and smart grid technologies Managing power flow & transmission for 1000s generation/storage Generation and storage sources could reach 100,000s w plug-ins Affordability and Community Participation Keep bills and rates affordable relative to other cities Get customer participation in green programs How to address the up-front costs, even as bills get lower Technology Risk Which technologies will be utility scale and cost competitive When will utility scale energy storage be viable
12 Distributed Generation and Storage Technologies Generation Sources: Roof-top solar PV Ground mounted solar PV Solar Thermal Combined Heat and Power Geothermal Waste to Energy Local Wind River Hydro Algae Storage Solutions: Ice Storage CAES Battery Pumped Hydro Fly Wheel Super Capacitors Hydrogen
13 Filling the Gap Beyond MW 500 MW 500 MW 3000 MW 1500 MW Capacity Need * Distributed Gen Energy Efficiency 2025 Renewable STEP- EE Vision EE DG Total Capacity Total at Peak Storage Contribution * Capacity need shown assuming 20% STP 3&4, current STEP and renewable plans
14 Estimated Spend on Sustainability thru 2030 Vision 2020 $5.7B* Additional Energy Efficiency $1.9B** Distributed Generation ~ $2B Energy Storage TBD Total ~ 9.6B *Includes STEP, Renewable Energy spend thru 2030, AMI **Nexant 2009 Analysis (likely to be lower if spread out through 2030 vs 2020)
15 Process Moving Forward Reach out to Partners Finalize Sustainability Plan Community Workshops Energy Summit Set firm goals, funding mechanisms, and bill impact Strategic Plans and Budgets