The Energy Nexus. Esc Energy in History
|
|
|
- Sabina Stewart
- 5 years ago
- Views:
Transcription
1 The Energy Nexus Energy in History Domestic animals and slaves Biomass and wind and water power supplement till 18 th century Coal and the steam engine (ships and locomotives) late 18 th century Oil, gasoline and diesel (internal combustion followed by turbines) late 19 th century Nuclear by 1950s Wind, photovoltaic and batteries known since early 20 th century, but not up-scaled until recently 1

2 Coal Oil Gas Primary Energy Sources Classification Nuclear Combustionable renewables and waste Hydro/Geothermal/Solar/Wind 2


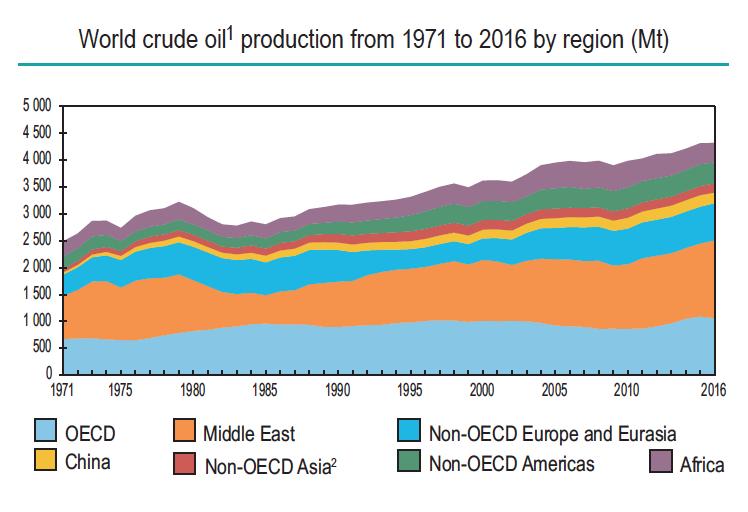
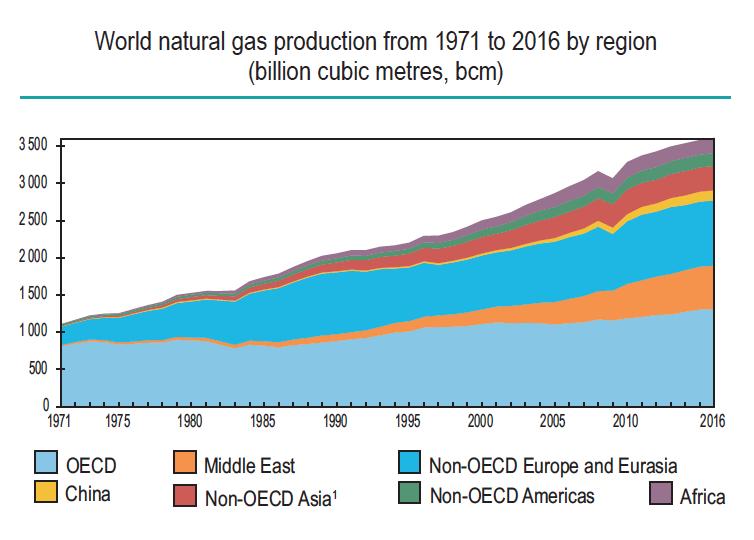
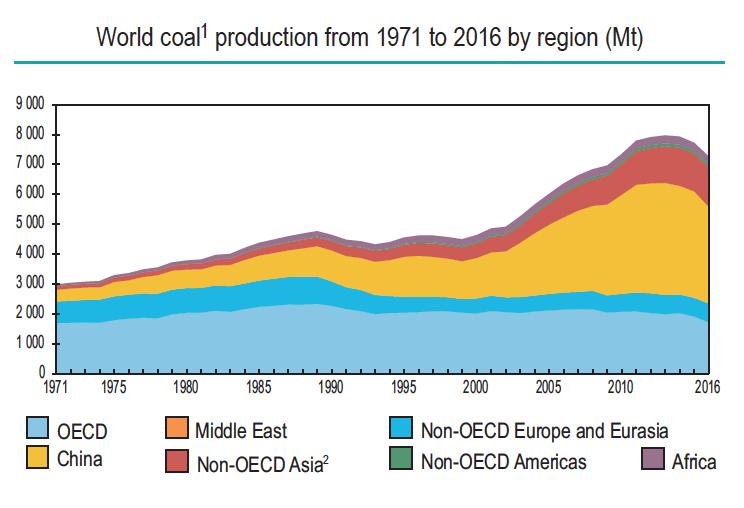
3 World total primary energy supply by fuel International Energy Agency, available at: 3
4 4

5 5
6 IEA New policies Scenario According to WEO-2017 of IEA, four largescale shifts in the global energy system scene: Rapid deployment and falling costs of clean energy technologies Growing electrification of energy Shift to a more services-oriented economy and a cleaner energy mix in China Shale gas and tight (shale) oil in the United States Global economics growth by 3.4%, world population reaching at 9 billion, very fast track urbanization: Global energy demand rising by 30%. Largest share in demand growth comes from India and Southeast Asian countries. Natural gas and renewables will be the leading components to meet the rising demand; the share of coal declines, oil stagnates. By 2030, China will be the largest nuclear energy producer, overtaking US. 6
7 Renewables capture two-thirds of global investment in power plants as they become, for many countries, the least-cost source of new generation. By 2040, total share of renewables will reach at 40% Electricity is the rising force among worldwide enduses of energy, making up 40% of the rise in final consumption to To meet the rising demand, China needs to add the equivalent of today s US power system to its electricity infrastructure by 2040, and India needs to add a power system the size of today s European Union. China is entering a new phase in its development, with emphasis in energy policy now firmly on electricity, natural gas and cleaner, high efficiency and digital technologies. US, with the shale gas and tight oil revolution, is a net exporter of gas, and will become a net exporter of oil by late 2020s (accounting for 80% of the increase in oil supply by 2025). Till 2020s low oil prices, afterwards, declining reserves, more oil and higher prices. LNG (liquified natural gas) will account for the 90% percent of the increase in long distance gas trade to

8 China s emissions plateau by 2030 and then start declining. The outcome of projections is far from enough to avoid severe impacts of climate change. 8


9 Will there be a peak of oil? 9
10 Theoretically yes! But when and how? Fundamentals behind Hubbert s curve With increased cumulative production, production increases (the reinforcing production loop) With diminishing reserves, production declines (the balancing depletion loop). All other factors influencing the scale and timing of the peak on the Hubbert s curve: Total reserve? How about unproven and emerging reserves, ex. tight oil? Development in alternative primary energy resources Development in demand Pattern (increase peak and decline) robust but the timing and the scale of the peak, highly uncertain The constraint is not the reserve under the soil but the atmospheric sink Therefore keep the oil under the soil! 10
11 Further discussion Can natural gas be a transition resource? Can nuclear energy be transition resource? Natural gas Saves carbon compared to coal, at about 40% There are abundant gas resources worldwide (proven reserves increasing with the fracture shale gas technology Pipeline and LNG (liquified natural gas) shipments via sea freight is spreading 40% is not enough for global climate targets and the socio-technical lock-in in gas fueled infrastructure risks developments in genuine renewables, i.e. solar-wind and hydro 11

12 Nuclear Power Today Worldwide, there are >441 nuclear power plants operating. About 70 under construction. Last decade, nuclear based electric production increased by 2.5% per year. More than 30 countries own or install nuclear power plants. The nuclear power landscape once more changed after the Fukushima accident in Japan in Now, the developed nuclear nations are trying to maintain their installed capacity. China and India are investing heavily. There are newcomers i.e. Turkey. Germany and Sweden are phasing out. 12
13 A brief history of nuclear power Research on the structure of elements and radioactivity in early 20 th century The Manhattan Project, the acquisition of the bomb by USA in 1945 and Hiroshima and Nagasaki massacers Launching of the peaceful nuclear era after the second world war Signing of the NPT Treaty on non-proliferation of nuclear weapons Rising of the global anti-nuclear concern in 70s, deregulation of utilities in USA, 1979 Three Miles Island Accident The last power plant was ordered in US in By 2020 %27 of US nuclear capacity will be out of commission (if not rehabilitated). 13

14 How Nuclear Power Works Nuclear energy involves changes at the atomic level through Fission: a large atom is split into two smaller atoms of different elements. Fusion: two smaller atoms combine to form a larger atom of a different element. In both fission and fusion the mass of the product is less than the mass of the starting material, the lost mass is converted to energy, according to E=mc 2 14
15 Fuel for nuclear power plants All current plants use uranium-235 for fission. To make nuclear fuel, uranium ore is mined, purified into uranium dioxide, and enriched (U-235 separated from U-238). When U-235 is highly enriched, the spontaneous fission of an atom can trigger a chain reaction. A nuclear power plant reactor is designed to sustain a continous chain reaction but not allow it to amplify. This is achieved by modest enrichment, 4%U-235 and 96% U
.")
16 Aspects of nuclear power assessment Uncertainty in geographic and temporal span of potential impacts; Problems of safe radiation doses ; minor-major accidents; nuclear waste deposition. Eventual discounting of impacts on future generations. Problems of safe radiation doses ; minor-major accidents; nuclear waste deposition. Military externalities (positive or negative?). Climate change debate (see the documentary, climate of hope. 16
17 Safe radiation doses! Health screening studies show that the cancer incidents are higher among the communities living around nuclear power plants Read famous medical doctor, Samuel Epstein and cell biologist John William Gofman ( ) Time lags in cause and effect, slow gradual development of cancer confuses public discussions on safe radiation doses Major accidents Three Miles Island, 28 March 1979, Pennsylvania. Chernobyl, 26 April 1986, Ukraine: estimated long range cancer related deaths between and Fukushima, March 2011, Japan. 17
18 Nuclear wastes Disposal of nuclear wastes Short term containment for short lived isotopes: in 10 years 97% radiation is lost. Long term containment for long lived isotopes: the real challenge, EPA recommends 10,000 year minimum containment; National Research Council of US 100,0000 years. Geological burial for long term containment is not practiced yet! Worldwide, nuclear waste is building 10,000 tons per year. All stored on site near nuclear power plants. While dismantling decommissioned plants, more nuclear wastes will be generated than produced during its entire lifetime. Storage of waste creates problems within developed nations, being transported to less developed countries. 18
19 Nuclear Armement NPT Treaty on non-proliferation of nuclear weapons, came in force in countries joined, five of them recognized as nuclearweapon states: USA, USSR, UK, France, China. Elements of the treaty: Non-proliferation Disarmement Right to access to peaceful use of nuclear power. Current nuclear-weapon owners: Original five (grandfathering nuclear weapons) + illegal weapon bearers Red colored not signed the treaty. Other colors, with different accession dates. 19
 are violated.")
20 Nucelar weapons distribution Blue: NPT designated Red: Other states Dark blue: NATO nuclear weapons sharing Gree: States formerly possessing Yellow: Believed to have nuclear weapons. Nuclear Power Controversy Summary Values matter. Compensation is difficult, often not considered at all. People s rights (safety standards) are violated. Rate of time discount, not applicable to economic calculations, considering far reaching impacts. Discontinuities are highly likely. Uncertainties are not equal! Therefore cannot be assessed on the basis of economic rationality and cost-benefit analysis methodologies 20
21 A final note on plutonium externality! Plutonium needs to be stored for years. Parsimoniously discount its influence on future generations with a rate 0,01% Mega cost of disposal discounted for over years: M/(1+0,0001)^ = close to 0 That is, in economic calculation, present value of the future cost is close to 0. Cost/benefit calculation does not care about generations far ahead. 21