Inflow and Infiltration/ Sewer Overflow Reduction Program Part 2. October 13, 2011
|
|
|
- Cynthia McCormick
- 5 years ago
- Views:
Transcription

1 Inflow and Infiltration/ Sewer Overflow Reduction Program Part 2 October 13, 2011
2 Our Agenda for this Meeting Brief recap from Part 1 Additional approaches to consider for I/I Reduction
3 Recap from Part 1
4 Definition of Inflow, Infiltration, and I/I Inflow Rainfall that enters the sewer system through direct connections, such as downspouts and area drains that are connected to sewer laterals. Infiltration Rainfall that accumulates in sewer trenches and then enters the sewer system through failed joints and structural problems (e.g. cracks and holes in pipes: Pre 1958 pipes leak)

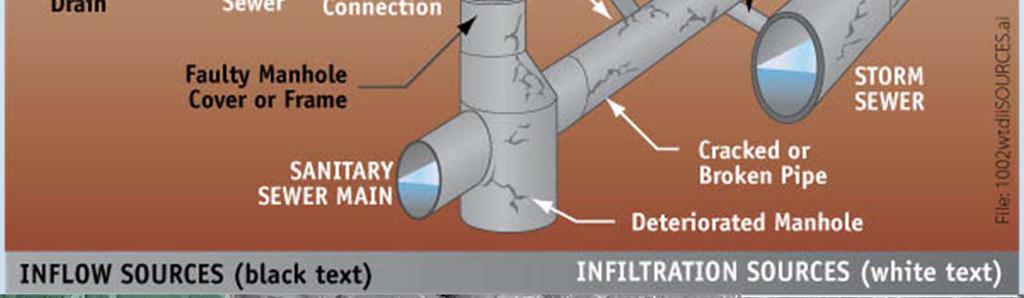
5 Points of Entry for I/I

6 Relative Contribution to Infiltration Lower Laterals 20% Upper Laterals 13% Gravity Sewer Mains 33% Manholes 33%

7 Maximum Infiltration Reduction is 70% 30% Residual Infiltration


8 Some Areas have I/I Sources
9 Where we Stand on I/I LGVSD has Moderately Elevated RDI/I 1,000 gallons per acre per day at upper limit of 10 State Standards for modern sewer system design EBMUD satellites range from 2,000 to 17,000 GPAD 690 gallons per capita per day is above the EPA guideline for excessive RDI/I of 275 gallons per capita per day Current Peak Hour I/I 20 MGD Peak Hour Wet Weather Flow of Record = 22 MGD Average Dry Weather Flow = 2.3 MGD
10 LGVSD s Options for Reducing/Eliminating Effluent Blending Develop an Optimum Combination of Approaches: Reduce RDI/I entering the sewer system Increase secondary treatment capacity Construct storage for flows exceeding secondary treatment capacity until flows subside following storm events
11 Existing I/I Reduction Programs Manhole Sealing* Smoke Testing CCTV Inspection Sewer Main and Lower Lateral Rehabilitation Offering property owners opportunity to have upper laterals included in sewer rehabilitation projects at a lower cost but paid by the property owner. Realtor Disclosure Form* Buyers are advised to obtain a video inspection of the sewer lateral. * Not included in Part 1 presentation. Added here for completeness.
12 Approaches to Consider for Increased I/I Reduction
13 Additional Approach #1 Public Outreach and Education Description: Continue/expand Public Outreach and Education as part of I/I Reduction Program Low cost Anticipated direct impact on I/I is small Comments: Impact depends on responsiveness of public, but will have limited direct impact on I/I. Necessary to increase participation in programs and for political and financial support of programs.
14 Additional Approach #2 Include Incentives/Disincentives for I/I Reduction in Rate Structure Description: Incentives and Disincentives could be uses to increase voluntary efforts to reduce I/I from private sewer laterals: Incentive: Reduced cost of lateral rehabilitation: Optional rehabilitation during sewer main rehabilitation (in place) Annual bids for lateral rehabilitation Low interest loans Lateral repair/rehabilitation insurance Disincentive: Increased annual sewer service charge for properties not inspecting their lateral
15 Additional Approach #2 (cont d) Comment: Number of property owners that would participate is unknown Complications would need to be addressed: Who pays the additional cost? Nexus between fee and actual cost Adverse public reaction to disincentives
16 Additional Approach #3 Include Upper Laterals in Gravity Sewer Rehabilitation Program Description: Current Sewer Rehabilitation Projects include the lower lateral and are estimated to reduce I/I by 40%. Adding all of the upper laterals to a project: Increases I/I reduction from 40% to 70% Cost per upper lateral rehabilitation lower due to economy of scale Adds 15 25% to the cost per mile, but reduces cost of I/I eliminated by 50% Comment: Complications would need to be addressed: Work on private property Long term liability Who pays the additional cost?
17 Estimated Cost of Adding Upper Laterals to Sewer Rehabilitation Projects Current Approach Add Upper Laterals Sewer Mains, Manholes, and Lower Laterals $1,000,000 $1,000,000 Upper Laterals $0 $230,000 TOTAL COST $1,00,000 $1,230,000 RDI/I Reduction Effectiveness 40% 70% RDI/I Eliminated per Mile 0.2 MGD 0.3 MGD Cost per gallon per day of I/I Eliminated $6.90 $4.80
18 Additional Approach #4 Public Ownership of Residential Private Sewer Laterals Description: District takes responsibility for ownership and maintenance of 8,800 residential private sewer laterals. Comments: Benefits from public ownership include: Fewer SSOs from residential laterals and sewer mains Effective at reducing I/I Complications would need to be addressed: Work on private property Long term liability Who pays the additional cost? Impact on local sewer contractors
19 Additional Approach #4 Workload, Annual Cost, and Staffing Activity Estimated Annual Number of Events Estimated Annual Cost Estimated Additional Staffing, FTE Respond to Service Calls 750 $210, Cleanup, Investigate, and Report Overflows , Property Damage Claims , Clean Laterals to Prevent Overflows (Scheduled Cleaning) 4, , Repair Laterals , Replace Laterals 500 1,250, Administration and Overhead 1,100, Total 4,100,000 14
20 Any Questions?