2/17/2017. Energy Accounting & Education. Topics (Electricity) Creating Electricity
|
|
|
- Kellie Beatrix Hensley
- 5 years ago
- Views:
Transcription
 Creating electricity Defining degree days Customer charges Types of rates Energy usage")

1 Energy Accounting & Education Energy Managers Kermit King School District of La Crosse John Daily School District of Holmen 1 Topics (Electricity) Creating electricity Defining degree days Customer charges Types of rates Energy usage Demand charges Taking control of your electric bill Creating Electricity Electric generators have large quantities of copper wire spinning around inside very large magnets at very high speeds to create electric current. How Electricity is Created 3 1


2 Generation, Transmission and Distribution Provided by Edison Electric Institute 4 Major Electric Lines and Service Areas 5 Degree Days Degree Day - indicates how far a day's average temperature departed from 65 o F Heating Degree Day measures heating energy demand; indicates how far the average temperature fell below 65 o F (cooler weather = more heating demand) Cooling Degree Day measures cooling energy demand; indicates how far the temperature averaged above 65 o F Smaller values = less fuel demand 6 2


3 Customer Charges Recurring charges for administrative activities for maintaining a customer account (also referred to as service charges Includes billing, metering, and meter reading 7 What s a Kilowatt? Kilowatt (kw) - One kilowatt equals 1,000 watts ( watts each) Kilowatt-hour (kwh) - Basic unit of electric energy = one kilowatt of power supplied to or taken from an electric circuit steadily for one hour One kilowatt-hour equals 1,000 watt-hours 8 Time of Use Rate Rates that vary by the time of day that the electricity is used Higher rates are charged during hours of peak system usage Lower energy costs by shifting use to off-peak hours when electricity costs less May require a special meter 9 3

4 On-Peak vs. Off-Peak Rates On-Peak Rate: Period between 9:00 a.m. and 9:00 p.m., Monday through Friday, when most energy is used Excludes weekends and holidays Off-Peak Rate: Includes all hours not included in the on-peak period 10 Power Factor The ratio of real power (kw) to apparent power (kva) at any given time in an electrical circuit Goal of electric utilities: power factor of 1 (unity power factor) If less than one, utility has to supply more current to the user = more line losses Must have larger capacity equipment in place Facilities are charged a penalty if their power factor is much different from 1 11 Capacitor An electrical device that maintains or increases voltage in power lines Improves the efficiency of the electrical system by compensating for inductive losses that produce wasted energy 12 4

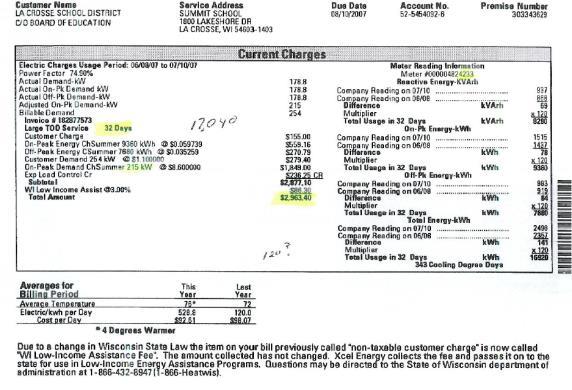
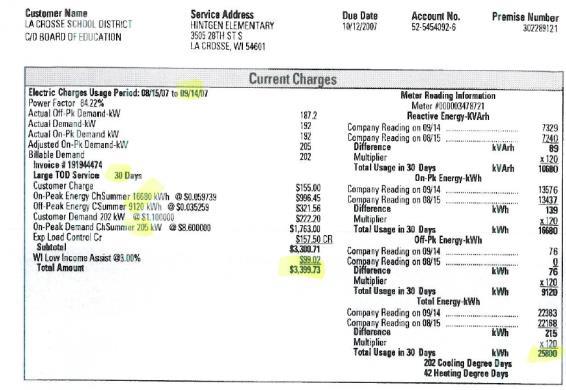
5 Sample Bill Current Charges $4, Electric Billing Period: 11/014/16 to 12/17/ Heating Degree Days, 0 Cooling Degree Days Meter# Actual Reading on 12/17 24,179 Actual Reading on 11/14 23,731 Difference 448 Meter multiplier X 80 Usage in 30 Days (kwh) 35,840 Total On-Peak Consumption 9 a.m. to 9 p.m., Monday-Friday 17,120KWh Total Off-Peak Consumption 18720KWh Facility Power Factor Sample Bill: Demand Charges Current Charges $4, Electric Charges Period: 11/14/16 to 12/17/16 Customer Demand Charge: $1.750 $ On-Peak Demand Charge: $ $ 1, Facilities Charge $ Non-taxable Customer Charge (3%) $ Off-Peak Energy Charge: 18,720 $ $ On-Peak Energy Charge: 17,120 $ $ 1, Saver Switch Load Control (Credit) $
 System")

6 Billing Demand System Demand (KW) System Demand (KW)
7 7
 Total Energy Used (KWH) 22 Renewable Energy Electricity produced by sources that can be replaced naturally and do not involve burning fossil fuels or use of nuclear energy Considered less")
8 Energy Use Graph Dec-05 Nov-05 Oct-05 Oct-05 Sep-05 Jul-05 Jun-05 May-05 Apr-05 Mar-05 Feb-05 Jan-05 On-Peak Energy Used (KWH) Off-Peak Energy Used (KWH) Total Energy Used (KWH) 22 Renewable Energy Electricity produced by sources that can be replaced naturally and do not involve burning fossil fuels or use of nuclear energy Considered less harmful to the environment because it results in less air pollution, emissions, and waste compared to electricity produced from traditional sources Includes solar, wind, geothermal, and biomass 23 Taking Control of Your Electric Bills Follow best practices with these systems: Lighting HVAC Air conditioning/chillers Air handling equipment/ventilation Controls Domestic hot water/booster heaters Demand limiting controls 24 8


9 Lighting In school facilities, lighting accounts for about 65% of the electric bill. De-lamp where possible Use reduced-wattage lamps: 25-watt and 28-watt T8 technology L.E.D. Technology Complete lighting retrofits 25 Lighting Update Average energy savings: T12 to T8 Fluorescent: 25% to 50% HID to Fluorescent: 25% to 60% Incandescent to Fluorescent: up to 75% HID to HID: up to 25% Old HID/fluorescent applications mounting heights: Fluorescent: up to 15 ft HID low bay: 15 to 25 ft HID high bay: 20 ft and up New fluorescent up to 50 ft Fluorescent not usable in applications that are too hot, too cold, or too dirty 26 LED Lighting 27 9


10 Results of Lighting Upgrade 28 HVAC High efficiency upgrades/replacements Air conditioning DX units, Rooftop, Chillers Air handling equipment VFD Drives on fan motors Keep track of ventilation needs Large Space Occupancy Sensors Controls DDC conversion, occupancy driven, scheduling 29 Chiller Options 30 10
: Scheduled with occupancy Drives on larger pumps Booster Heaters Consider natural gas or chemical wash options to reduce demand.")
11 Air-Handling Units 31 Domestic Hot Water Convert electric water heaters to gas to reduce demand. Pumping energy (circulated systems): Scheduled with occupancy Drives on larger pumps Booster Heaters Consider natural gas or chemical wash options to reduce demand. 32 Demand Limiting Controls Use a more sophisticated approach to lock out stages of cooling equipment to control peak demand. Use a peak demand strategy to monitor and control facility (smart building)
12 Any Questions? 34 Energy Accounting & Education Natural Gas Energy Managers Kermit King School District of La Crosse John Daily School District of Holmen Topics (Natural Gas) Effects of deregulation Sources of natural gas Transportation of natural gas Major gas supply lines Comparing fuel prices Understanding your gas bill How to reduce your gas bill 12
13 Before Deregulation Residential Schools Industrial Gas Utility Gas Pipeline Gas Producer 37 After Deregulation Residential Schools Industrial Gas Utility Marketer Gas Producer 38 Sources of Natural Gas 39 13


14 Natural Gas: From Wellhead to Burner Tip 40 Natural Gas Transportation System Supply Customer Purchased by utility Transported by utility Distributed by utility Maintained by utility Billed by utility Transportation Customer Purchased by marketer Transported by marketer Distributed by utility Maintained by utility Billed by both 41 Natural Gas Pipelines 42 14


15 Major Gas Lines and Service Territories 43 Gas Pipeline Network 44 Factors Contributing to Gas Cost Actual purchase price of gas Gas transportation costs PSC regulates utilities, not marketer Market fluctuations Price-locking Combination of weather and market determine the savings in any given year Utility price versus transportation price 45 15
16 Comparing Fuel Costs Btu s per unit #2 Fuel Oil = 139,000 btu s/gallon Propane = 91,600 btu s/gallon Kilowatt Hour = 3,412 btu s Therm = 100,000 btu s 46 Conversion Multipliers From alternate fuel to natural gas Multiplier Propane 1.09 #2 Fuel Oil.72 From natural gas to alternate fuel Multiplier Propane.92 #2 Fuel Oil Fuel Conversion Example If the price of natural gas is $.8364 per therm, should you consider burning propane? Formula: Multiplier x cost of natural gas = equivalent cost Use multiplier from table = X $.8364 = $.77 per gallon Burn propane if it costs less than $.77 per gallon

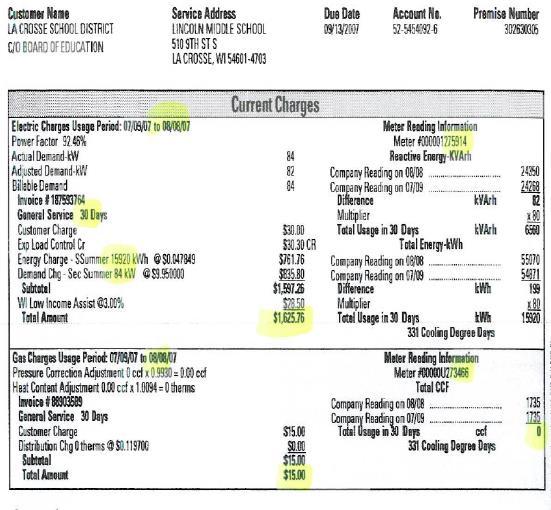
17 Sample Natural Gas Bill


18 Taking Control of Your Gas Bills Best Practices Using Gas HVAC: Boilers and furnaces Controls, scheduling and outside air Hot water delivery and pumping Domestic hot water Cooking equipment 52 HVAC High-efficiency heating system upgrades: Condensing technology Steam to hot water conversion Boiler management system Outdoor air reset 53 Condensing Boilers 54 18
19 Saving Energy with Hot Water Systems Set pumping schedule according to occupancy Install drives on larger pumps Insulate hot water pipes 55 Saving Energy with Control Systems Pneumatic to DDC conversion Schedule occupancy correctly (tighten up) Reduce outside air in large air spaces 56 Saving Energy with Domestic Hot Water Install a high-efficiency hot water heater Schedule pumping with occupancy 57 19

20 Energy Efficient Kitchen Equipment Consider high-efficiency appliances when upgrading Information and incentives available at 58 Any Questions? 59 20