Lecture 7 Solar Energy Solar Resource Physical principles of solar conversion (elec.) Solar conversion technologies Photovoltaics
|
|
|
- Sylvia Nash
- 5 years ago
- Views:
Transcription
1 Lecture 7 Solar Energy Solar Resource Physical principles of solar conversion (elec.) Solar conversion technologies Photovoltaics Principles, technologies, systems, costs, markets Assessing PV output

2 Global solar energy resource ref: Science

3 Peter Lund 2015

4 Geographical distribution of the solar resource Yearly horizontal solar insolation on globe varies from 600 to2500 kwh/m 2 Finland: kwh/m 2, inclined surface yields % more Central Europe kwh/m 2 Sun belt > 1500 kwh/m 2 per year
, diffuse radiation (much")
5 Solar spectral energy Solar energy = energy of the photons: solar spectrum~ 0,3-3 m (UV, visible, IR); it corresponds the spectrum of a black body at 6000 K Solar power = integrated the spectrum over all wavelengths ~ max 1000 W/m 2, water vapor absorbs strongly Direct solar radiation (no clouds), diffuse radiation (much clouds)

6 Various paths from photons to different forms of solar energy Peter Lund 2007
7 Direct conversion of solar energy Thermal and electric conversion paths (=direct solar energy) Solar thermal: absorption of solar radiation and production of heat Solar electricity: a) production of high-temperature heat for conventional turbines, b) direct conversion into electricity (photovoltaics, PV)
8 Solar thermal systems (solar heating)
 Net heat is a balance between absorbed heat and heat losses (see right) Flat plate solar collectors : U L 3.")
9 Solar thermal conversion Solar heat (low temperature) Black surface absorbs radiation (e.g. selective absorbers) Net heat is a balance between absorbed heat and heat losses (see right) Flat plate solar collectors : U L W/m 2 K ; vacuum tubes U L < 2 W/m 2 K Main applications related to hot water, space heat, process heat Radiation = I Ambient T =T a transmission absorption= T heat Heat loss factor U L Net heat yield per surface area = I - U L (T-T a )/ High temperature applications Concentrating solar collectors (U L U L /C, C=concentration ratio) C max =40,000 -> T=6000 K Main applications electricity production, material research, lasers
10 How to estimate the solar production? Step 1: Solar radiation on the surface (I sol, W/m 2, kwh/m 2 /year) Step 2: Conversion efficiency ( =from radiation to final energy) Step 3: Losses per unit area (Q loss ) Step 4: Thermal energy produced: A I sol - A Q loss = W or kwh Solar device area (A, m 2 ) Other examples 1) PV yield= A I sol 2) Concentrating solar power CSP yield = A [ opt I sol (direct radiation) - U L (T-T a )/C], C= concentration ratio, opt =optical efficiency (around 0.8)
11 Concentrating solar power plants (CSP)
 concentrators Concentration ratio C= collecting surface area/absorbing surface area; heat losses drops as 1/C C= 60-100 400 o C C >200 600-1000")
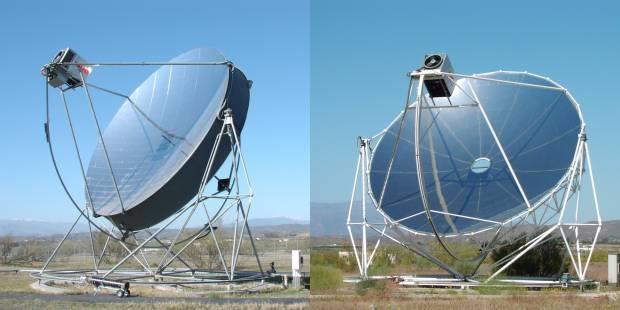
12 Concentrating solar radiation Only direct radiation can be concentrated to a focal point 2D or 3D solar tracking Parabolic surfaces, heliostat (flat mirror) concentrators Concentration ratio C= collecting surface area/absorbing surface area; heat losses drops as 1/C C= o C C > o C
 Yearly effiency 15-25% Heat storage 5-7 hours more")

13 Principle of a CSP (parabolic trough) Concentrator + steam rubine (Rankine) Yearly effiency 15-25% Heat storage 5-7 hours more operational time per day Large CSP: 350 MW (USA); Spain MW Under construction 1000 MW potential in EU 2025 around 37,000 MW Costs /MWh

14 Large solar tower plants

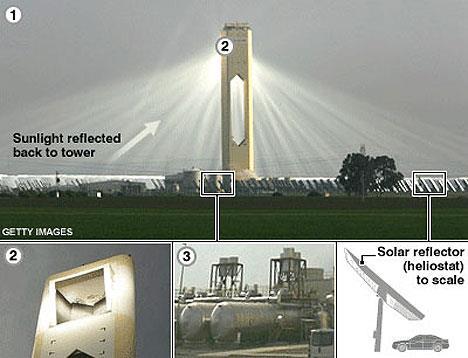
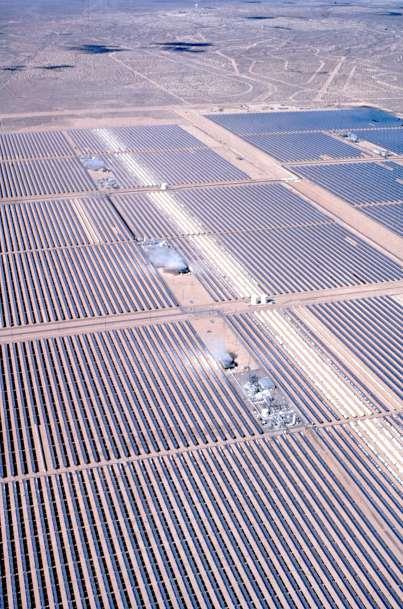

15 Examples of CSP


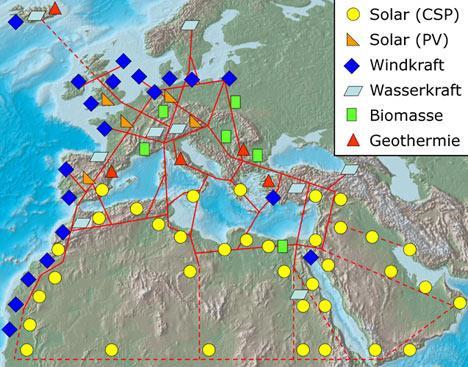
16 European supergrid (Desertec): solar from the dessert into Europe
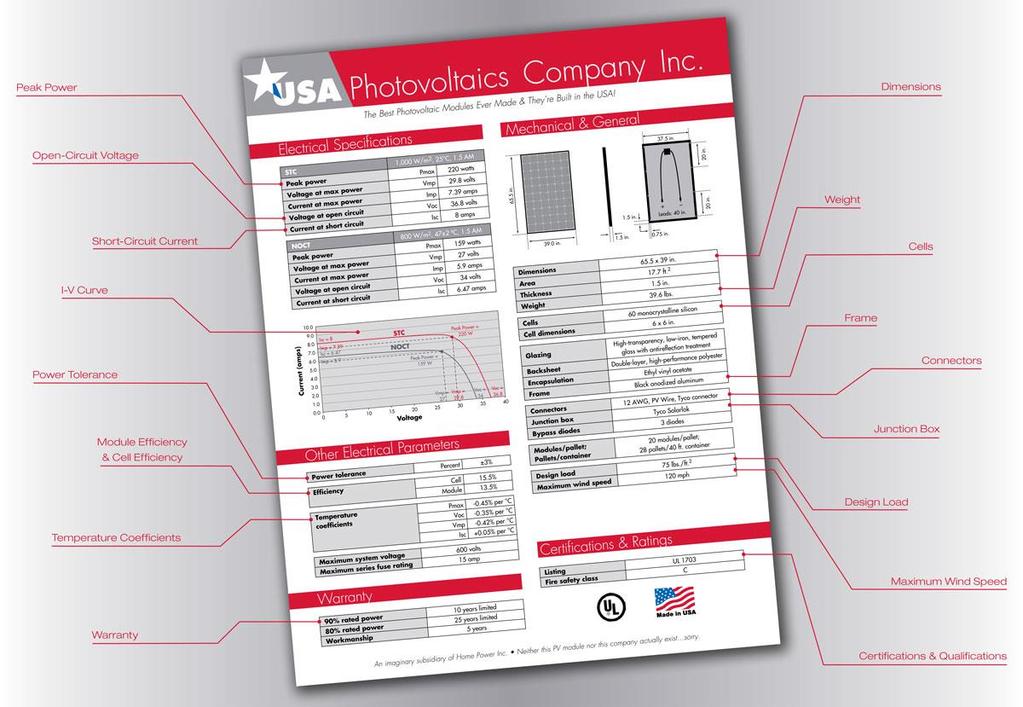
17 Direct solar electricity (Photovoltaics) Principles PV module and yield PV technologies Manufacturing PV system PV costs, markets and trends
 Structure of a solar cell P- and N-type semiconductors (doped) form a junction Photon absorption creates a electron-hole-pair, the junction separates these, these charges move in")
18 Principles of photovoltaics Photovoltaic effect : a photon excites an electron to a higher energy level e - and makes it mobile; the band gap needs to be suitable for the photon (spectral matching, e.g. semiconductors) Structure of a solar cell P- and N-type semiconductors (doped) form a junction Photon absorption creates a electron-hole-pair, the junction separates these, these charges move in the internal electric fields to the + and - electrodes Different loss mechanisms, e.g. recombination, junction imperfections, defects, contacts, etc Solar cell types Silicon solar cells (ultra pure Si, crystalline, multicrystalline, m thick) Thin film solar cells (CIGS, a-si, CdTe, < 10 m) 3 rd generation solar cells(polymers, TiO 2, 1-2 m) Main challenges: price, volume, efficiency e - e - e - Conducation band Photon e + e - e - Valence band
 The minimum photon energy to make electrons mobile is equal to the bandgap If photon energy > bandgap, the excess energy is wasted With one material, theoretical efficiency is")
19 Theoretical efficiency of a solar cell The bandgap of the semiconductor is defined as the different of the conduction and valence bands (the electron needs to jump over this to produce electricity) The minimum photon energy to make electrons mobile is equal to the bandgap If photon energy > bandgap, the excess energy is wasted With one material, theoretical efficiency is around 30%
20 Equivalent circuit model of PV Bandgap/material determines the voltage of a unit solar cell (U), e.g. around 0.7 V Current production I(U)= I L - I D = I L -I 0 exp(qu/kt-1) Shockley diode equation; q=unit charge, T=temperature, I L =photocurrent The I-V curve describes the electricity production P max,teor = I sc U oc I sc =short circuit current (U=0) U oc = open circuit voltage (I=0) Ic I L I D U Radiation increases Fill factor (FF) FF = (I U) max / P max,teor Describes how well the solar cell is built and how optimal it is U


21 From PV Cell to Module PV value chain: material wafer cell module array system Several cells in series increase voltage (current constant) Several cells in parallel increase current (volage constant)
22
23 Power production of PV Solar cell Solar module (several cells; if in series increases voltage, in parallel then current increases) Solar module power production: Conversion efficiency (%) x system efficiency (%) x solar module area (m 2 ) x solar radiation (W or kwh per m 2 ) For example Si-solar module in southern Finland: 0.18 x 0.9 x 1 x 1100 kwh/yr= 162 kwh (per m 2 of module) Maximum instantaneous power: 1m 2 =1000W (solar intensity) x 18% (efficiency=180 Wp (so-called peak watt) 180Wp yields 162 kwh/yr 0.9 kwh/w p ~ 1 kwh/w p Temperature drops the efficiency by 0.5%/ o C (20 o C) Partial shading of Si-modules may drop efficiency (by-pass diodes)

24 Si =300 m PV technology paths Si =150 m Si =3 m CuInSe 2 = 10 m TiO 2 =10 m


25 Single-crystalline( c-si) and multi/polycrystalline( p-si) cells need ultra pure silicon Silicon technology c-si is produced from Siwafers (sawing) and p-si from molds; thickness m, >90 % of all solar cells are Si-based Commercial cells 17-20%, 22% underway
26 Thin film solar cells Photoactive layers are made from thin films on a substrate, e.g. by sputtering Amorphous silicon (a-si) (6-10%) Copper-Indium-Gallium- Diselenide CIGS cells(>16%) CdTe (>18%) Lends themselves to roll-to-roll mass production
27 Multilayer thin films Layered structure with semiconductors employing different parts of the spectrum; longer wavelengths penetrate deeper For example, triple-junction a-si Theoretical efficiency with n=10, η>50% possible; how about n=50?
28 Concentrating PV Lenses or mirror to increase solar collecting area, focuses on a smaller PV area (material savings) Temperature! GaAs cells (space solar) or Si (low concentration ratio)

.")
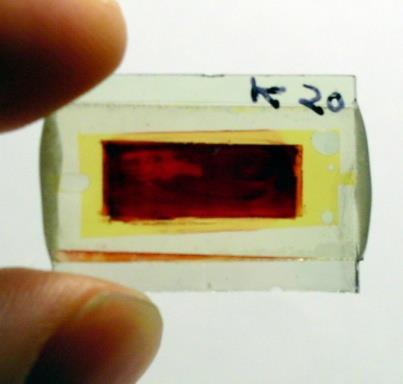
 known as N3dye or N-719 for the ditetrabutylammonium salt of N3Þ")
29 Future: Dye-sensitized nanostructured mesoporous TiO 2 solar cells organic hole conductor currently used is 2; 20;7; 70-tetrakis-(N;N-di-p-ethoxyphenyl-amine)-9,90- spirobifluorene (spiro-meotad). ruthenium complex cis-rul2ðncsþ2 (L-2,20- bipyridine-4,40-dicarboxylic acid) known as N3dye or N-719 for the ditetrabutylammonium salt of N3Þ has been the sensitizer in mesoporous C6370 Peter TiO Lund Peter Lund
30 Solar fuels photoelectrochemical conversion Absorption, Excitation, Transport-processes Chlorophyll, cumarine, different dyes (A) electricity: A+ h A * A + e - chemistry: A+ h A * A + G (Gibbs free energy) CO 2 CH 3 OH H 2 0 H 2 N 2 NH 3 P * +R+H 2 0 P * +R - +H 2 0 h P+R+H 2 0 G catalysts P+R+1/2 H 2 + 1/4 O 2
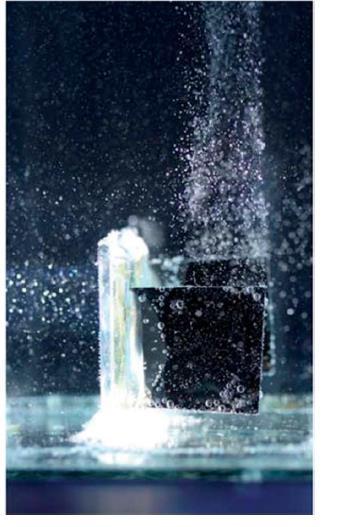
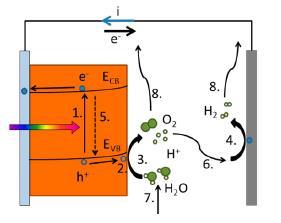
31 Photoelectrochemical water splitting device Water+light Hydrogen+Oxygen 1.23 V to split a water molecule

32 Evolution of PV efficiencies
 Solar PV in 2014/2015: $0.")


 Larges factories (xgwp) Better and")
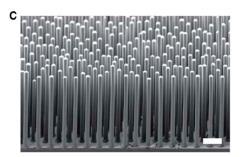
33 Opportunities for innovations in solar PV technologies (Otaniemi) Solar PV in 2014/2015: $0.6/Wp average module price production capacity 70 GWp; sales 40 GWp Next 5 years: $0.4/Wp average module price? Reducing soft costs Higher efficiency cells (black-si, PERC) Innovative technologies (perovskites) Larges factories (xgwp) Better and cheaper BOS (grid and data management, etc.) Peter Lund 2015


34 Manufacturing technology of PV Si cells Typical factory MWp/a Investment <0.5 /Wp Economies of scale REC > 1000 MWp/yr production line in Singapore Sharp, Konarka 1000 MWp/yr units underway
35 C-Si line


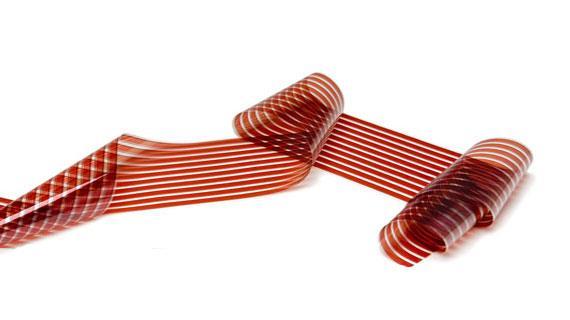


36 Mass-production (roll-to-roll) of solar cells Source: Janne Halme

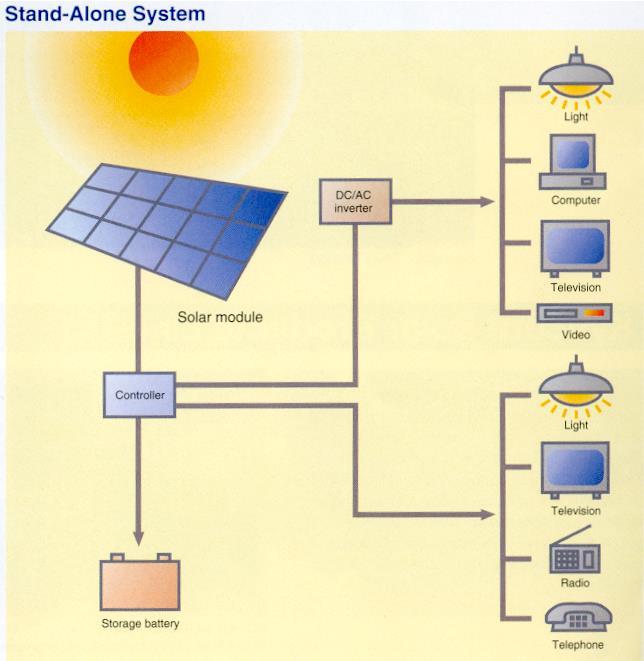
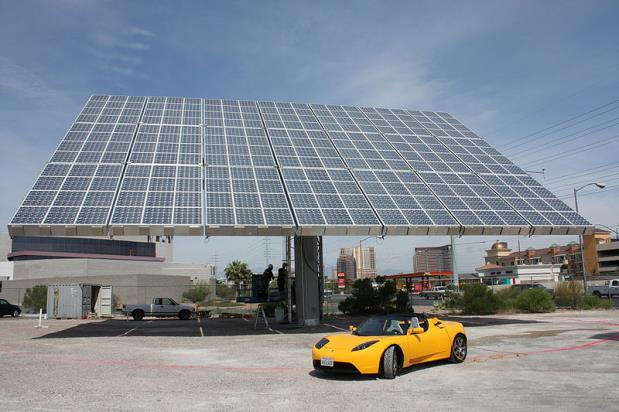
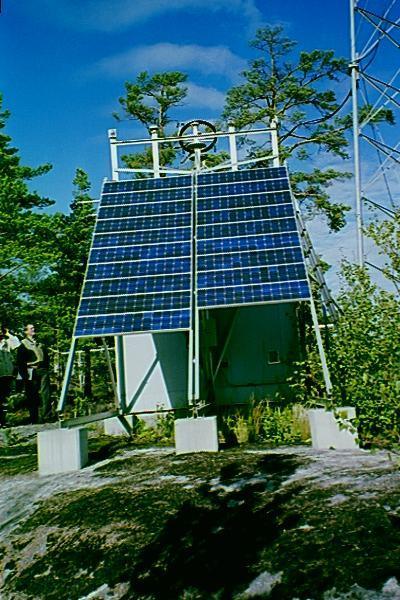
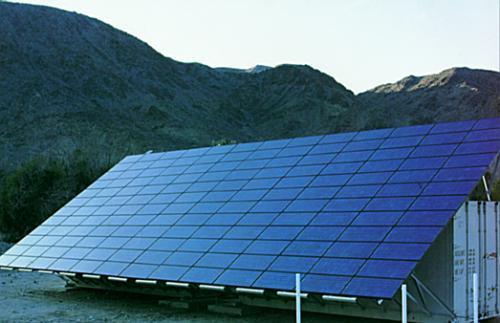
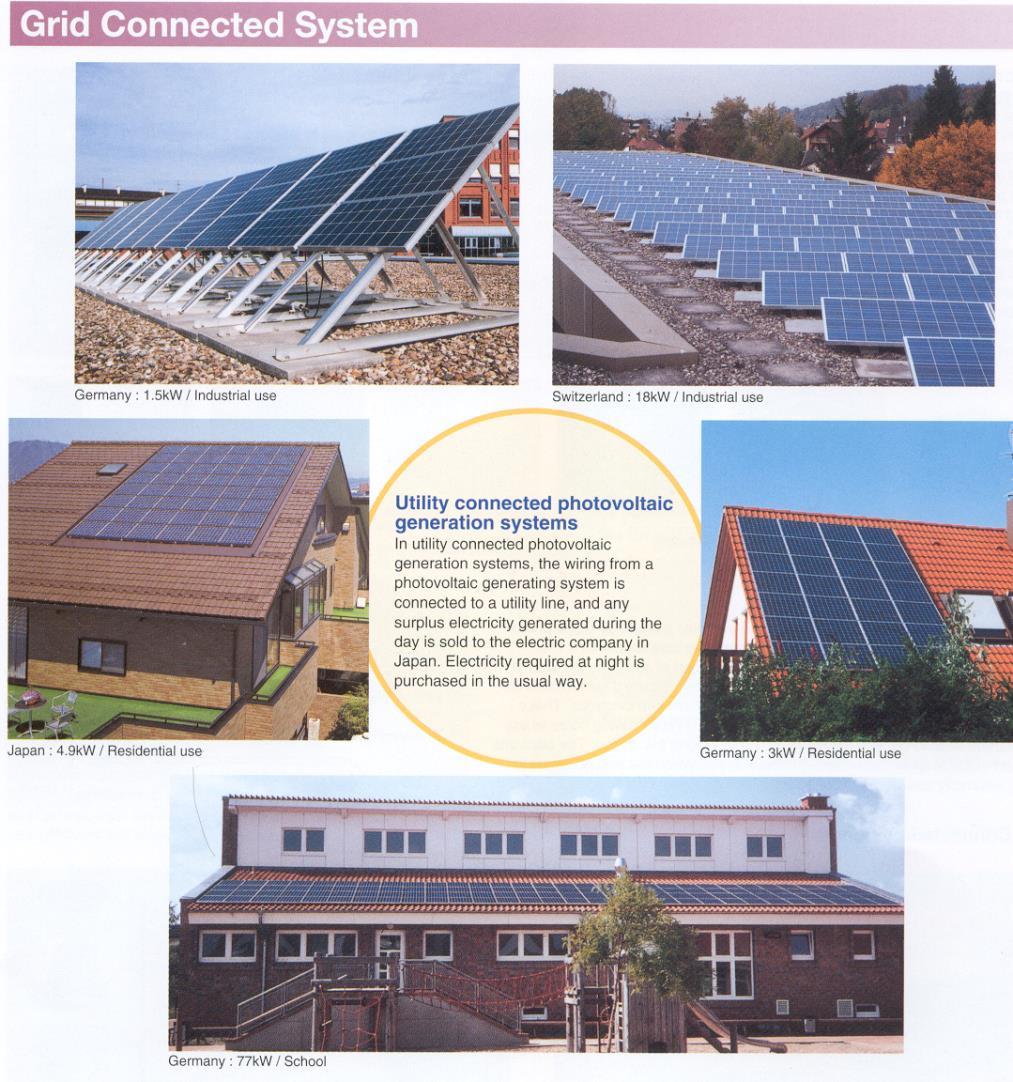
37 PV system principles

38


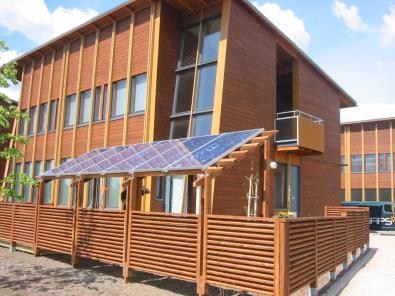
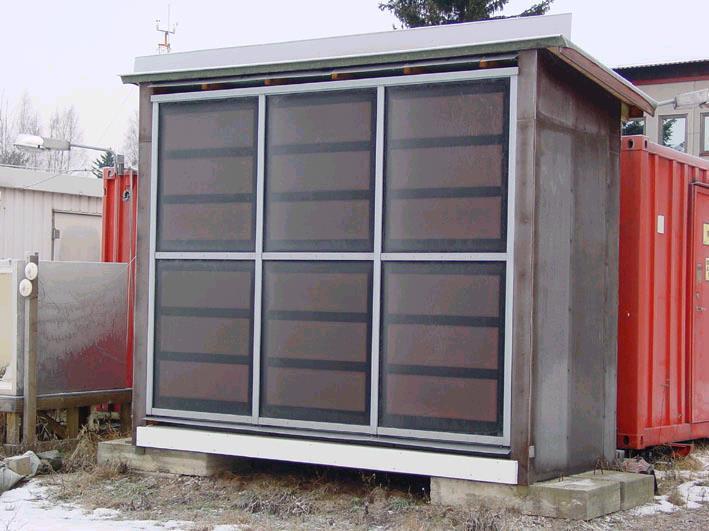
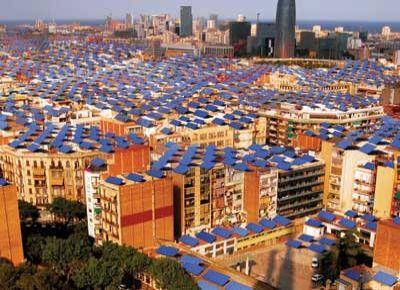
39 BIPV, building integrated PV


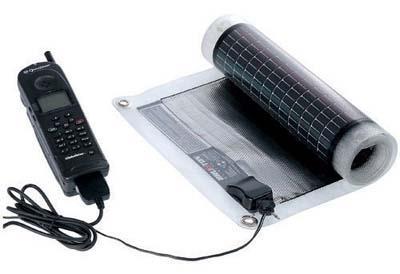
40 Plug and Play energy systems
41

42 Effects of variable renewables on load profiles No RE Much RE Peter Lund 2015
, Energy Technology Perspectives 2014, Peter OECD/IEA, Lund")
43 Smart infrastructures & system integration & Built environment International Energy Agency (2014), Energy Technology Perspectives 2014, Peter OECD/IEA, Lund 2015Paris

44 Investments in renenwable energy power Peter Lund 2015
 Asia >60% of the market China 1/3 of all investments Reference: IEA Medium Term Renewable Energy Market Report 2015OECD/IEA,")
45 Near-term trends in Renewable Power and Solar PV Solar PV : $ billion in investments (system cost $1.5-2 per Wp) Asia >60% of the market China 1/3 of all investments Reference: IEA Medium Term Renewable Energy Market Report 2015OECD/IEA, Paris Peter Lund 2015
46 PV system cost, $/Wp Solar electricity, TWh/yr Rapidly falling costs of PV PV system cost (historical) PV system cost(future) learning curve (27%) Ref: Clean Energy (2013) nuclear-like expansion oil-like expansion average fast growth 20% ceiling 20% of world electricity % of world electricity ,1 0 PV modules (2014) $.53 W p -1 ; PV systems (2014) $1.65 W p -1 PV system (2020+) $1 W p -1 global cost-parity PV share of world electricity 2015 < 1%; By 2050: 5% (slowing progress) 25% (fast-track) Ref Lund PD. Fast market penetration of energy technologies in retrospect with application to clean energy futures. Applied Energy (2010), doi: /j.apenergy ; P.D. Lund:Exploring past energy changes and their implications for the pace of Peter penetration Lund 2015 of new energy technologies. Energy 35 (2010) ; P.D. Lund. How fast can businesses in the new energy sector grow? An analysis of critical factors. Renewable Energy 66 (2014)
 Pre 2020: $1.")
47 How much will PV system costs come down? 2011: cost of commercial scale roof-top PV system $2.9 per W p 2014: 1.7/Wp in Germany; PV module /Wp Pre-2015: $1.7 per W p (-40%) Pre 2020: $1.2 per W p (-30%), some estimates at $1/Wp Ref: McKinsey: Solar power: dark before dawn, April 2012

48 International Energy Agency (2014), Energy Technology Perspectives 2014, OECD/IEA, Paris