From No to Go. Getting a Direct Potable Reuse (DPR) Project Approved and Operational in Texas
|
|
|
- Albert Banks
- 5 years ago
- Views:
Transcription


1 From No to Go Getting a Direct Potable Reuse (DPR) Project Approved and Operational in Texas


2 Wichita Falls Overview Population 104,000 Serves Total 150,000 customers 104,000 City of WF 36,000 Potable Wholesale 10,000 Raw Wholesale
3 The Current Problem Loss of Rainfall The annual average rainfall for the Wichita Falls area is 28.5 inches. Normal In 2011 we were 15.5 inches below normal. 20 In 2012 we were 8.75 inches below normal. In 2013 we were 7.24 inches below normal. 10 So far, in 2014, we are 6 inches below normal

4 The Current Problem Record Temperatures Wichita Falls typically averages 28 days over 100 degrees Normal In 2011 we had 100 days. The Weather Channel ranked Wichita Falls the #1 Worst Summer anywhere in the U.S. for Days In 2012 we had 50 days. In 2013 we had 32 days. In 2014 we had 21 days.


5 The Current Problem Continued Drought
6 The Current Problem Lake Level Decline


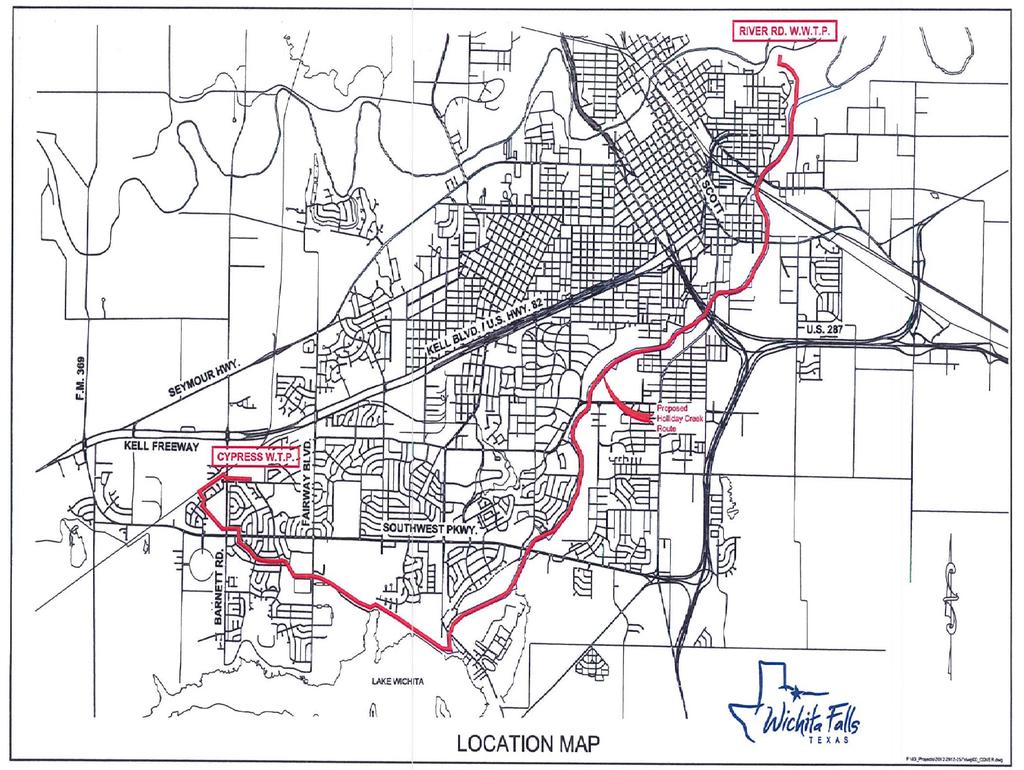
7 What s the Plan EMERGENCY DIRECT POTABLE REUSE


8 Wastewater Effluent Quantity? The River Road WWTP averages 12 MGD discharge to the Big Wichita River. Drought reductions have lowered that to 7.5 MGD. Using the Reverse Osmosis would generate 5 MGD of source water. Blended with 5 MGD water from Lakes would produce 10 MGD water for health and sanitation needs.


9 Wastewater Effluent Quality? The River Road WWTP effluent has been tested for the last 16 months for numerous regulated and nonregulated compounds. Wastewater Effluent currently meets all 97 drinking water standards, with the exception of: Nitrate Trihalomethanes Microbials


10 Wastewater Effluent Quality? Nitrate estimated 80% removal through Reverse Osmosis. Effluent = 18 ppm RO Permeate = 3.6 ppm Blend with Raw Surface Water = 1.8 ppm

 Reduced Trihalomethanes in Wastewater Effluent by using Chloramines.")
11 Wastewater Effluent Quality? Trihalomethanes estimated 40% removal through Reverse Osmosis with an addition of 15 ppm from Conventional Treatment. Effluent = 106 ppb RO Permeate = 63.6 ppb Blend with Raw Surface Water = 31.8 ppb Conventional Treatment = 46.8 ppb (MCL 80 ppb, WF Avg 15ppb) Reduced Trihalomethanes in Wastewater Effluent by using Chloramines. Effluent = 10 ppb RO Permeate = 6 ppb Blend with Raw Surface Water = 3 ppb Conventional Treatment = 18 ppb


12 Wastewater Effluent Quality? Microbes log removal credits: Virus 8 log Removal using Disinfection and Physical Processes Giardia 6 log Removal using Disinfection and Physical Processes Cryptosporidium 5.5 log Removal using Physical Processes
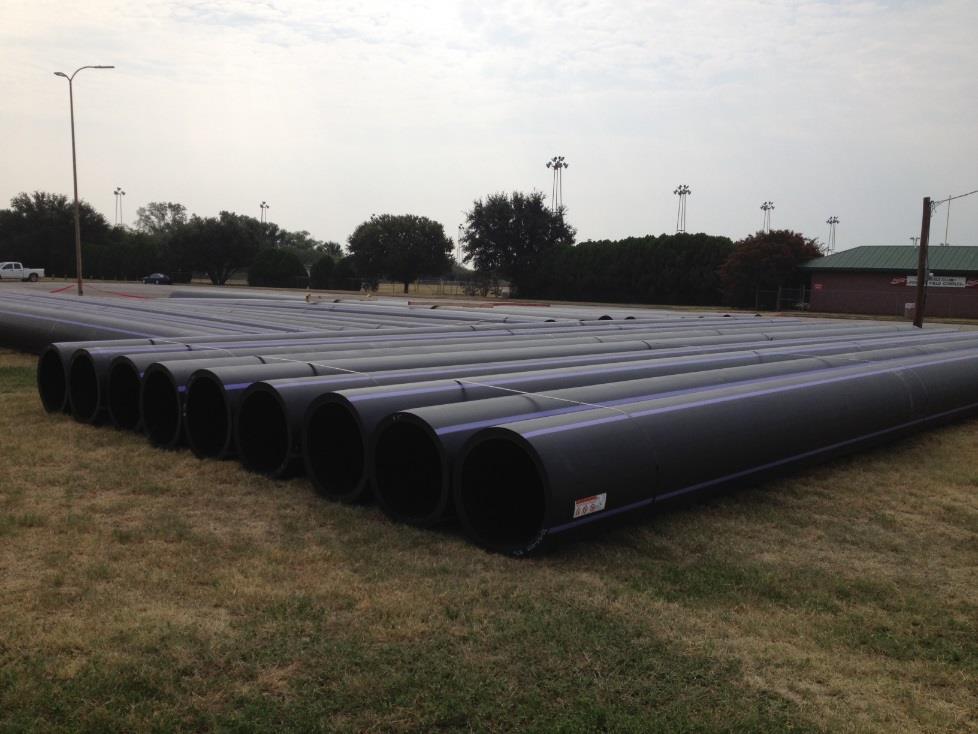
13 Direct Potable Reuse Concept Paper The City had confirmed that all required Treatment Processes were already on-site. Just had to connect them with a pipeline. The City developed a Concept Paper detailing: Processes to be Utilized Removal Efficiencies for Various Contaminants Operational Guidelines Submitted in November TCEQ Acceptance February 2013.
14
15 Direct Potable Reuse Preliminary Engineering Report The City hired Biggs & Matthews, Inc. to develop the Preliminary Engineering Report Submitted in May TCEQ Acceptance September 2013 to construct pipeline and conduct a 45-day Full Scale Verification test.
 based on Max Cysts. No more than 7.000 X 10⁻⁶ cysts / L in drinking water. Cryptosporidium.")
16 Wastewater Effluent Treatable with Existing Water Treatment Plant? Viruses TCEQ changed from 8 log to 9 log ( %) based on Pre-formed Chloramines. No more than 2.22 X 10⁻⁷ copies / L in drinking water. Giardia TCEQ changed from 6 log to 7 log ( %) based on Max Cysts. No more than X 10-6 cysts / L in drinking water. Cryptosporidium. TCEQ is requiring 5.5 log ( %) removal. No more than 2.99 X 10⁻⁵ oocysts / L in drinking water
17


18
19 Direct Potable Reuse Full Scale Verification The FSV Protocol has sampling locations at 40 different location throughout the DPR Plant.
20
21 Direct Potable Reuse Full Scale Verification and Operations City started the TCEQ Mandated 45-day Verification Test on January 27, Second Verification was conducted in May/June Full Scale Operation started July 8, (27 months after initial TCEQ meeting)
22 Direct Potable Reuse Estimated Values vs. Actual Values WW Effluent WW Effluent RO Permeate RO Permeate 50/50 Blend 50/50 Blend End Plant End Plant Estimated Actual Estimated Actual Estimate Actual Estimate Actual Nitrate Trihalomethane WW Effluent End Pipeline MF Permeate RO Permeate Secondary Reservoir 50/50 Blend End Plant E. coli >200.5 <1.0 <1.0 < <1.0 <1.0 Giardia <0.07 <0.07 <0.07 <0.05 <0.07 Cryptosporidium < <0.07 <0.07 <0.07 <0.05 <0.07 Total Culturable Virus
23 Virus Giardia Cryptosporidium Calculating Log Removal Add in the Disinfection Process Receiving TCEQ Approved Log Removal Credits Pipeline between RRWWTP and CWTP (DZ 1) MF/RO Coagulation/Flocculation/Clarification MF/RO Clarifier Disinfection (DZ 2) MF Filtration MF Disinfection (DZ 3) RO Filtration SWTP Coagulation/Flocculation/Clarification SWTP Filtration Individual Filter Effluent Credit Combined Filter Effluent Credit SWTP Disinfection (DZ 4) Clearwell/Ground Storage Tank Disinfection (DZ 5) Total Log Removal Required
24 The End Results Making a Difference Restrictions reduced July/August demand from Average of 35 MGD to 12 MGD. (65%) Reuse further reduced July/August lake demand from 12 MGD to 7 MGD. (80%) Current Average Potable GPCD for Wichita Falls is 52 gal / capita / day. Estimated that Restrictions and Reuse have extended lake supply to between July 2016 and July 2017.

25 Thank You Questions?????? Daniel K. Nix