Climate Policy under the Obama Administration
|
|
|
- Jason Hoover
- 5 years ago
- Views:
Transcription


1 Climate Policy under the Obama Administration 1
2 The Climate Change Problem
3 A NOAA (National Oceanic and Atmospheric Administration) study found permanent Dust Bowls in Southwest and around the globe on our current emissions trajectory (and irreversibly so for 1000 years). Future droughts will be fundamentally different from all previous droughts that humanity has experienced because they will be very hot weather droughts.
4 Probabilistic Forecast for 21st Century Climate Based on Uncertainties in Emissions (without Policy) and Climate Parameters, (MIT, Feb. 2009) There is now a nine percent chance (about one in 11 odds) that the global average surface temperature will increase by more than 7 C (12.6 F) by the end of this century, compared with only a less than one percent chance (one in 100 odds) that warming would be limited to below 3 C (5.4 F).
5 Kinematic Constraints on Glacier Contributions to 21st Century Sea Level Rise (Nature and Science, Sept 2008) Sea level rise:.8 to 2 meters. The first meter of SLR create more than 100 million environmental refugees and inundate over 13,000 square miles in the USA. Southern Louisiana and South Florida would inevitably be abandoned, especially in the face of a steadily increasing number of killer superhurricanes.
6 Where are we going now...

7 Real Leadership The danger posed by climate change cannot be denied. Our responsibility to meet it must not be deferred.

8 But what does this mean? In his first 8 months in office, President Barack Obama has: Appointed the first scientist to lead to DOE in nearly a decade (Nobel prize winner, Dr. Steven Chu). Passed ARRA which funds more than 80 billion USD in clean energy investment. Increased the average fuel efficiency standard to 35.5 mpg by 2016 Is leading the fight for passage of the American Clean Energy Act which will mandate 84% reduction in GHG by 2050

9 Looking Ahead New National Priorities Invest $150B in alternative energy over 10 years Create green jobs with clean, efficient American energy Double production of alternative energy in three years enough to power 6 million homes Upgrade the efficiency of more than 75% of federal buildings and two million private homes Put one million PHEVs on U.S. roads by 2015 Reduce CO 2 emissions by 80% below 1990 levels by 2050 Transform our economy with science, technology and efficiency 9
10 WHAT IS HAPPENNING AT THE STATE AND LOCAL LEVEL?

11 Source: DSIRE database, April 2009 State Policy Framework

12 City of Olympia, Washington Reduced GHG emissions 30% since 2005 Public works officials then asked the City Council to set new GHG targets: 50% reduction from 2005 levels by 2020 and 80% by 2050 If we do it right, we ll be saving money and reducing our carbon footprint, Jack Zeiger of Olympia Climate Action


13 City of Bellingham, Washington Climate Reduction Goals: Reduce City government GHG emissions 64% by 2012 and 70% by 2020, from 2000 levels. Reduce Community GHG emissions 7% by 2012 and 28% by 2020, from 2000 levels.

14 King County, WA Goal to reduce annual GHG emissions 80% below 2007 levels by 2050 Reduced GHG from county operations 6% in 2007 from energy efficiency measures. Exceeded the 1.5% reduction target for 2007 set as part of the County s membership in the Chicago Climate Exchange

15 Boulder, Colorado Enacted the first carbon tax in the USA And just doubled that tax rate this year.

16 Combine energy efficiency and renewable energy Sacramento California Shut down 1,000 MW power plant, invested instead in efficiency, wind, solar, cogeneration. This Increased regional income by $130 million. Had the plant kept running, rates would have increased 80%. Instead, they have kept rates same for decade, retained over 2,000 jobs, created 880 new jobs and the program eliminated the utility s debt

17 California s example
18 California Climate Plan Results Implementing AB 32 fully will increase the Gross State Product (GSP) by about $76 billion Increase real household incomes by up to $48 billion and create as many as 403,000 new efficiency and climate action driven jobs.

19 The Mayors Climate Protection Agreement 960 Mayors

20 A typical U.S. community spends more than 20 percent of its gross income on energy and 80 percent of those dollars immediately leave the local area.
21 SCIENCE AND ECONOMICS
22 Science

23 NREL is a national laboratory of the U.S. Department of Energy Office of Energy Efficiency and Renewable Energy operated by the Alliance for Sustainable Energy, LLC


24 U.S. Energy System Supply & Conversion Transmission & Distribution Utilization Oil 40% Coal 23% Natural Gas 23% 27% 100 Quads Nuclear 8% 61% 40% Hydro Wind Solar Biomass Geothermal 6% 39% 33% Lost energy as inefficiencies 62%


25 Achieving the Potential Requires A Balanced Portfolio
26 Resource Potential 26


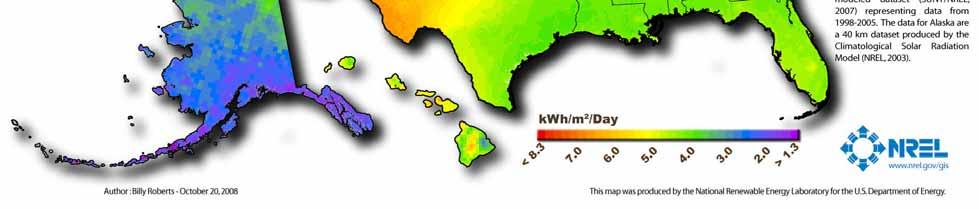
27 U.S. Photovoltaic Solar Resource


28 U.S. Concentrating Solar Resource


29 U.S. Wind Resource (50m)


30 U.S. Biomass Resource
 Wind Geothermal Water Power")
 11,100GW (CSP) 8,000 GW (onshore)")
 520 GW (EGS) 4 GW")
31 U.S. Renewable Resources Resource Solar PV/CSP) Wind Geothermal Water Power Biopower Theoretical Potential 206,000 GW (PV) 11,100GW (CSP) 8,000 GW (onshore) 2,200 GW (offshore to 50 nm) 39 GW (conventional) 520 GW (EGS) 4 GW (co-produced) 140 GW 78 GW

32 Energy Efficiency


33 Buildings Status U.S. Buildings: 39% of primary energy 71% of electricity 38% of carbon emissions DOE Goal: Cost effective, marketable zero energy buildings by 2025 Value of energy savings exceeds cost of energy features on a cash flow basis NREL Research Thrusts Whole building systems integration of efficiency and renewable features Computerized building energy optimization tools Building integrated PV April 10, 2008
34 Energy Used in Buildings Buildings use 72% of nation s electricity and 55% of its natural gas Quads of Total Use, 2005 Buildings use 72% of the nation s electricity and 55% of its natural gas. Source: Buildings Energy Data Book 2007


35 Technology for Cost Effective Zero Energy Buildings Compressorless Cooling NREL Zero Energy Habitat House BIPV Products & PV-T Array Electrochromic Windows Polymer Solar Water Heaters Computerized optimization & simulation Tools
36 Net Zero Energy Homes That Are Cash flow Neutral NREL Analysis using BEOpt software for Boulder,CO climate Homeowner cost for low energy home* is the same as minimum code home Average 1990 s home * low energy home requires 65% less energy Example taken from the GEOS Neighborhood. Courtesy of Wonderland Hills Development, Boulder Colorado


37

38 Renewable Electricity Supply 38
39 Wind Today s Status in U.S. 25,300 MW installed capacity Cost 6 9 /kwh at good wind sites* DOE Cost Goals 3.6 /kwh, onshore at low wind sites by /kwh, offshore in shallow water by 2014 Long Term Potential 20% of the nation s electricity supply * With no Production Tax Credit Updated May 8, 2009 Source: U.S. Department of Energy, American Wind Energy Association
 to explore a modeled energy scenario in which wind provides 20% of U.S. electricity by 2030 Primary Assumptions: U.S. electricity consumption grows 39% from 2005 to 2030 to 5.")
40 The 20% Wind Report Informs Our RD&D The 20% Wind Energy by 2030 Scenario How it began: 2006 State of the Union and Advanced Energy Initiative Collaborative effort of government and industry (DOE, NREL, and AWEA) to explore a modeled energy scenario in which wind provides 20% of U.S. electricity by 2030 Primary Assumptions: U.S. electricity consumption grows 39% from 2005 to 2030 to 5.8 billion MWh (Source: EIA) Wind turbine energy production (capacity factor) increases about 15% by 2030 Wind turbine costs decrease about 10% by 2030 No major breakthroughs in wind technology Primary Findings: 20% wind electricity would require about 300 GW (300,000 MW) of wind generation Affordable, accessible wind resources available across the nation Cost to integrate wind modest Emissions reductions and water savings Transmission a challenge National Renewable Energy Laboratory Innovation for Our Energy Future


41 Wind Energy Technology US Wind Resource Exceeds Total Electrical Demand Offshore Wind Advanced Blades Innovative Tall Towers Giant Multi-megawatt Turbines Courtesy:WindLogics, Inc. St. Paul, MN Wind Forecasting


42 NREL Research Thrusts Improved performance and reliability Advanced rotor development Utility grid integration Wind Photo credit: Megavind


")


43 Applications of Solar Heat and Electricity Passive solar Hot water Solar Thermal Distributed Generation, on-site or near point of use Photovoltaics (PV) Concentrating Solar Power (CSP) Centralized Generation, large users or utilities Transportation Residential & Commercial Buildings Industrial
44 Solar Photovoltaics and CSP Status in U.S. PV 1,000 MW installed capacity Cost /kwh CSP 419 MW installed capacity Cost 12 /kwh Potential: PV /kwh by /kwh by 2015 CSP 8.5 /kwh by /kwh by 2015 Source: U.S. Department of Energy, IEA Updated January 1, 2009
45 Solar Research Thrusts Photovoltaics Higher performance cells/modules New nanomaterials applications Advanced manufacturing techniques Concentrating Solar Power Low cost high performance storage for baseload markets Advanced absorbers, reflectors, and heat transfer fluids Next generation solar concentrators 8.22-megawatt Alamosa, Colo.,

46 PV Conversion Technologies Decades of NREL Leadership National Renewable Energy Laboratory Innovation for Our Energy Future


47 PV Conversion Technology Portfolio Market-Competitive Targets


48 Current Research Moves from Nanoparticles to Nanotubes to Improve Electron Transport Credits: Art Frank

49 Geothermal Today s Status in U.S. 2,800 MWe installed, 500 MWe new contracts, 3000 MWe under development Cost 5-8 /kwh with no PTC Capacity factor typically > 90%, base load power DOE Cost Goals: <5 /kwh, for typical hydrothermal sites 5 /kwh, for enhanced geothermal systems with mature technology Long Term Potential: Recent MIT Analysis shows potential for 100,000 MW installed Enhanced Geothermal Power systems by 2050, cost-competitive with coalpowered generation June 18, 2009 NREL Research Thrusts: Analysis to define pathways to commercialization of enhanced geothermal systems (EGS) Systems engineering/integration to enable fast track development of EGS and other Program goals Geothermal energy conversion RD&D Low temperature geothermal, direct use, and ground source heat pump RD&D

50 354 MW Solar Electric Generating Systems (SEGS)
51 SEGS Historic Plant Capacity Value On-Peak Performance For 5 Parabolic Trough Plants On-Peak Capacity (%) 120% 100% 80% 60% 40% Insolation (kwh/m^2/day) Over 100% capacity with fossil backup Averaged 80% on peak capacity factor from solar 20% 2 0% Solar Contribution Boiler Contribution Direct Normal Radiation 0 SCE Summer On-Peak Weekdays: Jun - Sep 12 noon - 6 pm Source: KJC Operating Company

52
53 Exclude: Used and sensitive land - Solar < 6.75 kwh/m 2 per day - Ground slope > 1%

54 What s Left Over 6X U.S. electric capacity!
55 Biofuels 55
 Projected commercial cost ~$3.50/gge Key DOE Goals 2012 goal: cellulosic ethanol $1.33/ETOH gallon or ~$1.")

56 Biofuels Current Biofuels Status in U.S. Biodiesel 171 companies; 2.2 billion gallons/yr capacity1 Corn ethanol 174 commercial plants billion gal/yr. capacity2 Additional 2.4 billion gal/yr planned or under construction Cellulosic ethanol (current technology) Projected commercial cost ~$3.50/gge Key DOE Goals 2012 goal: cellulosic ethanol $1.33/ETOH gallon or ~$1.99/gge 2022 goal: 36B gal Renewable Fuel; 21B gal Advanced Renewable Fuel 2007 Energy Independence and Security Act 2030 goal: 60 billion gal ethanol (30% of 2004 gasoline) NREL Research Thrusts The biorefinery and cellulosic ethanol Solutions to under utilized waste residues Energy crops New biofuels Updated February 2009 Sources: 1- National Biodiesel Board 2 - Renewable Fuels Association, all other information based on DOE and USDA sources

57 Generation 2 (Cellulosic Ethanol) 2nd generation from lignocellulosic biomass materials, primarily producing ethanol via biochemical or thermochemical conversion Biochemical Conversion Residues Biochemical Intermediates Biomass Combined Heat & Power Byproducts Ethanol & coproducts Thermochemical Conversion Chemical Intermediates


58 Why Follow On Generations? 3 rd & 4 th Generations beyond ethanol Higher energy density/suitability Better temp and cold start ability Energy and tailored feedstocks Infrastructure compatibility Algae
59 National Renewable Energy Laboratory Innovation for Our Energy Future Wide Range of Biofuel Technologies Feedstocks Lignocellulosic Biomass Perennial - Herbaceous - Woody Ag residues, (stover, straws, bagasse) Annual Crops Sugar/Starch (corn, sugarcane, wheat, sugarbeet, etc.) Other Residues - Forestry, forest products - Municipal and urban: green waste, food, paper, etc. - Animal residues, etc. - Waste fats and oils Plant Oils/Algae Gasification Pyrolysis & Liquefaction Pretreatment & Hydrolysis Hydrolysis Anaerobic Digestion Extraction Intermediates Bio SynGas Bio-Oils Lignin Sugars Biogas Lipids/ Oils Fermentation Catalytic synthesis FT synthesis MeOH synthesis HydroCracking/Treating Catalytic upgrading Aqueous Phase Processing Catalytic pyrolysis Aqueous Phase Reforming Fermentation Upgrading Transesterification Hydrodeoxygenation Transportation Fuels Ethanol & Mixed Alcohols or Methane or Hydrogen Diesel* Methanol MTG Gasoline* Diesel* Gasoline* & Diesel* Diesel* Gasoline* Hydrogen Ethanol, Butanol, Hydrocarbons Bio-Methane Biodiesel Green diesel * Blending Products 59

60 Sustainable Transportation


61 Plug In Hybrid Electric Vehicles (PHEV) Status: PHEV-only conversion vehicles available OEMS building prototypes NREL PHEV Test Bed NREL Research Thrusts Energy storage Advanced power electronics Vehicle ancillary loads reduction Vehicle thermal management Utility interconnection Vehicle-to-grid Key Challenges Energy storage life and cost Utility impacts Vehicle cost Recharging locations Tailpipe emissions/cold starts Cabin heating/cooling ~33% put cars in garage


62 Advanced Vehicle Technologies Energy Storage Advanced Power Electronics Vehicle Ancillary Loads Reduction Batteries UltraCaps GM Volt Before After 62


63 Fuels Performance Coordinating Research Council FACE Biodiesel Stability E10/E20/E85 Fuels Chemistry Lab Test Methods Impurities Chemical analysis Fuel Surveys Biodiesel E85 ASTM Specs & Test Method Development Biodiesel E85 NBB CRADA - Biodiesel Quality/Stability Compatibility with Emission Controls Real-World Evaluation IQT Projects Fundamental Ignition Studies Pollutant formation FACE Fuels Testing 63

64 Hydrogen and Fuel Cells 64


65 Hydrogen and Fuel Cells U.S. Status 400+ fuel cell vehicles on the road 58 hydrogen fueling stations Goals Hydrogen Production $2 3/Kg for all pathways Renewables in $5 10/Kg range Fuel Cells $30/kW by ,000 hour stack life NREL Research Thrusts Renewable H2 production Safety/codes/standards Early market introduction

66 Energy Storage 66


67 Designer Nanostructured Materials are Critical to Enabling Energy Storage Systems for Renewables State-of-the-art processing to create novel nanomaterials for energy storage: Hydrogen storage: porous carbons, boro-carbons, metcars, macromolecules Batteries: novel electrolytes and metal oxides for cathodes and anodes Ultracapacitors: nanotubes and high dielectric materials Dynamic smart windows NREL leads DOEs hydrogen sorption Center of Excellence Develops high surface area, low-weight and low-cst materials Organometallic Buckyballs for Hydrogen Storage 15 projects: 4 national labs, 10 universities, and on industrial parnter
68 New Directions 68


69 Evaluating Potential New Directions Enhanced Geothermal Systems Ocean Kinetic Energy Wave Tidal Pelamis Ocean Power Delivery Verdant Power RITE Turbine
 Heat exchange volume (recoverable energy) and surface area (recovery rate) Minimal loss of injected fluid Few")
70 Enhanced Geothermal Systems Challenges Technical Site selection exploration techniques for EGS EGS paradigm shift from hydrothermal Creating EGS in variety of geologic environments Create a subsurface fracture system to enable extraction of heat Sufficient flow rates (80 kg/sec) Heat exchange volume (recoverable energy) and surface area (recovery rate) Minimal loss of injected fluid Few EGS field experiments yet conducted worldwide Experimental evidence of EGS well productivity, heat exchange volume, and longevity is lacking Geologic variability and uncertainty create technical challenges


71 FY09 NREL Water Program Market Development and Transformation International Collaborations and Standards Technical Support Industry Technology Support Industry Status New industry extracting power from natural Ocean and River Currents, Tidal, Wave, and Thermal energy Water Power Mission Assess the potential of extractable energy from water resources and facilitate the development and deployment of renewable, environmentally friendly, and costeffective energy systems from domestic rivers, estuaries and coastal waters Include R&D for economic and environmental improvements to existing hydroelectric facilities and dams
72 Smart Grid Renewable Energy Integration in Systems at All Scales


73 Energy Solutions Require a New Approach Multi disciplinary/multi institutional collaboration Chemistry, materials science Computational modeling Biology Translational science bridge basic to applied Revolutionary opportunities at the nano scale


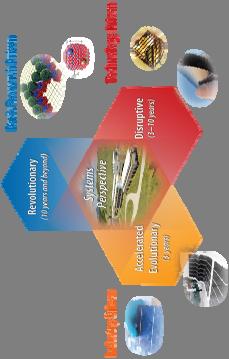

74 Breakthough/Translational Science Bioscience Centers Energy Frontiers Energy Innovation Hubs ARPA E
75 Economics (the 800 pound Gorilla) 75

76 China has replaced the U.S. as the world's leading consumer of basic commodities: oil, grain, coal, steel. And producer of carbon If China s s economy grows at its prior rate and uses resources as inefficiently as the U.S. By 2030 China will need 99 million barrels of oil/ day. The world now produces 85 million bbl/ day.
77 Where are oil prices headed?


78 Achieving a Sustainable Energy Economy Requires a National Energy Grand Challenge* Lead Coordinated RD3E Strategy in Sustainable Energy Boost R&D Investment Construct Essential Policies & Market Conditions Soon to be released. Support Education & Workforce Development Lead Globally Promote Public Awareness & Action * Recommendations of the National Science Board Task Force on Sustainable Energy

79 Potential U.S. Carbon Reductions What does it cost? -$108B/yr $0B/yr $9B/yr $3B/yr $5B/yr $7B/yr $2B/yr Total: Savings of $82B/yr 57% Energy Efficiency, 43% Renewables
80 The Integrated Bottom Line The Business Case for Sustainability Enhancing Shareholder Value: Financial performance Reduced cost, enhanced profitability Ability to drive innovation Reduction of risk Franchise to operate, legal liabilities Attraction and retention of best talent Labor productivity - increased worker health Market share - enhanced brand equity Product differentiation Supply chain and stakeholder management Reducing cost of distrust First to the future = the billionaires of the future
81 Companies in the Dow Jones sustainability Index outperform the general market New report from Goldman Sachs July 5 6: Companies considered leaders in environmental, social and governance (ESG) policies are leading the pack in stock performance by an average of 25%. 72% of the companies on the list outperformed industry peers.
82 Companies with the highest share price growth over the past three years paid more attention to sustainability issues those with the worst performance tended to do less. The link appears clear: companies that rated their efforts most highly over this time period saw annual profit increases of 16% and share price growth of 45%, Those that ranked themselves worst reported growth of 7% and 12% respectively. High performing companies put a much greater emphasis on social and environmental considerations at board level, while the poorly-performing firms are far more likely to have nobody in charge of sustainability issues.
83 GOALS: Cut greenhouse gas emissions 65% Raise revenues 6%/y with no increase in energy use By 2010, 10% of energy & 25% of feedstock from renewables Since 1990 have kept energy use the same and increased production 30% GHGs from global operations are down 80% Global energy use 9% below 1990 levels Savings of $3 billion On track with renewables


84 Commitment Waste reduction Held energy use flat Annual Savings $1.8 Billion $0.4 Billion Eco Efficiency = $2.2 Billion saved each year Average Net Income ( ) = $2.2 Billion

85 ROI on Climate Protection
86 Energy Efficiency Businesses such as energy efficiency rose by 75 percent in 2008 to $530 billion and could exceed $2 trillion by 2020, HSBC Global Research estimated last Friday. In the 2006 Stern Review on the economics of climate change, climate related revenues were forecast to climb to $500 billion by 2050.
87 Increase vehicle fleet efficiency 25% in 3 yrs Double it in 10 yrs. Invest $50 million in sustainability projects Become the world s leading organic retailer 100% renewable energy Zero waste Carbon neutral Sell only sustainable products

88
89 The Walmart Sustainability Index is organized around the following impact areas and goals Energy and Climate Material Efficiency Natural Resources People and Community Across the lifecycle of its products, Walmart seeks To maximize the use of renewable energy and minimize greenhouse gas emissions. To maximize efficient use of all materials, close material loops and minimize waste. To promote the integrity of nature and a safe, reliable supply of natural resources. To promote quality of life and safeguard human health. Sample topics included Energy use / efficiency GHG emissions Renewable energy Use / efficiency of all resources other than energy (water, minerals, chemicals, etc.) Waste, re-use and recycling Pollution (except GHG emissions) and hazardous waste Biodiversity Natural abundance (supply of fish, wood, etc.) Toxicity to humans Nutrition Livelihoods Community development
90 October meeting in Beijing 1,000 suppliers, government, NGOs Set aggressive goals and expectations to build more environmentally and socially responsible global supply chain phased in for suppliers in China in Jan. 2009, expanded to suppliers around the world by Top 200 factories to achieve a 20 percent improvement in energy efficiency by Source 95 percent of production from factories with the highest ratings in audits for environmental and social practices by Wal Mart China will design and open a new store prototype that uses 40 percent less energy and will reduce energy use by 30 percent in existing stores by


91 America Is Making Transformational Change Renewable energy and sustainable business practices are the greatest opportunities of this century.