When the big one hits will your pipes and valves stand the test?
|
|
|
- Amberly Ryan
- 5 years ago
- Views:
Transcription

1 When the big one hits will your pipes and valves stand the test? Evaluating pipe and valve redundancy in Sammamish Plateau Water's System PNWS-AWWA Spring Conference Presented by: Jay Regenstreif, PE - SPW David Stangel, PE - Murraysmith 1
2 2 Agenda SPW Who? Supply Evaluation Conclusions Pipe & Valve Evaluation Conclusions 2


3 3 Bellevue Seattle 29 square miles Population: 63,000 Water connections: 18,700 Sewer connections: 12,300 Replacement value: $1 Billion 3
 and unincorporated King County Median")

4 Sammamish Plateau Water Mid-size water and sewer utility Located 20 miles east of Seattle, WA 2018 budget: $74,000,000 About the community we serve Population: 63, square miles, covering 2 cities (Sammamish and Issaquah) and unincorporated King County Median household income: $144,775 % of population with Bachelor degree or higher: 72.5 Our Mission Sammamish Plateau Water will provide safe, efficient, and reliable water and sewer services by being a leader in the planning and the practice of fiscal and environmental stewardship. 4 4
5 Purpose of the 2017 Seismic Pipeline Study Purpose of the 2017 Seismic Pipeline Study Follow up to the Seismic Vulnerability Report, 2014 Reassess the need for a New Supply Pipe to the 650 Zone Determine Potential Level of Service after an earthquake Develop alternatives for a new seismically resilient supply pipe to the 650 zone Evaluate the resiliency of SPW s distribution system to a pipe breaking seismic event 5

6 Effects of an Earthquake - Assumptions Seismic Liquefaction Zone Well 9 would function Many facilities would be inoperable Many broken pipes Plateau Area 650 Zone Some pipes break however most would be in service Wells would be in service Avoid this area Plateau area supply could feed the 297 zone through pressure reducing valves 6
7 Level of Service - Demand What demand should be supplied during an emergency? All agreed it is reasonable to reduce the Level of Service following an earthquake. MGD gpm Average Winter Demand (Nov-Feb) 3.3 2, Average Day Demand 4.7 3,262 More conservative, use this 7
8 Level of Service Level of Service Demand 2016 Average Day Demand = 4.7 MGD (3,262 gpm) This is more conservative than the average winter day demand Demand will increase in the future and eventually this won t be enough Supply Plateau, without 297 Zone supply = 6.7 MGD (4,675 gpm ) 6.7 MGD supply > 4.7 MGD demand Plateau sources exceed emergency demand and can supply the overall system 8

9 Issaquah Fall City Road Pipe and Booster Station New Booster 9
10 Supply Evaluation Summary Using relatively conservative demand assumptions, supply is adequate to serve system under emergency conditions A new 297 supply pipeline can provide additional redundancy to the 650 Zone; however, it can be delayed 10

11 Pipe and Valve Evaluation 11
12 Distribution System Resiliency Analysis What is required to conduct the analysis Performance Criteria How does the system perform with the loss of components? Pipe Breaks to assess: Violation of system pressure thresholds - Innovyze Demand isolated by pipe breaks - Optimatics Number of valves to isolate a pipe - Optimatics Number of valves to isolate a valve - Innovyze Supply redundancy (Single Pipeline to/from Facilities) Optimatics & Innovyze 12
13 Data and resource requirements Calibrated hydraulic model Mainline valve locations (from GIS) Performance criteria 13
14 Performance Criteria Scenario utilized (Max Day Demand) Pressure criteria Customer Meter Locations (>20 psi) Transmission lines and facilities (>0 psi) Critical Pipe connections (Removal from service isolates customers): Approx. 0.5 gpm (MDD)/EDU (EDU = 1 Residential customer) 0-10 gpm (MDD) (0-20 ERU) gpm (MDD) ( ERU) 50 gpm or more (MDD) (100 or more ERU) Number of Valves required to isolate pipe = 4 or fewer Number of Valves required to isolate a valve = 5 or fewer 14
 and the location of the low pressure Software identifies which pipe breaks cause the isolation of")
15 Pipe Break Pressure and Demand Isolation Analysis Process: Batch modeling simulations are run where each pipe is broken in the distribution system one by one Software identifies which pipe breaks result in pressures below set criteria (<20 psi) and the location of the low pressure Software identifies which pipe breaks cause the isolation of demand 15

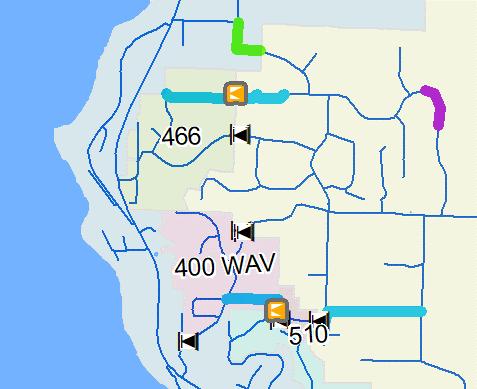
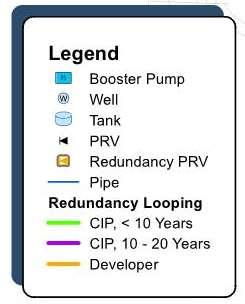
16 Pipe Breaks Demand Isolation/Number of Customers Out of Service Some areas may be addressed by changing operations Single PRV stations can create a dead-end Demand Isolated: Orange = gpm Red = 50 gpm and greater 16


17 Example Demand Isolation Results 17

18 18 Redundancy Improvements 18

19 Redundancy Improvements 19

20 20 Model Components: Pipes, Nodes, and Valves 20
21 Valve Spatial and Attribute Quality Control Valve attributes: Active status = active Typically open normally open <> N On main line main line valve = on Box 1 Spatial location of valves On mainline Near mainline (associated with nearest main) Box 2 Red = Excluded Green = Included 21
22 Valve Spatial and Attribute Quality Box 1 22
23 SPW s Valve Attribute Summary Out of 8,726 valves: 4,874 valves met attribute criteria (Active, Mainline, not closed) and were used 3,935 of those were spatially located on pipelines (Approx. 81%) 939 required review by SPW staff 380 valves in total, had a null Mainline valve status and were not used Required review by SPW staff 23
24 Valves required to isolate pipe breaks SPW generally has good valve coverage A number of locations were identified to have additional valves installed Valves Required Occurrences

25 Number of valves to isolate broken valves Valve to isolate 25

26 26 Valve Criticality ValveID To Close V V V V V V V V V V V V V V V V V V V V V V V V V V V V V V V V V V V V V V V V V V V V V V V V V V V V V V V V V V
 pipeline connecting will be pipeline critical. will be critical.")
27 Critical Facilities Supply Redundancy Pump Station If a facility is critical to provide pressure If a facility or is supply critical demand to provide due pressure to network supply connectivity, demand, the the (single) pipeline connecting will be pipeline critical. will be critical. Well Model controls set up to automatically turn on any alternate facilities that are available. 27
28 Conclusions Assess Level of Service goals before focusing on specific projects SPW has flexibility to serve non irrigation demands with the loss of 297 zone supplies indefinitely Historically most resiliency studies have focused on facilities and transmission piping Now modeling tools allow for assessment of distribution system For systems with varied topography and/or multiple pressure zones, pipe and valve criticality is often tough to visually discern SPW generally has a high level of piping and valve redundancy SPW identified approximately 20 pipe and PRV projects that would improve the redundancy of the system 28
29 Conclusions (cont.) A secondary benefit to the analysis is improving the quality of water GIS SPW identified mis-coded and mis-located valves Identified several locations where additional valves will be installed Software tools are generally available to complete this analysis Requires calibrated steady state model and accurate system valve information Tools from Optimatics and Innovyze were utilized in this project Unfortunately no single piece of software provides all required functionality 29
30 Acknowledgements Ron Bard - Brown and Caldwell Kyle Wong, PE - SPW Dawn Wirz Murraysmith Michele Cusick - Murraysmith Optimatics Innovyze 30
31 Q&A 31

32 Thank you! 32