Multicentury Climate Warming Impacts on Ocean Biogeochemistry
|
|
|
- Leon Williams
- 5 years ago
- Views:
Transcription

1 Multicentury Climate Warming Impacts on Ocean Biogeochemistry Prof. J. Keith Moore University of California, Irvine Collaborators: Weiwei Fu, Francois Primeau, Greg Britten, Keith Lindsay, Matthew Long, Scott Doney, Natalie Mahowald, Forrest Hoffman, Jim Randerson Support from DOE RGCM & ESM, and NCAR

2 Climate Impacts to 2100 Surface ocean warms increasing stratification, and decreasing nutrient flux to surface waters. NPP declines under RCP4.5 & RCP8.5 scenarios. Larger decreases in RCP 8.5, but similar spatial pattern. NPP down 6% globally, decreasing > 50% in NA. (Moore et al., 2013)
3 CESM Climate Simulation to Year 2300 Prescribed atmospheric CO 2 trajectory. the historical record to 2005, then RCP 8.5 to 2100, then ECP 8.5 to 2300 Atmospheric CO 2 reaches 1960 ppm Mean surface air temperature warms 9.6 o C Arctic air temperatures rise by >25 o C Ocean CO 2 uptake peaks ~2100, 4.5 PgC/yr, then declines as surface waters saturate, in spite of the ongoing CO 2 rise. Fully Coupled Simulation No CO 2 Warming, Other GHGs Active No GHG Warming, but CO 2 Affects Biota (Randerson et al., 2015)
4 CESM1 Climate Simulation to Year 2300 North Atlantic Deep Water (NADW) formation is greatly reduced (30 to 5 Sv), as deep winter mixing collapses. Stratification increases steadily to % of ocean warming occurs after 2100! Most of the warming at 2100 is still near the surface, it takes centuries for the heat to move downwards modifying circulation. (Randerson et al., 2015)
")

5 1990s 2090s s 2290s s Sea Surface Temperature( o C) Increases of 1-5 o C by 2100 Increases of 4-11 o C by 2300 (Moore et al., 2018)

6 CESM1 Climate Simulation to Year 2300 At depth, the oceans are still warming and stratification between middepths and the deep ocean is still increasing at (Moore et al., 2018)

7 Global warming removes nearly all sea ice from polar regions by Sea Ice Cover Decline 2300 Southern Hemisphere - 97% Northern Hemisphere - 99% Annual Mean Sea Ice Cover (Moore et al., 2018)

8 The midlatitude westerly winds intensify and shift southwards with strong climate warming. Common pattern across the CMIP5 models under RCP 8.5. The Antarctic Divergence upwelling zone also intensifies and shifts south, leading to coastal upwelling around Antarctica. (Moore et al., 2018)
 up 25% by 2150.")
9 Upwelling Velocity (m/day) As the Westerlies intensify and shift poleward, upwelling at the Antarctic Divergence shifts south and intensifies. Eventually coastal upwelling is initiated along Antartctica. Mean upwelling velocity (below 60 o S) up 25% by Southern Ocean NPP and POC export increase due to: 1) sea ice removal reduces light limitation 2) warming oceans increase phytoplankton growth rates 3) shifting winds increase upwelling rate and location (Moore et al., 2018)
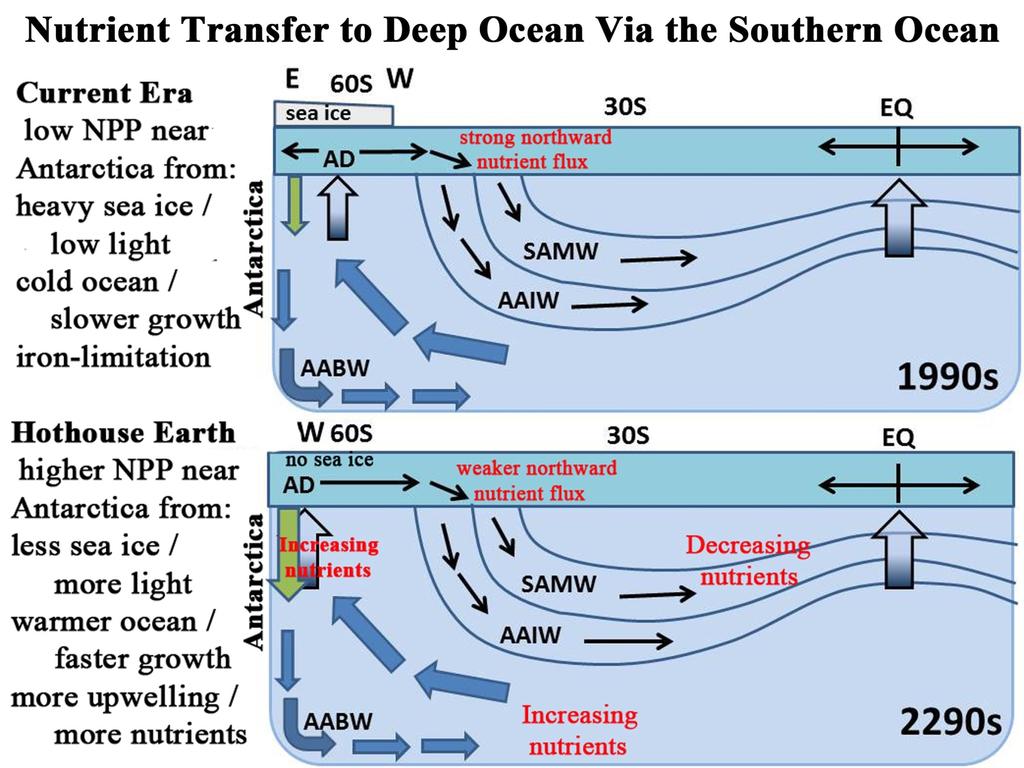
10 Sinking particulate organic carbon (POC) flux increases in the Southern Ocean and equatorial Pacific, and declines everywhere else. Above 30 o S, the POC flux declines 41% by 2300, NPP declines by 24%. Increasing Southern Ocean NPP and POC flux drives "nutrient trapping" with increasing subsurface ( m) phosphate concentrations. The trapped nutrients help drive increasing SO productivity, which further strengthens the nutrient trapping, in a positive feedback. Trapping nutrients in the Southern Ocean reduces the northward nutrient transport that fuels low latitude biological productivity.
11

12 Southern Ocean nutrient trapping decreases northwards nutrient flux, within AAIW and SAMW, into the low-latitude thermocline. Some trapped nutrients are moved back into the deep ocean by circulation and vertical mixing, driving a net transfer to the deep ocean. Phosphate concentrations decline in the upper ocean (down to 1500m!), initially due to increasing stratification (B), then due to upper ocean nutrient declines (C). The collapse of deep winter mixing in the high latitude North Atlantic, also acts to deplete upper ocean nutrients and increase deep ocean nutrient concentrations (above 60 o N). Nutrient concentrations in the Southern Ocean (all depths) and global deep ocean are still increasing linearly at Transfer to the deep ocean is ongoing at (Moore et al., 2018)


13 Similar Transfer of Nitrate and Silicic Acid to the Deep Ocean

14 The Southern Ocean increasingly dominates CO 2 uptake with climate warming. CO 2 uptake begins saturating elsewhere as anthropogenic CO 2 accumulates. Oceanic uptake of heat and anthropogenic CO 2 will eventually cool the climate. Southern Ocean dynamics will drive the climate cooling timescale. (Moore et al., 2018)
15 Summary and Conclusions 1) ESM simulations need to extend well beyond 2100 to fully account for the impacts of global warming. 2) If warming removes the Southern Ocean sea ice, nutrient trapping and net transfer to the deep ocean seem likely, marking a new, critical tipping point in the Earth System. 3) Nutrient transfer to the deep ocean will continue until the climate cools and sea ice returns to the Southern Ocean, depressing NPP, and increasing northward nutrient flux in surface waters. 4) The long timescales for ocean CO 2 uptake, and then for circulation to return depleted nutrients to the upper ocean, ensures that global-scale marine biological productivity will be depressed for at least a millenium.
 and Biological Export Nutrients \"trapped\" locally, increasing concentrations near Antarctica, and later throughout the deep ocean")

16 Multicentury Climate Warming westerly winds strengthen and shift southwards polar oceans warm sea ice disappears collapse of deep winter mixing and NADW formation Increasing Southern Ocean Net Primary Production (NPP) and Biological Export Nutrients "trapped" locally, increasing concentrations near Antarctica, and later throughout the deep ocean Northward nutrient flux weakens, Upper ocean nutrient concentrations decline everywhere to the north Declining productivity reduces the maximum potential fishery catch, down 20% globally, and by nearly 60% in the North Atlantic by 2300 NPP steadily declines as upper ocean nutrients are increasingly depleted, north of 30 o S export production is down 30% by 2300
17 Long-term Fate of Anthropogenic CO 2 Over ~1000 Years Most of the anthropogenic CO 2 added to the atmosphere will be absorbed by the oceans due to the solubility pump (~70-80%). The anthropogenic CO 2 will be carried throughout the deep ocean by the circulation, beginning to interact with the sediments. Over ~10,000 Years As the anthropogenic CO 2 is circulated throughout the deep ocean the decrease in ph will lead to dissolution of CaCO 3 in the sediments. This dissolution will increase the alkalinity (and raise ph) allowing the water to absorb additional CO 2 from the atmosphere when it is brought back to the surface (~10-15%). Over ~100,000+ Years The remaining anthropogenic CO 2 in the atmosphere (~10%) will be removed slowly due to rock weathering on the continents.

18 We find very similar nutrient transfer to the deep ocean in two other ESMS that followed RCP8.5-ECP8.5 to 2300

19 CESM Extended Climate Simulation to Year 2300 RCP 8.5/ECP 8.5 scenario, atmospheric CO 2 reaches 1960 ppm in 2250 Air Temperature Change 2100 Air Temperature Change 2300 Under strong warming scenarios, most of the warming occurs after By 2300 mean surface temperature has increased by 9.6 o C, nearly ten time the warming we have seen up to this point! Arctic air temperatures increase by > 25 o C.
20 Factors Boosting Southern Ocean Productivity 1) Reductions in sea ice cover, increases light reaching the ocean. 2) Warming surface waters, increases phytoplankton growth rates, and shoals mixed layer depths, improving the light regime. 3) Shifting Westerlies increases upwelling rate, and incorporates more margin-influenced, high-iron waters along Antarctica. Mean light levels experienced by phytoplankton in the Southern Ocean surface mixed layer increase by 245% at 2300 relative to the 1850s. The six degree warming of polar surface waters (below 60 o S), increases maximum phytoplankton growth rates by 52%. Mean upwelling rate increases by 25% at 2150, then levels off to 2300.

21 Upper ocean iron concentrations increase in the upper ocean around Antarctica due to nutrient trapping. However, due to the short residence time of iron in the oceans, there is no global redistribution of iron. Particle scavenging removes the iron before it can be transported long distances. Over much of the oceans, iron increases modestly throughout the water column. This is due to the weakening biological pump, which reduces sinking particle flux, and thus lowers the scavenging loss for iron.
22
23 The magnitude of the global-scale productivity declines is much larger than regional Southern Ocean increases, leading to large global declines in NPP and POC export by Note increasing Southern Ocean POC export over time (below 50S) and the decline in POC export everywhere outside the Southern Ocean (above 50S). Note changes in mean zonal POC flux after year 2100 are larger than changes before Big impact in the high latitude North Atlantic do to the greatly reduced deep winter mixing, decreases nutrient inputs to the Arctic basin as well.


24 Increasing Southern Ocean NPP and POC flux leads to "nutrient trapping" in the Southern Ocean, with increasing subsurface ( m) phosphate concentrations around Antarctica. (Moore et al., 2018)

25 Bottom Up Constraints on Fishery Catch Changes in productivity at trophic levels 3 and 4 (would include most commercial fish catch) Globally down 20% at 2300 Down more than 50% North Atlantic, western Pacific, and Indian basins. We use an empirical model to estimate potential fishery yield from the phytoplankton and zooplankton simulated by CESM. This model by Stock et al. (2016) used ESM simulated zooplankton productivity, combined with observed fisheries catch to optimize a simple model of trophic transfer efficiency.

26 Decreasing export production, sinking Particulate Organic Carbon (POC at 100m) under both future scenarios. Larger decreases under RCP 8.5, but with similar spatial patterns. Export down 13% globally, with decreases > 50% in some regions.