The EU Environment Policy
|
|
|
- Harvey Lucas
- 5 years ago
- Views:
Transcription


1 The EU Policy Andrea VETTORI Deputy Head of Unit ENV.B1 Agriculture, Forests and Soil Directorate General Alpeuregio Summer School
2 Natural resources (1) Competition for resources (including raw materials) increases, resource scarcities appear, prices go up - this will affect the European economy


3 Natural resources (2) Growth of the World Economy 2050: 9 billion 2011: 7 billion Population to reach 9 billion by 2050 By 2050, world economy projected to nearly quadruple, with growing demand for energy and natural resources Two billion middle income earners in 'developing countries' are expected to triple their consumption by 2020 If the growing global population matched OECD consumption by 2050, world consumption would be 15 times bigger than now

4 Natural resources (3) Over the 20th century, the world increased its fossil fuel use by a factor of 12, and material extraction grew by a factor of 8 Demand for food, feed and fibre may increase by 70% by % of the world s major ecosystems that help produce these resources have already been degraded or are used unsustainably The World Business Council for Sustainable Development estimates that by 2050 we will need a 4 to 10 fold increase in resource efficiency, with significant changes needed by 2020
5 The life-cycle Extraction: 16 tons The Life-cycle Growing technosphere To physical stock: 10 tons Disposal: 6 tons Source Sink Threats to ecosystem services!

6 Cost of inaction (1) OECD al Outlook to 2050 (OECD 2012): Progress on an incremental, piecemeal, business-as-usual basis in the coming decades will not be enough. Pressures on the environment from population growth and rising living standards will outpace progress in pollution abatement and resource efficiency. As a result, continued degradation and erosion of natural environmental capital are expected to 2050 and beyond, with the risk of irreversible changes that could endanger two centuries of rising living standards. Well-designed policies can reverse the trends projected in the Baseline scenario, safeguarding long-term economic growth and the well-being of future generations.
.")
7 Cost of inaction (2) Natural systems have tipping points beyond which damaging change becomes irreversible (e.g. species loss, climate change, groundwater depletion, land degradation). "The benefits of strong and early action far outweigh the economic costs of not acting" (Stern Review, 2006). Action => 1% global PDB each year until 2050; Inaction => up to 20% of global GDP/year Biodiversity: 2008 financial crisis has cost around $1.000-$1.500 billion to Wall Street, but every year we lose a natural capital of $2-$5.000 billion." (Pavan Sukhdev, TEEB Leader, ex Direttore Deutsche Bank) Transport: the environmental impacts of transport and congestion are estimated to have a cost equivalent to up to 5% of GDP. Air pollution: causes in Europe the loss of ca. 150 million working days a year and health costs estimated at between 50 and 100bn a year.

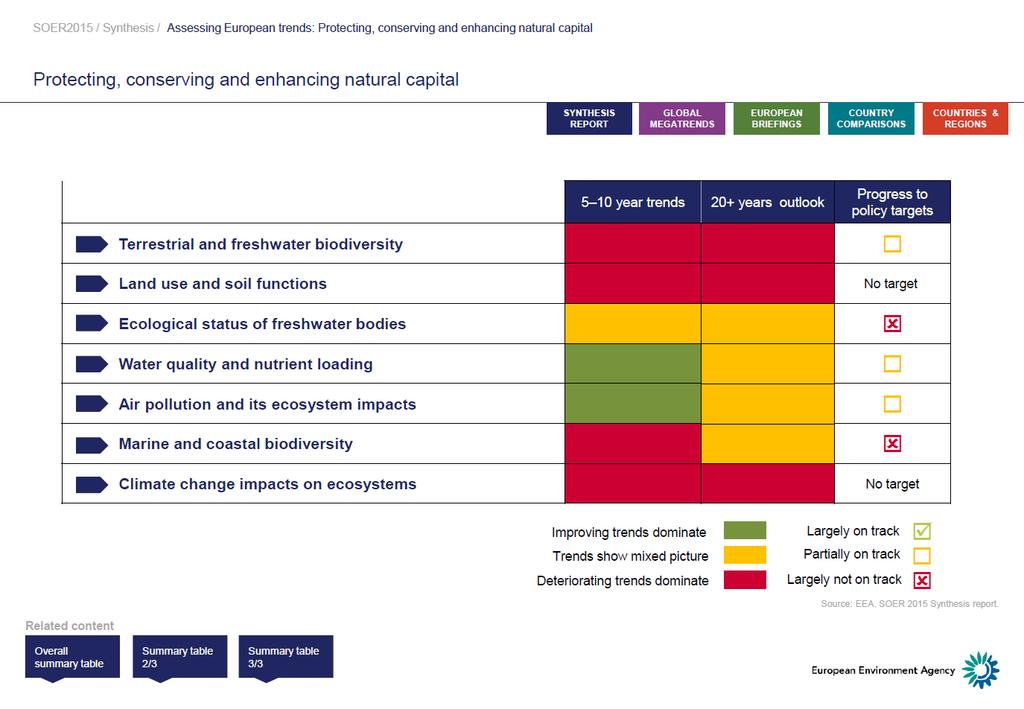
8 EEA SOER 2015 In 2015, Europe stands roughly halfway between the initiation of EU environmental policy in the early 1970s and the EU's 7 th Action Programme 2050 vision of living well within the limits of the planet. Looking back on the last 40 years, the implementation of environment and climate policies has delivered substantial benefits in terms of improvements in environmental, health and living standards of citizens; jobs and growth; and creation of innovation opportunities. Further implementation efforts by countries can increase these positive trends. Living well within ecological limits requires fundamental transitions in the systems of production and consumption that are the root cause of environmental and climate pressures. Achieving this commitment can put Europe at the frontier of science and technology but calls for a greater sense of urgency and more courageous actions. Such transitions require profound changes in dominant institutions, practices, technologies, policies, lifestyles and thinking.
9
10 Waste as a resource Moving up the waste hierarchy Prevention Re-use Recycling Recovery Disposal
11 Example A Mine of the Future Urban mining 1t of good ore contains 5g of gold 1t mobile phones contains 150g of gold! => ecodesign + ricycling
12 Key Resources Key sectors In industrialised countries food, housing and mobility are responsible for 70-80% of all environmental impacts of consumption. FOOD BUILDINGS MOBILITY WATER CLEAN AIR LAND & SOIL MATERIALS MARINE
13 WHY DOES BIODIVERSITY MATTER? An ethical duty: to conserve the sheer variety of life on earth An environmental asset: healthy ecosystems play a vital role in regulating the environment eg a major tool for climate change adaptation An economic imperative: ecosystem goods and services provide a whole range of direct and indirect economic benefits-
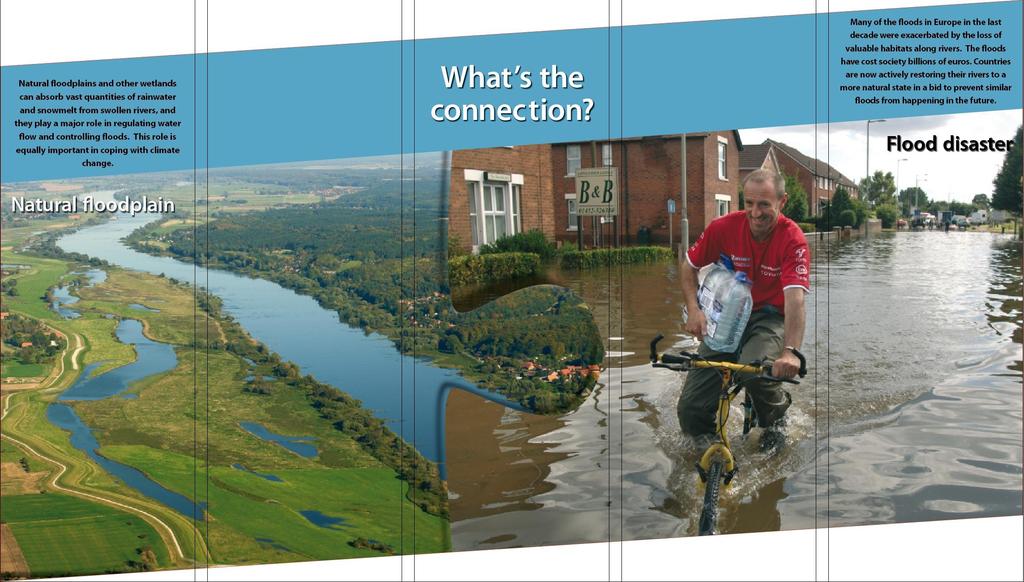
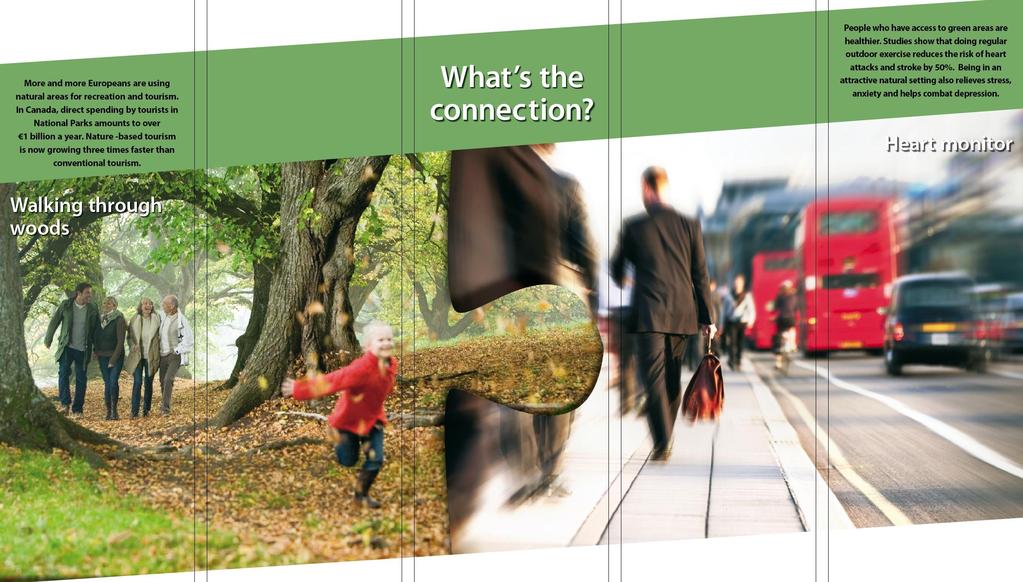
14 ECOSYSTEMS GOODS AND SERVICES Provisioning in the form of harvestable products such as food, drinking water and raw materials; Regulating functions such as carbon sequestration, waste treatment or slowing the passage of water; Cultural services that directly involve people; and Habitat or supporting services that are needed to maintain other services, and which include genetic diversity and maintenance of all life cycles.

15

16
17
18


19 EU 2010 BIODIVERSITY BASELINE Species facing risk of extinction: up to 25% of European animals are included in the IUCN Red List Poor conservation status: 62% of habitats and 52% of species protected by Habitats and Birds Directives Source: EEA Baseline


20 STATE OF BIODIVERSITY DRIVERS/PRESSURES IN THE EU Degradation and fragmentation of habitats Over-exploitation of natural resources Contamination Invasive species Climate Change

21


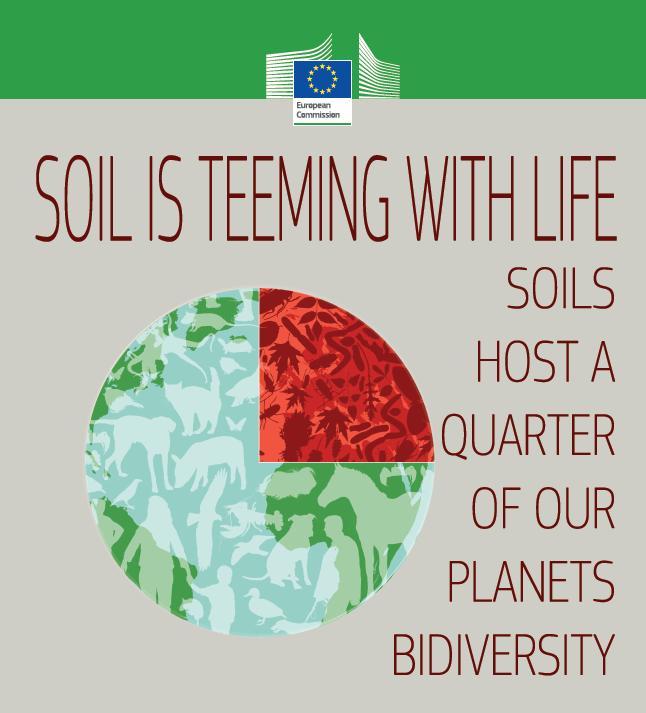
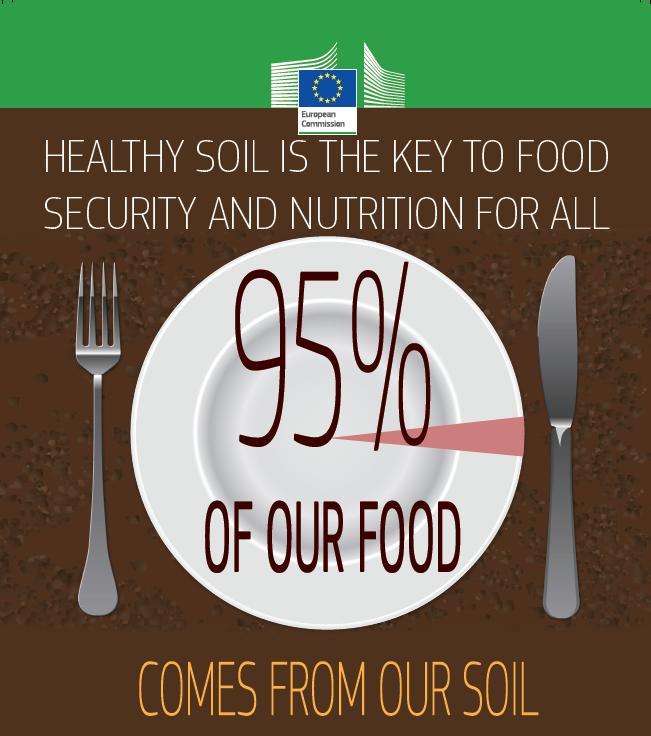
22 Importance of sustainable soil management Food: >95% of human food calories Forest-based industries: About 7% of EU manufacturing GDP and nearly 3.5 million jobs Water storage: up to m 3 /ha or almost 400 mm of precipitation Soil biodiversity: at least a quarter of global biodiversity is in soil Carbon stocks: billion tonnes

23 Impacts of land take on agriculture production capacity Between 1990 and 2006, a potential agricultural production capability equivalent to a total of 6.1 million tonnes of wheat has been lost in 19 MSs, with large regional variations. This is a loss of almost 5% of the average annual European wheat production within a short time-span Ciro Gardi et al. (2014): Land take and food security: assessment of land take on the agricultural production in Europe, Journal of al Planning and Management

24
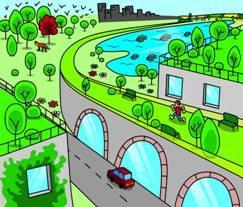


25 GREEN INFRASTRUCTURE Communication 2013(49) Green Infrastructure:
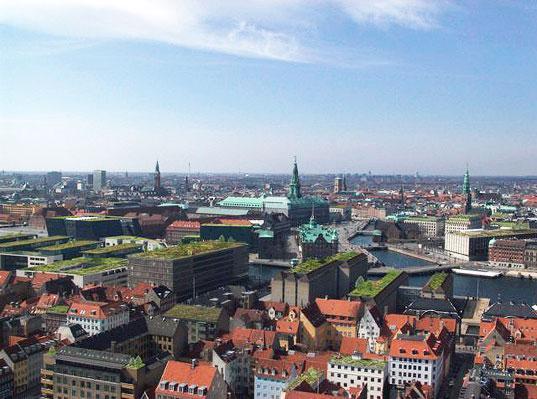
26 GREEN INFRASTRUCTURE- a reality Basel Copenhagen

27 : an EU priority 1. Union policy on the environment shall contribute to pursuit of the following objectives: preserving, protecting and improving the quality of the environment, protecting human health, prudent and rational utilisation of natural resources, Article 191 (TFUE) promoting measures at international level to deal with regional or worldwide environmental problems, and in particular combating climate change. 2. Union policy on the environment ( ) shall be based on the precautionary principle and on the principles that preventive action should be taken, that environmental damage should as a priority be rectified at source and that the polluter should pay.


28 7 th EAP The new General Union Action Programme to 2020 (7 th EAP)
29 The 7 th EAP VISION The following 2050 vision is intended to help guide action up to and beyond 2020: "In 2050, we live well, within the planet's ecological limits. Our prosperity and healthy environment stem from an innovative, circular economy where nothing is wasted and where natural resources are managed sustainably, and biodiversity is protected, valued and restored in ways that enhance our society's resilience. Our low-carbon growth has long been decoupled from resource use, setting the pace for a safe and sustainable global society".

30 The 7 th EAP A 2020 timeframe and 2050 vision 9 Priority objectives 3 THEMATIC: 1. Natural capital 2. Resource efficient, low-carbon growth 3. Health & environment 4 'ENABLING': 4. Implementation 5. Information/Knowledge base 2 'SPATIAL': 8. Urban environment 9. International 6. Investment 7. Integration


31 Thematic priority objectives PO 1: Protect & enhance natural capital PO 2: Transition to resource efficient, lowcarbon economy PO 3: safeguard health & wellbeing Biodiversity Water, Marine Land and soil Forests Nutrient cycle Climate mitigation SCP, Waste Eco-innovation Industrial emissions Water stress Chemicals Air quality Drinking and bathing water quality Noise Climate adaptation


32 Enabling priority objectives PO 4: Implementation PO 5: Evidence base PO 6: Investment/ finance PO 7: Integration Compliance information Partnership agreements Inspections and surveillance Complaints handling Access to justice Knowledge gaps Emerging risks Streamlining data and information EHS, taxation, MBIs European Semester Private/public sector investment GDP and beyond Env. conditionalities and incentives in other policies Impact assessment


33 Spatial priority objectives PO 8: enhance the sustainability of EU cities Sustainability criteria for cities Better access to financing PO 9: increase the EU's effectiveness in confronting regional and global environmental challenges Implement Rio + 20 outcomes Engage more effectively in international env. & climate negotiations Ratify outstanding MEAs Strategic cooperation with partner countries Reducing env. impact of EU consumption on partner countries/regions


34 More information DG : SOER 2015 (European Agency): The EU Action Programme (7th EAP): Resource efficiency: Circular economy: Summary of EU al policy/legislation: andrea.vettori@ec.europa.eu Thank you for your attention!