Measuring Success: Using data wisely for a healthier, wealthier, more equitable city. NACTO Conference, October 2013.
|
|
|
- Avis Townsend
- 5 years ago
- Views:
Transcription


1 Measuring Success: Using data wisely for a healthier, wealthier, more equitable city NACTO Conference, October 2013 Jeffrey Tumlin
2 Commonly Used Performance Measures Source: Reid Ewing
3 Old Speed Paradigm -> Roadway LOS Source: Reid Ewing
4 Level of Service A 4
5 Level of Service F Source: Neighborhoods.org 5

6 Level of Service F Source: Downtown San Jose Blog 6

7 What s important depends upon perspective Traffic engineer: F A Economist: A F 7

8 What s wrong with LOS? To be conservative, transportation analyses typically use ITE trip generation rates, data from isolated, single-use projects with no access except by car. TODs typically generate ~50% fewer vehicle trips than predicted by ITE. ( Effects of TOD on Parking, Housing and Travel, TCRP 128, 2008) Guidelines focus on localized traffic impacts and ignores regional impacts.

9 LOS Increases Congestion To mitigate a negative transportation impact: Reduce density Widen roadways Transportation Demand Management Move the project to a more isolated location with less existing traffic congestion Result: Less walking, biking and transit. Mitigation becomes a selffulfilling prophesy
10 Induced and Latent Demand Congestion More People Drive Widen Roadway Faster Driving 10
11 What Get Measured Get Done
12 How do we use Performance Measures? Improving efficiency of system operations Managing a given road or corridor Prioritizing funding Measuring impact of new development Imposing development fees Reporting to Congestion Management Agency Reporting on achievement of various goals 12

13 What is transportation for? Transportation is not an end in itself It is merely a means by which we support individual and collective goals and objectives 13
14 Measure what matters Why not Consider Economic Development Job creation Real estate value increase Retail sales Quality of Life Access to jobs Access to shopping Residential property value impact Social Justice Do benefits accrue equitably? Are investments spread equitably? Ecological Sustainability VMT per capita (=CO 2, NO x, runoff, etc.) Land use/transportation connection 14
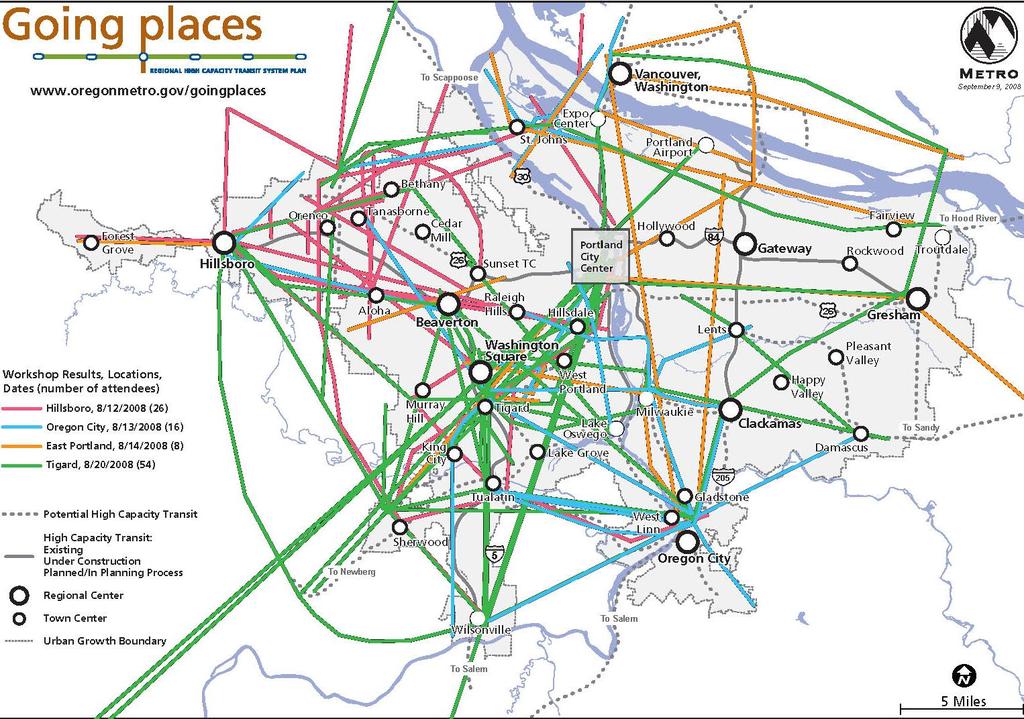
15 Case Study: Portland

16 Evaluating Opportunities
17 Possibilities
18 Round I Screening Current and future ridership potential Connectivity & system benefit Cost & corridor availability Environment constraints Equity Congestion Alignment with 2040 Growth Concept Transit origins and destinations

19 Planning for a sustainable region Corridor map
20 Multiple Account Evaluation (MAE) Adopted from United Kingdom New Approach To Transport Appraisal (NATA) Multiple benefit accounts considered Criteria selected based on local conditions/values

21 Applying the MAE Organized into three accounts that correspond to the outcomes-based RTP evaluation approach:
22 25 Evaluation Criteria Community Environment Economy Deliverability C1: Supportiveness of Existing Land Uses C2: Local Aspirations C3: Placemaking and Urban Form C4: Ridership Generators C5: Support of regional 2040 Growth Concept C6: Integration with Regional Transit System (Addressed in White Paper) C7: Integration with Other Road Uses C8: Congestion Avoidance Benefit C9: Equity Benefit C10: Health (Promotion of Physical Activity) C11: Safety and Security (Addressed in White Paper) C12: Housing + Transportation Affordability Benefit C13: Transportation Efficiency (User Travel Time Savings) EN1: Reduction in Emissions and Disturbance EN2: Risk of Natural Resource Disturbance EN3: Risk of 4(f) Resource Disturbance (Addressed in White Paper) EC1: Transportation Efficiency (Operator cost per rider) EC2: Transportation Efficiency (System annualized capital & operating cost per rider) EC3: Economic Competitiveness (Change in employment served) EC4: Rebuilding/ Redevelopment Opportunity (vacant and redevelopable land) D1: Total Project Capital Cost (Exclusive & Non- Exclusive ROW Options) D2: Capital Cost Per Mile (Exclusive & Non-Exclusive ROW Options) D3: Operating & Maintenance Cost D4: Total Corridor Ridership D5: Funding Potential


23 MAE Matrix
24 Case Study: Santa Monica
25 Process Identify local values Identify long list of performance measures Refine into short list: Assess today s conditions Predict future conditions Evaluate projects Conduct EIRs Create tools and gather data Establish targets and thresholds Report back to public and Council Adopt impact fee 25
26 Start with Transportation Principles Measure Success Management Streets Quality Public Space Environment Health Affordability Economy Equity Safety Public Benefits 26
27 Creating a Shortlist For each principle, a long list of potential measures and tools for measuring Next step: Short list: Shortest list of measures that captures Santa Monica values Minimize data collection costs Maximize clarity Some measures, like per capita Vehicle Miles Traveled, capture many values: Greenhouse gases, congestion, air quality, etc. 27
28 The Long List Measure Cost/Time Consumption Implementation EIR Project Review Corrid or Review Repo rt Card Travel Model MANAGEMENT Relative travel times by mode Medium Can be modeled; see WeHo traffic model. Can also be collected through data collection. Transit travel times can be automated in GPS. Person capacity walking, bike, transit, auto, parking, bike parking Medium - Heavy This is a GIS/Excel type function that can be included if there is survey data available. Can be modeled. This needs to be further defined.?? Transit LOS: productivity, farebox return, delay, reliability Medium - Heavy This will take extensive model development if we want to get to this level in the demand model. Direct ridership modeling would be another option and would require less data/development time. Transit LOS could also be developed and monitored separate from the model in an Excel spreadsheet. BBB already does a basic collection of this info, and full transit LOS data may be available in upcoming GPS reporting from BBB. Seattle uses transit LOS in an annual GIS report card map, focusing on transit speed and frequency. SF uses transit LOS in their EIRs Neighborhood spill-over Medium Either traffic volumes or driver behavior (speed, etc) Congestion Light The sustainability report card currently measures intersection LOS. Congestion is also indirectly measured in the relative travel times by mode and the person capacity analysis above. (There is community resistance to using intersection LOS.) Adjust significance thresholds if used for EIRs. 2 8

29 Vary targets by Context
30 Santa Monica: Application Main Street FUNCTION CONTEXT ZONE Minimum Desirable Preferred Measured Transit Secondary N hood Commercial Auto Secondary N hood Commercial <1.2 <0.8 > Pedestrian Primary N hood Commercial B A A B Result: OK to slightly degrade auto QOS to improve transit and pedestrian QOS. Signal prioritization OK, but not dedicated transit lane. Goal: Bring all measures into balance
31 Tools and Data GIS mapping Transportation Demand Management reporting data Big Blue Bus GPS data Public perception surveys Traffic counts 31
32 Results: Delay from Previous Tools Increases in both directions on all corridors

33 Reduced delay from new approach Decreases or no increase on 10 corridors in at least one direction during AM and/or PM peak

34 34
35 Achieves major outcome goals: Reduce VMT 4% decrease in per capita Vehicle Miles Traveled for proposed LUCE 33% improvement in per capita VMT reduction compared to 1984 Plan. 0% -1% -2% -3% -4% 1984 Plan LUCE -5% Per capita includes population and employment
36 Results: Achieves GHG Reduction Goals 1,000, ,000 AB 32 Target 900, , , ,000 Sustainable City Plan Target 700, , , , ,000 Existing 1984 Plan (2030) Proposed LUCE (2030)
37 Best practice Focus on outcomes. Ensure your local values are reflected and quantified. Include the triple bottom line. Use available or easily collectable data. Focus on citywide or regional impacts: don t make things a lot worse for everyone in order to make things a little better for a few. MMLOS can be bad for transit, biking and walking if misapplied. Focus on quality, not crowding. For congestion, focus on per capita Vehicle Miles Traveled. 37

38 For More Information Jeffrey Tumlin Mobility Accessibility Sustainability 116 New Montgomery St, Ste 500 San Francisco, CA Tel: