M Observations for Water Treatment Plant
|
|
|
- Grant Casey
- 5 years ago
- Views:
Transcription
1 M31.2 Opa Water Supply Scheme M Observations for Water Treatment Plant The Opa facility has been augmented over the years and currently consists of 4 river intakes (one for each self contained WTP). The original site contains Plant I, 8 commissioned in 1957 and Plant II, 12 commissioned in Plant III, 52 commissioned in 1972 (later increased to 72 by adding an extra filter bed) and Plant IV, 4 commissioned in 24 are both sited at Curti, approximately 2. km away. Table M lists the summary of asset data for the WTP and Table M contains detailed asset data for the WTP. The plant schematic is shown on Figure M Both compounds, Opa and Curti, are adequately gated, fenced and secured by 24 hour on-site security personnel. All plants are operated and maintained 24 hours a day, using a three shift system. Except for the newest plant, flow measurement devices are not installed. Therefore, the amount of raw water supplied to the plants and the clean water fed to reservoirs was estimated based on pump design capacities and hours of operation. The original compound has a process control laboratory for the 8 and 12 plants. These plants are manually controlled. Considering the respective ages of the plants, most of the equipment appears to be in good working order, except for the alum and lime mixers. These mixers appear to be in poor order or out of service. Both plants have good maintenance standards. Disinfection is achieved using gas chlorination. The chlorination is delivered using one tonne cylinders. Maintenance, installation standards and operation practices for chlorine use are poor. There are no facilities for adequately detecting or containing gas leaks. Personal breathing apparatus is available in the laboratory but is not used or maintained. Records of chemical usage and treatment parameters are logged by the laboratory staff. Records of pump running hours, load, filter backwashing and clear water reservoir levels are logged. However records of repairs and maintenance/breakdown problems are not logged. The high speed pump couplings/shafts are not guarded. M31-47
2 The 4 plant has its own process control laboratory. Records of the chemical usage and treatment parameters are logged by the laboratory staff. M/S Environ Control Associates Private Ltd Surat built, operated and maintained the plant for 18 months before handing it over to the PHE. A basic operation and maintenance manual was provided to the PHE at this time outlining basic operating, maintenance and H&S instructions. On the job training was provided by the contractors during the operation and maintenance period. The plant appears to be in good working order and maintenance standards are good. The plant is manually operated but electrical valve actuators are in use. It is understood that a proposal to install a SCADA system has been prepared. Records of pump running hours, load, filter backwashing and clear water reservoir levels are logged. However records of maintenance, repairs and maintenance/breakdown problems are not maintained. Disinfection is achieved using gas chlorination. The chlorination is delivered using three, one tonne cylinders. Maintenance, installation standards and operation practices for chlorine use are poor. There are no facilities to adequately detect or contain gas leaks. Personal breathing apparatus is available in the laboratory but is not used or maintained. The 52 plant has its own process control laboratory. Records are logged by the laboratory staff for chemical usage and treatment parameters. Records are kept for pump running hours, load, filter backwashing and clear water reservoir levels. However records of maintenance, repairs and breakdown problems are not maintained. An Electro-chlorination system is used for disinfection. This appears to be in good working order and maintenance standards are generally good (except for the chlorination room). Gas chlorination using one tonne cylinders is available for back-up purposes but appears to be in relatively poor condition. There are no facilities to detect or contain leaks. Tables M and M and Figure M show the flow rate data for Opa/Curti Treatment Plants. Table M and Figure M show the data on monthly water quality at Curti Water Treatment Plant. Table M shows records on power outages at Opa Water Treatment Plant. M31-48
3 Table M Summary of Asset Register of Opa Water Treatment Plant (1/2) Raw Water Intake & Raw Water Transmission Facility Treatment Facility Name of Facility Intake Well & Connecting Pipe 8 (1.76 MGD) 12 (2.5 MGD) Contents of Facility Remarks Contents of Facility Remarks D4mm 1 Line, Khandepar River D4mm 1 Line, Khandepar River D3mm 1 Line Pump & Motor Horizontal Centrifugal Pump: Q 334m 3 /hr H 22m 37kw 3 units (1 or 2 Standby) Raw Water Transmission Main Design Cap. of Intake Pump = 8~16 Horizontal Centrifugal Pump: Q 552m 3 /hr H 27.5m 75kw 3 units (1 or 2 Standby) D35mm 55m C.I.P. 1 Line D45mm 45m C.I.P. 1 Line Aerator Not Provided Cascade Type: 1 unit Flash Mixer & Weir Not Provided 1 unit (for Chemical Dosing) Design Cap. of Intake Pump = 13.2~26.5 Chemical Feeding Facility Clariflocculator Circular Horizontal Flow Type with Center Feed/Peripheral Collection Flocculation & Clarifier: D 12.5m (Flocc. Zone??m) WD 5.m 1 unit Detention Period: Flocculation -??min Clarifier -? hrs 1) Overall 1.75 hrs Surface Loading:?? m 3 /m 2 /d (?? mm/min) 2) Filter Gravity Rapid Sand Filter Type Alum Feeding Facility Dry Aluminum Sulfate Solution Tank: 2 units W 2.5m L 7.5m 2cells/basin 5 basins Effective Size of Sand:.71mm, Depth of Sand:?.??m Filter Area: 9.4 m 2 /cell, 18.8 m 2 /basin Filtration Rate: 3.75 m/hr 3) (9 m/d) Air Scouring Rate:??m/hr/cell 4 ) (?? m 3 /min/m 2 /cell) Backwash Rate: 38.4 m/hr/cell 5) (.64 m 3 /min/m 2 /cell) 1): 2~2.5 hrs 2): 3~4m 3 /m 2 /d Using dosing point and by-pass flow of rqw water due to malfunction of equipment. Based on Specifications of Air Blower & Backwash Pump 3): 4.8~6.m/hr 4): 36~54m/hr 5): 24~36m/hr Circular Horizontal Flow Type with Center Feed/Peripheral Collection Flocculation & Clarifier: D 22.73m (Flocc. Zone??m) WD 5.m 1 unit Detention Period: Flocculation -??min Clarifier -? hrs 1) Overall 3.86 hrs Surface Loading:?? m 3 /m 2 /d (?? mm/min) 2) Gravity Rapid Sand Filter Type W 5.5m L 5.m 2cells/basin 4 basins Effective Size of Sand:.71mm, Depth of Sand:?.??m Filter Area: m 2 /cell, 27.5 m 2 /basin Filtration Rate: 4.8 m/hr 3) (115 m/d) Air Scouring Rate:??m/hr/cell 4 ) (?? m 3 /min/m 2 /cell) Backwash Rate: 33 m/hr/cell 5) (.55 m 3 /min/m 2 /cell) - (15m 3 Backwash Tank) Dry Aluminum Sulfate Solution Tank: 2 units Lime Feeding Facility Using 12 facility Powder Lime Solution Tank: 5 units Disinfection Facility Liquid Chlorine (1 tone Container net 9kg) Chlorinator: 1 unit Laboratory Frequency of Sampling & Analysis Clear Water Transmission Facility Clear Water Sump Volume=175 m 3 1 unit, Retention Time:.5 hr Transmitted Pump & Motor Horizontal Centrifugal Pump: Q 334m 3 /hr H 16m 215kw 3 units (1 or 2 Standby) Liquid Chlorine (1 tone Container net 9kg) Chlorinator: 1 unit In-Service, Jar Test: Not in Service Every Hour: ph, Turbidity, R-Cl Daily: Turbidity, ph, Alkalinity, Hardness, Chlorine, Mn, Fe, D.O.,R-Cl Design Cap. of Pump = 8 ~16 Volume=1,35 m 3 1 unit, unit, Retention Time: 2.57 hr Horizontal Centrifugal Pump: Q 545m 3 /hr H 168m 45kw 3 units (1 or 2 Standby) Transmission Line D35mm 8m (C.I.P. + M.S.P.) 1 Line D4mm 1,6m (C.I.P. & M.S.P.) 1 Line D5mm 1,6m (C.I.P. & M.S.P.) 1 Line Clear Water Reservoir (MBR) Note: 1) ~ 4) are referring to Manual on Water Supply and Treatment, Third Edition Revised and Updated, May 1999 Volume=8 m 3 4 units, Total Volume = 3,2 m 3 Retention Time:?? hr 1): 2~2.5 hrs 2): 3~4m 3 /m 2 /d Based on Specifications of Air Blower & Backwash Pump 3): 4.8~6.m/hr 4): 36~54m/hr 5): 24~36m/hr Design Cap. of Pump = 13~26 M31-49
4 Table M Summary of Asset Register of Opa Water Treatment Plant (2/2) Raw Water Intake & Raw Water Transmission Facility Treatment Facility Name of Facility Intake Well & Connecting Pipe D45mm 6 Lines, D45mm 1 Line Pump & Motor Horizontal Centrifugal Pump: 72 (16 MGD) 4 Contents of Facility Remarks Contents of Facility Remarks Common for 2 Plants Q 864m 3 /hr H 176m 55kw 2 units Q 648m 3 /hr H 176m 55kw 2 units Q 648m 3 /hr H 176m 475kw 3 units (2 or 3 Standby) Khandepar River Jack Well & pump House: Dia. 9.m Connecting Pipe: Not Provided Design Cap. of Intake Pump for 2 Plants = 122 ~148 Vertical Pump: Q 1,25m 3 /hr H 19.5m 875kw 3 units (1 Standby) Raw Water Rising Main D75mm 1,6m C.I.P. 2 Lines D75mm 1,9m C.I.P. 1 Line Stilling Chamber Not Provided W 3.m L 3.m W.D.3.1m 1 basin Detention period: 1 min Aerator Cascade Type: 1 unit Cascade Type: 1 unit Flash Mixer & Parshal Flume Each 1 unit (for Chemical Dosing) Each 1 unit (for Chemical Dosing) D Contact Aeration Tank Not Provided 17.5m W.D.5.m 1 basin Detention period: 41 min Clarifier / Settling Tank (Clariflocculator) Circular Horizontal Flow Type with Center Feed/Peripheral Collection Flocculation & Clarifier: D 4.m (Flocc. Zone??m) WD 5.m 2 units Detention Period: Flocculation -??min Clarifier -? hrs 1) Overall 4. hrs Surface Loading:?? m 3 /m 2 /d (?? mm/min) 2) 1): 2~2.5 hrs 2): 3~4m 3 /m 2 /d Reactor Clarifier Type with Center Feed / Peripheral Collection Flocculation & Clarifier: D 3.m (Flocc. Zone 11.m) WD 5.m 1 unit Detention Period: Flocculation - 18min Clarifier 1.9 hrs 1) Surface Loading: 68.7 m 3 /m 2 /d (47.7 mm/min) 2) Khandepar River Design Cap. of Intake Pump for 2 Plants = 122 ~148 1): 1~1.5 hrs 2): 4~5m 3 /m 2 /d Filter Gravity Rapid Sand Filter Type W 12.2m L 7.6m 2cells/basin 6 basins: Filter Area=92.7m 2 /basin W 9.92m L 6.98m 2cells/basin 1 basin: Filter Area=69.1m 2 /basin W 1.88m L 7.6m 2cells/basin 1 basin: Filter Area=82.7m 2 /basin Effective Size of Sand:.71mm, Depth of Sand:?.??m Filtration Rate: 4.46 m/hr 3) (17 m/d) Air Scouring Rate:??m/hr/cell 4 ) (?? m 3 /min/m 2 /cell) Backwash Rate:??.? m/hr/cell 5) (.?? m 3 /min/m 2 /cell) Based on Specifications of Air Blower & Backwash Pump 3): 4.8~6.m/hr 4): 36~54m/hr 5): 24~36m/hr Gravity Rapid Sand Filter Type W 4.5m L 9.5m 2cells/basin 4 basins Effective Size of Sand:.71mm, Depth of Sand:?.??m Filter Area: 21.4 m 2 /cell, 42.8 m 2 /basin Filtration Rate: 1.2 m/hr 3) (245 m/d) Air Scouring Rate:??m/hr/cell 4 ) (?? m 3 /min/m 2 /cell) Backwash Rate: 34.8 m/hr/cell 5) (.58 m 3 /min/m 2 /cell) - (6m 3 Backwash Tank) Dirty Water Sump Not Provided D 13.m W.D 1.5m 1 basin, Volume:199 m 3 Based on Specifications of Air Blower & Backwash Pump 3): Higher than Standard(4.8~6.m/hr) 4): 36~54m/hr 5): 24~36m/hr Chemical Feeding Alum Feeding Facility Dry Aluminum Sulfate Dry Aluminum Sulfate Facility Solution Tank: 3 units Solution Tank: 3 units Lime Feeding Facility Powder Lime Powder Lime Solution Tank: 2 units Solution Tank: 3 units Disinfection Facility Liquid Chlorine (1 tone Container net 9kg) Chlorinator: 1 unit Laboratory Frequency of Sampling In-Service, Jar Test: Not in Service In-Service, Jar Test: Not in Service & Analysis Every Hour: ph, Turbidity, R-Cl Daily: Turbidity, ph, Alkalinity, Hardness, Chlorine, Mn, Fe, D.O.,R-Cl Clear Water Clear Water Reservoir Volume= 3,3 m 3 3 units, Volume= 5, m 3 2 units, Liquid Chlorine (1 tone Container net 9kg) Chlorinator: 1 unit Every Hour: ph, Turbidity, R-Cl Daily: Turbidity, ph, Alkalinity, Hardness, Chlorine, Mn, Fe, D.O.,R-Cl M31-5
5 Figure M Schematic Sequence of Opa Water Treatment Plant M31-51
6 Table M Present Conditions of Opa Water Treatment Plant (1/8) Background Covered Area for Water Supply Taluka Ponda & Part of Tiswadi (Panaji) Name of Plant Opa W.T.P. Curti W.T.P. Total Number & Name of W.T.P. Number (1) :8 Remark (2) : 12 Remark (3) : 72 Remark (4) : 4 Remark Capacity of Plant MGD 1.76 Imperial 2.5 Imperial 16 Imperial Gallon=4.546 Gallon=4.546 Gallon= Nominal 12 Nominal 72 : Augmented from 55 to 72 4 Nominal 132 m 3 /d 8, 12, 72, 4, 132, Raw Water Resources River Khandepar Khandepar Khandepar Khandepar Dam Year of Construction Year 22-3 Year of Commission Year Opa W.T.P. Curti W.T.P. Total (1) :8 Remark (2) : 12 Remark (3) : 72 Remark (4) : 4 Remark 8.4 : 5% Loss 12.6 : 5% Loss 75.6 : 5% Loss 42. : 5% Loss m 3 /d 8,4 12,6 75,6 42, 138,6 Head Water Works : Raw Water Intake Raw Water Motor Name of Facility Design Capacity of Raw Water Intake & Treatment Facility Intake Well / Jack Well & Pump House Connecting Pipe Raw Water Pump Item Intake Well Intake Well Contents Contents of Facility Intake Well & Jack Well Diameter m Width m Length m H.W.L. : Design m L.W.L. : Design m EL of Weir Diameter mm Number of Line No Length m Material Intake Well Jack Well Capacity l/sec l/min 5, , ,2 9,2 Based on Photo 1,8 14,4 1,8 1,8 2,833 m 3 /min m 3 /hr m 3 /d 8,16 8,16 13,248 13,248 15,552 2,736 15,552 15,552 3, Number unit Stand-by or25 1 unit earch 1 unit Max Min Min Total Capacity m 3 /d 8, 13,2 72,6 62,2 67,4 15,6 6, 148,2 122,2 143,4 Head m Type of Pump Centrifugal Centrifugal Centrifugal Vertical Maker KSB M & P Jyoti KBL KBL KBL Year of Manufacture Assessment of Condition Working / Required Replacement Working / Required Replacement Working Working :1 unit Under repairing Motor Output HP ,173 kw Number Unit Maker CG Jyoti Jyoti CG KEL KEL KEL Year of Manufacture Retrofitted Assessment of Condition Working / Required Replacement Working / Required Replacement Working 13467Required Replacement l l l M31-52
7 Table M Present Conditions of Opa Water Treatment Plant (2/8) Raw Water Transmission Line to Aerator Name of Facility Water Treatment Plant Stilling Chamber Aerator Parshal Flume/Weir Contact Aeration Tank Flash Mixer Opa W.T.P. Contents of Facility Curti W.T.P. (1) :8 Remark (2) : 12 Remark (3) : 72 Remark (4) : 4 Remark Diameter mm Length m ,6 1,6 Raw Water 1,9 Material CIP CIP CIP CIP Rising Main CIP Velocity m/sec Head Loss m Assessment of Pipe Working Working Working, Working Condition Valve Need Replacement Leakage through Gland Leakage through Gland, NRB&SIV to be Repaced Working Dsign Capacity m 3 /min/unit m 3 /hr/unit ,75 m 3 /d/unit , Number Unit Width m Length m Water Depth m Volume m Retention Time min Water Level m Assessment of Condition Working Capacity m 3 /hr Not Provided Not Provided ,75. m 3 /d , , Diameter m Cascade Type Cascade Type Number Unit El. of Top Aerator m Assessment of Condition Working Working Not Provided - - Assessment of Condition Working Working Working Dsign Capacity m 3 /min/unit m 3 /hr/unit ,75 m 3 /d/unit , Number Unit Diameter m Water Depth m Volume m ,22.6 Retention Time min Water Level m Assessment of Condition Working Not Provided - - Assessment of Condition Working Working Working Raw Water Rising Main Total M31-53
8 Table M Present Conditions of Opa Water Treatment Plant (3/8) Clarifiers / Settling Tank (Coagulation Basin) Flocculator Drive Arrangement Filter Name of Facility (1) :8 Remark (2) : 12 Remark (3) : 72 Remark (4) : 4 Remark m 3 /min/unit m 3 /hr/unit ,575. 1,75. m 3 /d/unit 8,4 12,6 37,8 42, Number Unit Dsign Capacity Type of Clarifier Circular Horizontal Flow Type with Center Feed/Peripheral Collection Contents of Facility Opa W.T.P. Curti W.T.P. Circular Horizontal Flow Type with Center Feed/Peripheral Collection Circular Horizontal Flow Type with Center Feed/Peripheral Collection Overall Diameter m Floccul. Zone Dia. m 11. Water Depth m Frequency of Desludging Volume Using for By-pass General Season : Once a Day General Season : Once a Day General Season : Once a Day Monsoon Season: Twice a Day Monsoon Season: Twice a Day Monsoon Season: Twice a Day Overall m 3 /unit ,28.9 6, ,887.7 Floccul. Zone m 3 /unit Clarifying Zone m 3 /unit ,28.9 6, ,365. Retention Time Overall Floccul. Zone hr....3 Clarifying Zone Surface Area m 2 /unit , Surface Loading mm/min W.L. of Clarifier m Assessment of Condition Required Overhauling / Replacement Working Working Working Number unit Assessment of Condition Required Overhauling / Replacement Working Working Working Number unit Assessment of Condition Required Overhauling / Replacement Working Working Working Number Unit Type of Filter Rapid Sand Filter Rapid Sand Filter Rapid Sand Filter Rapid Sand Filter Design Capacity m 3 /hr/unit m 3 /d/unit 1,68 3,15 1,5 Width m Total Area Length m Filtered Area m 2 /unit Velocity m 3 /d/m OK Ok 16.8 OK High Rate Filter Media E.S. of Sand mm Standard Size :.71mm Standard Size :.71mm Standard Size :.71mm Standard Size :.71mm Depth of Sand mm Type of Underdrain Year Replacement of Media Plasitic Nozzle Plasitic Nozzle Plasitic Nozzle Plasitic Nozzle 3mm Partial Replacement in '97-'98 3mm Partial Replacement in '97-'98 Upper Media Layer Topped up in '1 W.L. of Filter m Assessment of Condition Working Working Working Working Reactor Clarifier Type with Center Feed/Peripheral Collection No Replacement Total M31-54
9 Table M Present Conditions of Opa Water Treatment Plant (4/8) Filter Washing Name of Facility Air Scouring Rate m 3 /min/m 2 Contents of Facility Opa W.T.P. Curti W.T.P. (1) :8 Remark (2) : 12 Remark (3) : 72 Remark (4) : 4 Remark Backwash or Lifting Pump & Motor Air Blower Clear Water Sump Air Scouring Time min 5 Act.: Act.: 3 Backwash Rate m 3 /min/m 2.64 OK.55 OK.?.58 25m3/time OK Back Wash Drain m 3 /Unit m3/min/m m3/min/m m3/min/m m3/min/m2 Backwashing Time min 1 Act.: Act.: 7 Frequency of Washing General Season : Once a Day General Season : Once a Day General Season : Once a Day General Season : Once a Day Monsoon Season: 1~2 Times a Day Monsoon Season: 1~2 Times a Day Monsoon Season: 1~2 Times a Day Monsoon Season: Twice a Day Capacity m 3 /min Lifting. Lifting m 3 /hr Pump & 3. Pump & Number unit 2 2 Motor 2 2 Motor Stand-by unit m3 6m3 1 1 Back Wash Back Wash Total Capacity m 3 /min Water. Water Head m 2 2. Tank Tank Type of Pump Motor Output Assessment of Condition Capacity Centrifugal Centrifugal Centrifugal Centrifugal HP kw Working Working Working Working m 3 /min m 3 /hr 9 Number unit Stand-by unit Total Capacity m 3 /min Head Motor Output Assessment of Condition HP 2 2 kw 15 3 Width m Length m Water Depth m Number Unit Volume m , Last Date of Cleaning Pediodical Pediodical Total m , Detention Time hr Assessment of Condition Working Need Plastering Total M31-55
10 Table M Present Conditions of Opa Water Treatment Plant (5/8) Transmitted (Clear Water) Pump Transmitted (Clear Water) Motor Transmission Lines Name of Facility Capacity Contents of Facility Opa W.T.P. Curti W.T.P. (1) :8 Remark (2) : 12 Remark (3) : 72 Remark (4) : 4 Remark l/sec N.A N.A. - - m 3 /min m 3 /hr m 3 /d 8,16 13, Number Stand-by unit Total Capacity m 3 /d 8, 13, Head m Type of Pump Centrifugal Centrifugal Maker KSB Mather Platt Year of Manufacture Assessment of Condition Working Working Motor Output HP N.A N.A. - - kw Number Unit Maker Siemens CG Year of Manufacture 2 Replaced Assessment of Condition Working Working Diameter mm N.A N.A. - - Length m 8 8 1,6 1, Material CIP MS CIP, MS CIP, MS Velocity m/sec Head Loss m Pipe Working Working MS Line Need Replacement Non-Return Valve Need Replacement Valve Working Working N.A. - - N.A. - - N.A Working Diameter m Water Depth m Parshal Flume Assessment of Condition Clear Water Reservoir (MBR) Dirty Water Sump Assessment of Condition Number Unit 4 3 RCC, MBR 2 RCC, MBR Volume m 3 8 3,79 3,3 5,27 5, Last Date of Cleaning Pediodical Pediodical Total m 3 3,2 9,236 9,9 1,53 1, 22,29 Detention Time hr 3.86 Assessment of Condition Working Working Working Number Unit Diameter m Water Depth m Volume m 3 /unit Retention Time min Wash Drain Water Level m Assessment of Condition Total M31-56
11 Table M Present Conditions of Opa Water Treatment Plant (6/8) Name of Facility Contents of Facility Opa W.T.P. Curti W.T.P. (1) :8 Remark (2) : 12 Remark (3) : 72 Remark (4) : 4 Remark Chemical Facility Alum Feeding Capacity kg/hr Facility m 3 /unit Diameter m Width m Length m Height m Volume m Number Unit Stand-by Assessment of Condition Working Working Working Working Lime Feeding Capacity kg/hr - Facility m 3 /unit - Diameter m Width m Length m Height m 2.3 Volume m Number Unit Stand-by Assessment of Condition - Working Working Working Disinfection Chemical Used Liquid Chlorine / Bleaching Powder Liquid Chlorine / Bleaching Powder Liquid Chlorine / Bleaching Powder Liquid Chlorine / Bleaching Powder System Type of Plant & Machinery Aquapura Make Aquapura Make Aquapura Chlorinator Vaccum Operated Capacity kg/hr Number Unit Stand-by Safty Measures Taken Safety Mask/Oxygen Cylinder/Gloves Available Commissioned Assessment of Condition Substation (Transformers) Number of Transformer Pole Mounted / Pad Mounted Capacity Number Stand-by Commissioned Likely Design Life Last Replacement Assessment of Condition Safety Mask/Oxygen Cylinder/Gloves Available Safety Mask/Oxygen Cylinder/Gloves Available /23 2,3 Need Replacement Need Replacement Need Replacement Good Safety Mask/Oxygen Cylinder/Gloves Available Pad Pad Pad Pad Pad kva 1, for 8 3,15 for 12 3,15 for 72 2,5 for 4 35 for Culti Unit Nil Nil Nil Nil Year Overhauled Working Good Working Working Total M31-57
12 Table M Present Conditions of Opa Water Treatment Plant (7/8) Name of Facility Laboratory Chemical Testing Laboratory Jar Testing Availability of Skilled Chemists Availability of Required Chemicals Use of Test Reports Frequency of Sampling General Quality of Water Equipment Status Flow Meters Other Operating Valves Raw Water Quality Clear Water Quality Other Important Assets Valve's Condition Visible Leakage and Locations Building Condition Wastewater Disposal Arrangements Contents of Facility Opa W.T.P. Curti W.T.P. (1) :8 Remark (2) : 12 Remark (3) : 72 Remark (4) : 4 Remark Total In-service (Exist) In-service (Exist) Exist at Curti Available Available Available Available Available Available Available Available As per Format As per Format As per Format As per Format Residual Cl - Hourly & Other Tests Residual Cl - Hourly & Other Tests Residual Cl - Hourly, Mn Fortnightly & Other ph, Turb., R-Cl - Hourly, other Tests Daily Daily Tests Daily Alternate Day Good Good Good Good Turbid., Low ph Turbid., Low ph Turbid., Low ph Turbid., Low ph Good Good Good Good - No Flow Meter Vetury Flume Ultrasonic working Working Working Working Working Leakage through Gland Working Working Nil Nil Filter Valves from Grand Leakage throgh Filter & Drain Valves Good Good Good Curti Quarters, Godown Requir Repair Sludge Chamber to River Sludge Chamber to River Through Drainage System Recirculation M31-58
13 Table M Present Conditions of Opa Water Treatment Plant (8/8) Present Condition of Opa & Curti Water Treatment Plant No. 6 Organization & Staff Deployed (Common for 4 - Treatment Plant) General Shift Shift in Plant Operation 1: am 5:45 pm Assistant Engineer 1 Person Technical Assistant 1 Person Junior Engineer 4 Persons Chemist Person Electriciann Person Total Person 2 - Shifting System Covering 24 Hours Working Hour : 1: 8:3 am 5:3 pm, 2: 5:3 pm 8:3 am Grouping Staff Deployed Number of Groupe 3 Groupe 3 Groupe 3 Groupe 3 Groupe 3 Groupe Number of Staff per Groupe 3 Persons 4 Persons 6 Persons 6 Persons 6 Persons Maintenance Staff Total Management Staff - Engineers Assistant Engineer L.D.C Drivers Sub-total Skilled Staff - Operators / Quality Testing Lab - Technician Chift In Charge Electrician Chlorine Operator Filter Operator Mechanics Skikked Workman Assist. Electrician Assist. Plumber Assist. Mistry Assist. Mechanics Unskilled Staff Total Number Working Hour : Staff Deployed : Item Staff Deployed at the Plant Technical Assistant Junior Engineer Person Supervisor Pump Operator 2 Pump Attendant 4 Operator Sub-total (1) :8 (2) : 12 (3) : 72 (4) : Common for 4 Plants at Opa Waterworks Qualification Year of Service B.E.(Mech) B.E.(Civil) DEE/DME S.S.C. S.S.C. M. Sc/B. Sc ITI ITI S.S.C./ITI S.S.C. S.S.C./ITI 8 th ITI Certificate 7 th Ave Ave. 15 Ave. 2 Ave. 23 Ave. 29 Ave. 2 Ave. 22 Ave. 2 Ave. 2 Ave. 2 Ave. 32 Ave. 16 Ave. Service at plant 12 5 Ave. 15 Ave. 2 Ave. 15 Ave. 29 Ave. 2 Ave. 22 Ave. 2 Ave. 2 Ave. 2 Ave. 32 Ave. 4 th 16 Ave. S.S.C./ITI 2 Ave. 17 Ave. 7 th / ITI 15 Ave. 15 Ave. 7 th / S.S.C. 17 Ave. 17 Ave. 2 ITI 23 Ave. 19 Ave Workman, Labourer, Khalashi, Watchman, Helper, etc Ave. Contents (5) : Intake M31-59
14 Table M Flow Rate of Opa Water Treatment Plant in 23 (1/6) DATE MONTH : January VT 648 m 3 /hr 864 m 3 /hr 473 m 3 /hr 333 m 3 /hr 125 m 3 /hr Total () 1% LESS 1-Jan Jan Jan Jan Jan Jan Jan Jan Jan Jan Jan Jan Jan Jan Jan Jan Jan Jan Jan Jan Jan Jan Jan Jan Jan Jan Jan Jan Jan Jan Jan Total Maximum Minimum Average DATE MONTH : February VT 648 m 3 /hr 864 m 3 /hr Total 473 m 3 /hr 333 m 3 /hr 125 m 3 /hr () 1% LESS 1-Feb Feb Feb Feb Feb Feb Feb Feb Feb Feb Feb Feb Feb Feb Feb Feb Feb Feb Feb Feb Feb Feb Feb Feb Feb Feb Feb Feb Total Maximum Minimum Average M31-6
15 Table M Flow Rate of Opa Water Treatment Plant in 23 (2/6) MONTH : March-3 DATE VT 648 m 3 /hr 864 m 3 /hr Total 473 m 3 /hr 333 m 3 /hr 125 m 3 /hr () 1% LESS 1-Mar Mar Mar Mar Mar Mar Mar Mar Mar Mar Mar Mar Mar Mar Mar Mar Mar Mar Mar Mar Mar Mar Mar Mar Mar Mar Mar Mar Mar Mar Mar Total Maximum Minimum Average MONTH : April-3 DATE VT 648 m 3 /hr 864 m 3 /hr Total 473 m 3 /hr 333 m 3 /hr 125 m 3 /hr () 1% LESS 1-Apr Apr Apr Apr Apr Apr Apr Apr Apr Apr Apr Apr Apr Apr Apr Apr Apr Apr Apr Apr Apr Apr Apr Apr Apr Apr Apr Apr Apr Apr Total Maximum Minimum Average M31-61
16 Table M Flow Rate of Opa Water Treatment Plant in 23 (3/6) MONTH : May-3 DATE VT 648 m 3 /hr 864 m 3 /hr Total 473 m 3 /hr 333 m 3 /hr 125 m 3 /hr () 1% LESS 1-May May May May May May May May May May May May May May May May May May May May May May May May May May May May May May May Total Maximum Minimum Average MONTH : June-3 DATE VT 648 m 3 /hr 864 m 3 /hr Total 473 m 3 /hr 333 m 3 /hr 125 m 3 /hr () 1% LESS 1-Jun Jun Jun Jun Jun Jun Jun Jun Jun Jun Jun Jun Jun Jun Jun Jun Jun Jun Jun Jun Jun Jun Jun Jun Jun Jun Jun Jun Jun Jun Total Maximum Minimum Average M31-62
17 Table M Flow Rate of Opa Water Treatment Plant in 23 (4/6) MONTH : July-3 DATE VT 648 m 3 /hr 864 m 3 /hr Total 473 m 3 /hr 333 m 3 /hr 125 m 3 /hr () 1% LESS 1-Jul Jul Jul Jul Jul Jul Jul Jul Jul Jul Jul Jul Jul Jul Jul Jul Jul Jul Jul Jul Jul Jul Jul Jul Jul Jul Jul Jul Jul Jul Jul Total Maximum Minimum Average MONTH : August-3 DATE VT 648 m 3 /hr 864 m 3 /hr Total 473 m 3 /hr 333 m 3 /hr 125 m 3 /hr () 1% LESS 1-Aug Aug Aug Aug Aug Aug Aug Aug Aug Aug Aug Aug Aug Aug Aug Aug Aug Aug Aug Aug Aug Aug Aug Aug Aug Aug Aug Aug Aug Aug Aug Total Maximum Minimum Average M31-63
18 Table M Flow Rate of Opa Water Treatment Plant in 23 (5/6) MONTH : September-3 DATE VT 648 m 3 /hr 864 m 3 /hr Total 473 m 3 /hr 333 m 3 /hr 125 m 3 /hr () 1% LESS 1-Sep Sep Sep Sep Sep Sep Sep Sep Sep Sep Sep Sep Sep Sep Sep Sep Sep Sep Sep Sep Sep Sep Sep Sep Sep Sep Sep Sep Sep Sep Total Maximum Minimum Average MONTH : October-3 DATE VT 648 m 3 /hr 864 m 3 /hr Total 473 m 3 /hr 333 m 3 /hr 125 m 3 /hr () 1% LESS 1-Oct Oct Oct Oct Oct Oct Oct Oct Oct Oct Oct Oct Oct Oct Oct Oct Oct Oct Oct Oct Oct Oct Oct Oct Oct Oct Oct Oct Oct Oct Oct Total Maximum Minimum Average M31-64
19 Table M Flow Rate of Opa Water Treatment Plant in 23 (6/6) MONTH : November-3 DATE VT 648 m 3 /hr 864 m 3 /hr Total 473 m 3 /hr 333 m 3 /hr 125 m 3 /hr () 1% LESS 1-Nov Nov Nov Nov Nov Nov Nov Nov Nov Nov Nov Nov Nov Nov Nov Nov Nov Nov Nov Nov Nov Nov Nov Nov Nov Nov Nov Nov Nov Nov Total Maximum Minimum Average MONTH : December-3 DATE VT 648 m 3 /hr 864 m 3 /hr Total 473 m 3 /hr 333 m 3 /hr 125 m 3 /hr () 1% LESS 1-Dec Dec Dec Dec Dec Dec Dec Dec Dec Dec Dec Dec Dec Dec Dec Dec Dec Dec Dec Dec Dec Dec Dec Dec Dec Dec Dec Dec Dec Dec Dec Total Maximum Minimum Average M31-65
20 Intake and Transmission Flow Rate in 23 Max. Intake Max. Transmission Ave. Intake Ave. Transmission Max () Ave (). Jan. Feb. Mar. Apr. May Jun. Jul. Aug. Sep. Oct. Nov. Dec. Month. Figure M Flow Rate of Opa Water Treatment Plant in 23 M31-66
21 Table M Flow Rate of Opa Water Treatment Plant in 24 (1/5) DATE MONTH : Jan VT 648 m 3 /hr 864 m 3 /hr 473 m 3 /hr 333 m 3 /hr 125 m 3 /hr Total () 1% LESS 1-Jan Jan Jan Jan Jan Jan Jan Jan Jan Jan Jan Jan Jan Jan Jan Jan Jan Jan Jan Jan Jan Jan Jan Jan Jan Jan Jan Jan Jan Jan Jan Total Average Average raw water pumped per day : Average clear water pumped per day : DATE MONTH : Feb VT 648 m 3 /hr 864 m 3 /hr 473 m 3 /hr 333 m 3 /hr 125 m 3 /hr 1% LESS 1-Feb Feb Feb Feb Feb Feb Feb Feb Feb Feb Feb Feb Feb Feb Feb Feb Feb Feb Feb Feb Feb Feb Feb Feb Feb Feb Feb Feb Feb Total Average Average raw water pumped per day : Average clear water pumped per day : M31-67
22 Table M Flow Rate of Opa Water Treatment Plant in 24 (2/5) DATE MONTH : March VT 648 m 3 /hr 864 m 3 /hr Total 473 m 3 /hr 333 m 3 /hr 125 m 3 /hr () 1% LESS 1-Mar Mar Mar Mar Mar Mar Mar Mar Mar Mar Mar Mar Mar Mar Mar Mar Mar Mar Mar Mar Mar Mar Mar Mar Mar Mar Mar Mar Mar Mar Mar Total Average Average raw water pumped per day : Average clear water pumped per day : MONTH : April-4 DATE VT 648 m 3 /hr 864 m 3 /hr Total 473 m 3 /hr 333 m 3 /hr 125 m 3 /hr () 1% LESS 1-Apr Apr Apr Apr Apr Apr Apr Apr Apr Apr Apr Apr Apr Apr Apr Apr Apr Apr Apr Apr Apr Apr Apr Apr Apr Apr Apr Apr Apr Apr Total Average Average raw water pumped per day : Average clear water pumped per day : M31-68
23 Table M Flow Rate of Opa Water Treatment Plant in 24 (3/5) MONTH : May-4 DATE VT 648 m 3 /hr 864 m 3 /hr Total 473 m 3 /hr 333 m 3 /hr 125 m 3 /hr () 1% LESS 1-May May May May May May May May May May May May May May May May May May May May May May May May May May May May May May May Total Average Average raw water pumped per day : Average clear water pumped per day : DATE MONTH : June VT 648 m 3 /hr 864 m 3 /hr Total 473 m 3 /hr 333 m 3 /hr 125 m 3 /hr () 1% LESS 1-Jun Jun Jun Jun Jun Jun Jun Jun Jun Jun Jun Jun Jun Jun Jun Jun Jun Jun Jun Jun Jun Jun Jun Jun Jun Jun Jun Jun Jun Jun Total Average Average raw water pumped per day : Average clear water pumped per day : M31-69
24 Table M Flow Rate of Opa Water Treatment Plant in 24 (4/5) DATE MONTH : JULY VT 648 m 3 /hr 864 m 3 /hr Total 473 m 3 /hr 333 m 3 /hr 125 m 3 /hr () 1% LESS 1-Jul Jul Jul Jul Jul Jul Jul Jul Jul Jul Jul Jul Jul Jul Jul Jul Jul Jul Jul Jul Jul Jul Jul Jul Jul Jul Jul Jul Jul Jul Jul Total Average Average raw water pumped per day : Average clear water pumped per day : DATE MONTH : AUG VT 648 m 3 /hr 864 m 3 /hr Total 473 m 3 /hr 333 m 3 /hr 125 m 3 /hr () 1% LESS 1-Aug Aug Aug Aug Aug Aug Aug Aug Aug Aug Aug Aug Aug Aug Aug Aug Aug Aug Aug Aug Aug Aug Aug Aug Aug Aug Aug Aug Aug Aug Aug Total Average Average raw water pumped per day : Average clear water pumped per day : M31-7
25 Table M Flow Rate of Opa Water Treatment Plant in 24 (5/5) DATE MONTH : VT 648 m 3 /hr 864 m 3 /hr Total () 473 m 3 /hr 333 m 3 /hr 125 m 3 /hr 1% LESS 1-Sep Sep Sep Sep Sep Sep Sep Sep Sep Sep Sep Sep Sep Sep Sep Sep Sep Sep Sep Sep Sep Sep Sep Sep Sep Sep Sep Sep Sep Sep Total Average Average raw water pumped per day : Average clear water pumped per day : M31-71
26 Table M Monthly Water Quality of Opa WTP (Curti 72) Analysed by PWD's Laboratory from January 23 to May 25 (1/2) Color Odor Taste Turbidity ph Specific Conductivity Total Solids (NTU) ( /u mhos/cm) (mg/l) Raw Filtered Treated Raw Filtered Treated Raw Filtered Treated Raw Filtered Treated Raw Filtered Treated Raw Filtered Treated Raw Filtered Treated Jan-3 U Feb n Mar Apr-3 o May-3 b Jun-3 5 j Jul-3 1 e Aug-3 5 c Sep-3 5 t Oct-3 a Nov-3 b Dec-3 l Jan e Feb Mar Apr May Jun Jul Aug Oct Nov Dec Jan Feb Mar Apr May Max Min Ave Total Dissolved Solids(TDS) Suspended Solids Total Hardness as CaCO 3 Cl - Total Alkalinity as CaCO 3 (TA Ca Mg (mg/l) (mg/l) (mg/l) (mg/l) (mg/l) (mg/l) (mg/l) Raw Filtered Treated Raw Filtered Treated Raw Filtered Treated Raw Filtered Treated Raw Filtered Treated Raw Filtered Treated Raw Filtered Treated Jan Feb Mar Apr May Jun Jul Aug Sep Oct Nov Dec Jan Feb Mar Apr May Jun Jul Aug Oct Nov Dec Jan Feb Mar Apr May Max Min Ave M31-72
27 Table M Monthly Water Quality of Opa WTP (Curti 72) Analysed by PWD's Laboratory from January 23 to May 25 (2/2) - SO 4 Fe 2+ Mn NO 3 KMnO 4 oxidizability as O 2 BOD at 27 and 3days DO (mg/l) (mg/l) (mg/l) (mg/l) (mg/l) (mg/l) (mg/l) Raw Filtered Treated Raw Filtered Treated Raw Filtered Treated Raw Filtered Treated Raw Filtered Treated Raw Filtered Treated Raw Filtered Treated Jan Feb Mar Apr May Jun Jul Aug Sep Oct Nov Dec Jan Feb Mar Apr May Jun Jul Aug Oct Nov Dec Jan Feb Mar Apr May Max Min Ave F - Al 3+ Plate Count on nutrient agar MPN of Coliform MPN of E.Coli. (mg/l) (mg/l) no/1ml no/1ml no/1ml Raw Filtered Treated Raw Filtered Treated Raw Filtered Treated Raw Filtered Treated Raw Filtered Treated Jan Feb , Mar , Apr , May , Jun ,4 1, Jul , Aug , Sep ,6 46 1,1 93 Oct ,4 46 1,1 24 Nov , Dec , Jan , Feb Mar , Apr , May , Jun ,4 46 1,1 43 Jul ,6 24 2,4 93 Aug ,6 24 1, ,4 1, Oct ,6 24 1,1 43 Nov , Dec ,6 43 2,4 9 Jan , Feb ,4 75 1,1 43 Mar , Apr , May , Max ,6 1,1 2,4 24 Min Ave , M31-73
28 Color Turbidity Total Solids Jan-3 Jan-3 Color, Pt/Co Color scale May-3 May-3 Sep-3 Jan-4 May-4 Jan-5 May-5 Total Solids, mg/l Jan-3 May-3 Sep-3 Jan-4 May ph Turbidity,NTU Jan-3 Jan-3 May-3 May-3 Sep-3 Sep-3 Jan-4 Jan-4 May-4 Jan-5 May-5 Jan-3 Jan-3 May-3 May-3 Sep-3 Sep-3 Jan-4 Jan-4 May-4 Jan-5 May-5 ph Specific Conductivity 2 6 Total Dissolved Solids (TDS) Jan-3 Specific Conductivity, /u mhos/cm May-3 Sep-3 Jan-4 May-4 Jan-5 May-5 Jan-5 May-5 Jan-3 May-3 Sep-3 Jan-4 May-4 Jan-5 May-5 TDS, mg/l Suspended Solids Total Hardness as CaCO CaCo3 3 Ca Jan-3 Jan-3 Suspended Solids, mg/l May-3 May-3 Sep-3 Sep-3 Jan-4 Jan-4 May-4 Jan-5 May-5 Total Hardness, mg/l Jan-3 Jan-3 May-3 May-3 Sep-3 Sep-3 Jan-4 Jan-4 May-4 Jan-5 May-5 Jan-3 May-3 Sep-3 Jan-4 May-4 Jan-5 May-5 Ca 2+, mg/l Mg Cl Total Alkalinity (TALK) Jan-3 Mg 2+, mg/l May-3 Sep-3 Jan-4 May-4 Jan-5 May-5 Cl -, mg/l Jan-3 May-3 Sep-3 Jan-4 May-4 Jan-5 May-5 Jan-3 Jan-3 May-3 May-3 Sep-3 Sep-3 Jan-4 Jan-4 May-4 Jan-5 May-5 TALK, mg/l as CaCO Raw Filtered Treated Acceptable Cause for Raw Filtered Treated Acceptable Cause for Rejection Figure M Monthly Water Quality of Opa WTP (Curti 72) Analysed by PWD's Laboratory from January 23 to May 25 (1/2) M31-74
29 SO Fe 2+ Mn SO42-, mg/l Jan-3 May-3 Sep-3 Jan-4 May-4 Jan-5 May-5 Jan-3 Jan-3 Fe 2+ 2+,, mg/l May-3 May-3 Sep-3 Sep-3 Jan-4 Jan-4 May-4 May-4 Jan-5 Jan-5 May-5 Jan-3 May-3 Sep-3 Jan-4 May-4 Jan-5 May-5 Mn 2+ 2+,, mg/l NO KMnO 4 oxidizability day BOD at NO32-, mg/l Jan-3 Jan-3 May-3 May-3 Sep-3 Sep-3 Jan-4 Jan-4 May-4 Jan-5 May-5 Jan-3 KMnO4 oxidizabilty, mg/l as O2 May-3 Sep-3 Jan-4 May-4 Jan-5 May-5 Jan-3 Jan-3 May-3 May-3 Sep-3 Jan-4 May-4 Jan-5 May-5 BOD, mg/l DO F - Al OD, mg/l Jan-3 May-3 Sep-3 Jan-4 May-4 Jan-5 May-5 Jan-3 F -, mg/l May-3 Sep-3 Jan-4 May-4 Jan-5 May-5 Jan-3 Jan-3 May-3 May-3 Sep-3 Sep-3 Jan-4 May-4 Jan-5 May-5 Al 3-3+, mg/l Plate Count on Nutrient agar at 37,24hrs, /ml MPN of Coliform, /1 ml MPN of E.Coli., /1 ml Plate Count, /ml Jan-3 May-3 Sep-3 Jan-4 May-4 Jan-5 May-5 Jan-3 MPN of Coliform, /1 ml May-3 Sep-3 Jan-4 May-4 Jan-5 May-5 Jan-3 May-3 Sep-3 Jan-4 May-4 Jan-5 May-5 MPN of E.Coli., /1 ml Raw Filtered Treated Acceptable Cause for Reject Raw Filtered Treated Acceptable Cause for Rejection Figure M Monthly Water Quality of Opa WTP (Curti 72) Analysed by PWD's Laboratory from January 23 to May 25 (2/2) M31-75
30 Table M Records on Power Interruption at Opa WTP in 24 Year 24 Ave. 4.4 Max. 35. Min. 1. Unit: min. Date Jan. Feb. Mar. Apr. May Jun. Jul. Aug. Sep. Oct. Nov. Dec Total (min./month) Ave. (min./day) Max. (min./day) Min. (min./day) Note: Average interruption period means the interruption minutes per day per month. Fluctuation of Power Interruption Total (min./month) Max. (min./day) Ave. (min./day) min./month Jan. Feb. Mar. Apr. May Jun. Jul. Aug. Sep. Oct. Nov. Dec. Month min./day M31-76
31 Table M List of Reservoirs for the Opa Water Supply Scheme (1/3) Series No. System Tapping Main Name of GLR / OHR / Sump Dia. Type Capacity Material (Name of Location) (mm) (m3) RL HWL LWL Taluka Village Name O- 1 Opa WTP Opa 8 GLR 175 O- 2 Opa 12 GLR 1,35 Sub-Total 1,525 C- 1 Curti 72 GLR 3, Curti MBR C- 2 GLR 3, C- 3 GLR 3, C- 4 Opa 8 & 12 GLR C- 5 GLR C- 6 GLR C- 7 GLR C- 8 Curti 4 GLR 5, C- 9 GLR 5, Sub-Total 22,29 W- 1 2 CIP Marwaswada GLR Ponda Usgao(13) White Line GLR/OHR/Sump Elevation (m) Bicholim Pale(26) Supply Area W- 2 1 CIP Khandepar GLR Ponda Vagurbem(11), Candepar(14) W- 3 2 CIP Prabhunagar GLR ditto- Betora(22), Curti(CT)(32) W- 4 8 CIP St. Mary Convent, Ponda GLR ditto- Ponda(MCI)(31), Curti(CT)(32) 2 CIP W CIP Bethoda GLR ditto- Betora(22), Curti(CT)(32), Ponda(MCI)(31) W- 6 2 CIP Shanti Nagar, Ponda GLR ditto- Ponda(MCI)(31) W CIP Upper Tank, Forest Dept. GLR ditto- Queula(3), Durbhat(19), Telaulim(2), Vadi(21), Ponda(MCI)(31) Remarks W CIP Middle Tank, Forest Dept. GLR ditto- Queula(3), Bandora(CT)(29) W- 9 8 CIP Lower Tank, Forest Dept. Sump ditto- Ponda(MCI)(31) W CIP Khandpaband GLR ditto- Ponda(MCI)(31) GL=82. W CIP GLR ditto- Ponda(MCI)(31), Queula(3), Bandora(CT)(29) W DIP Kashi Matt GLR ditto- Bandora(CT)(29) W DIP Fermagudi GLR ditto- Bandora(CT)(29), Queula(CT)(3) GL=11. W DIP Borim Baithakol GLR ditto- Borim(26), Queula(CT)(3) W DIP Borim Paniwada (1991) GLR ditto- Borim(26) W CIP Borim Paniwada (1975) GLR ditto- Borim(26) W DIP Shiroda (2) GLR ditto- Siroda(27) W DIP Shiroda (198) GLR ditto- Siroda(27) W CIP Curti (Middle Quarter) GLR ditto- Codar(23), Canddepar(14) Sub-Total 9,35 R- 1 Red Line 15 CIP Keriyem GLR Ponda Candepar(14), Usgao(13), Vagurbem(11) R- 2 2 CIP Usago GLR ditto- Usgao(13), Sanguem Piliem(1) R- 3 2 CIP Near MRF Factory OHR Ponda Usgao(13), R CIP Usago Forest Area OHR ditto- Usgao(13), GL=63., Not in use R CIP Curti GLR ditto- Curti(32) R CIP Apewal (1991) GLR ditto- Priol(15), Querim(1) w/pump-1unit 3hrs/d R CIP Military Ponda GLR ditto- Curti(32) R CIP Bhoot Khamb Keri GLR ditto- Querim(1), Savoi-Verem(6) GL=156. R- 9 2 DIP Ganga Nagar Ponda (1999) GLR ditto- Curti(32) R- 1 1 CIP Simepain GLR ditto- Velinga(16) R CIP Madkai GLR ditto- Marcaim(18) 225 HDPE R CIP Mardol GLR ditto- Priol(15), Velinga(16) R CIP Kundaim Near IDC Gate GLR ditto- Cundaim(17), Cuncoliem(9), Boma(8) M31-77
32 Table M List of Reservoirs for the Opa Water Supply Scheme (2/3) Series No. System Tapping Main Name of GLR / OHR / Sump Dia. Type Capacity Material (Name of Location) GLR/OHR/Sump Elevation (m) (mm) (m3) RL HWL LWL Taluka Village Name R- 14 Red Line 15 CIP Kundaim Near Kundil GLR ditto- Boma(8):Industry R CIP Voila Wada Sump ditto- Boma(8):Industry GL=67. R CIP Adcona Sump ditto- Adcolna(7) R CIP Tivrem GLR ditto- Tivrem(3), Orgao(2) R CIP Wadiwada Betqui GLR ditto- Betqui(4), Candola(1) R- 19 Sump ditto- Betqui(4) w/pump-1unit 5hrs/d R CIP Betqui Near Health Center Sump ditto- Betqui(4) GL=87. R CIP Betqui GLR ditto- Betqui(4) GL=58. R CIP Marcel (1975) GLR ditto- Tivrem(3) R CIP Cumbharjua (1992) OHR Tiswadi Cumbarjua(1), Gandaulim(11) R ACP St. Estavam (199) GLR ditto- Jua(9) R CIP Ameywada (1975) GLR Ponda Candola(1) R CIP Corlim GLR Tiswadi Corlim(12) R CIP Carambolim (24) GLR ditto- Carambolim(17) R CIP Mallar - Diwar GLR ditto- Navelim(5), Goltim(6), Malar(7), Naroa(8) R CIP St. Mathais Diwar GLR ditto- Navelim(5), Goltim(6), Malar(7), Naroa(8) GL=5., Not in use R- 3 1 ACP Carambolim Peth GLR ditto- Carambolim(17) R ACP Dongri Neura GLR ditto- Neura-O-Pequeno(24), Neura-O-Grande(25) R ACP Mandur (1975) GLR ditto- Azossim(18), Mandur(19) R ACP Pillar GLR ditto- Supply Area Azossim(18), Neura-O-Pequeno(24), Neura-O-Grande(25), Mercurim(26), Goa Velha(37) R CIP Old Goa (1985) GLR ditto- Gandaulim(11), Ella(13), Bainguinim(14) R CIP Old Goa (1965) GLR ditto- Not in Use R CIP Riabandar (1975) GLR ditto- Panelim (OG)-Ward(29) R CIP Riabandar (1994) GLR ditto- Panelim (OG)-Ward(29) R CIP Riabandar OHR ditto- Panelim (OG)-Ward(29) R CIP Chimbel GLR ditto- Chimbel(CT)(27) R CIP Merces GLR ditto- Morambi-O-Grande(Merces)(OG)(3), Renovadi(OG)-Ward No. 19(31), w/pump-1unit 8hrs/d Morambi-O-Pequeno(Merces)(OG)-Ward No.2(32) Sub-Total 11,497 Remarks M31-78
33 Table M List of Reservoirs for the Opa Water Supply Scheme (3/3) Series No. System Tapping Main Name of GLR / OHR / Sump Dia. Type Capacity Material (Name of Location) (mm) (m3) RL HWL LWL Taluka Village Name G CIP Fermagudi GLR Ponda Bandora(CT)(29), Queula(CT)(3) G CIP GLR ditto- Bandora(CT)(29) w/pump-1unit 4hrs/d G- 3 4 CIP Bambolim GLR Tiswadi Cujira(OG)-Ward No.21(33), Murda(OG)-Ward(34), Calapor(CT)(35), G- 4 4 CIP GLR ditto- Bambolim(CT)(36) w/pump-1unit 8hrs/d G CIP GMC Complex, Bambolim OHR ditto- Bambolim(CT)(36) G- 6 Curca GLR ditto- Curca(22) G CIP Siridao GLR ditto- Siridao(23), Goa Velha(CT)(37) G- 8 5 CIP Taligao GLR ditto- G- 9 5 CIP GLR ditto- w/pump-1unit 2hrs/d G- 1 5 CIP OHR ditto- G CIP Nagali Sump ditto- w/pump G- 12 OHR ditto- G CIP Altinho (196) - R6 OHR ditto- G- 14 Altinho - R1 GLR ditto- w/pump Pumping to OHR G- 15 Altinho - R2 GLR ditto- G- 16 Altinho - R3 GLR ditto- w/pump G- 17 Altinho - R4 GLR ditto- G- 18 Altinho - R5 GLR ditto- G- 19 Altinho - R7 OHR ditto- G- 2 Altinho - R8 GLR 5, ditto- G- 21 CABO (Ras Bhavan) GLR ditto- Sub-Total 15,8 91 Total 6,462 Retention Time 11. hrs Note: Green Line GLR/OHR/Sump Elevation (m) Panaji(M C+OG)(28) Supply Area Remarks Pumping to OHR RL=Reduced Level, GL=Ground Level, HWL=High Water Level in Reservoir, LWL=Low Water Level in Reservoir, GLR=Ground Level Reservoir, OHR=Over Head Reservoir, Sump=Pumping Suction Well, MBR=Master Balancing Reservoir M31-79
34 M31.3 Chandel Water Supply Scheme The Chandel facility consists of a 15 plant commissioned in 22. Raw water is sourced from the Kalana River which is pumped approximately 15m to the plant. The site contains a clear water sump from which water is pumped to the MBR approximately 8m away for onward gravity feed to the distribution system. We understand that prior to commissioning of the plant, a number of rural water supply schemes were in operation and the networks for these schemes are now interconnected with the Chandel plant. We understand that the rural schemes serve to augment the regional scheme at peak demand times. Table M lists the summary of asset data for the WTP and Table M contains detailed asset data for the WTP. The plant schematic is shown on Figure M The raw water pump house and treatment plant are located in separate compounds. The study team found these compounds to be adequately gated, fenced and secured by 24 hour on-site security personnel. The plant is manually operated. The plant operates 24 hours a day, and using a three shift system. The distribution network currently needs to be enhanced, therefore the plant operates at only 8.5. Raw water supplied to the plant is measured at the par shall flume. This flume has a working flow measuring device. Flow measurement devices are not installed at the MBR or beyond. Therefore, transmission via the clean water reservoirs is estimated based on pump design capacities and hours of operation. The raw water pump house has four pumps (two duty) each with a capacity of 2 l/s. Maintenance standards are good and the drive couplings/shafts are well guarded. Maintenance is generally reactive, except for regular oiling and greasing. There is no operation and maintenance manual (although some equipment catalogues are available) and training for new staff is only provided on the job by existing experienced staff. There are no written or formal safety systems for plant operation. The treatment plant is controlled manually. Most equipment appears to be in good working order, except for the alum and lime mixers. The lime mixers were not functioning at the time of the site visit, which meant lime was added by hand at the flash mixer point. Generally, good maintenance standards are evident and the water pumps are well guarding. Currently there are no logs maintained at the plant. M31-8
35 The plant does not have an on-site laboratory, although equipment for measuring residual chlorine and ph levels is available. Residual chlorine and ph are measured hourly by the plant operators to inform the process control, however records of the measurements are not kept. Staff from the Panaji laboratory visit the site and take samples for analysis once a week. Gas chlorination is used to disinfect the water. Chlorination is achieved using one tonne cylinders. Normally there is one cylinder in the chlorine house at any one time. There is only one vacuum type chlorinator, meaning there are no standby chlorinators. The study team was advised that another chlorinator will be installed. Maintenance of the chlorinator is undertaken in-house, but periodic calibration is not undertaken and no maintenance records are kept. No spare parts for the chlorine facility are kept on-site. Maintenance, installation standards and operation practices for chlorination are poor. Ammonia solution is used to detect leaks from the pipes and the connection joints. The only facility to detect or contain gas leaks is an immersion tank, however it is not easily accessible during an emergency. The feeder pipe to the contact tanks is made of poor quality flexible plastic hose and it is unprotected. This is not safe and should be rectified immediately. Personal breathing apparatus is not provided and staff are not aware of the safety procedures / measures required during the chlorination process. Table M and Figures M show the data on monthly water quality at Chandel Water Treatment Plant. Table M shows a list of existing reservoirs for Chandel Water Supply Scheme. M31-81
36 Table M Summary of Asset Register of Chandel Water Treatment Plant Raw Intake & Raw Water Transmission Facility Treatment Facility Clear Facility Name of Facility Contents of Facility Remarks Water Jack Well & D 9. m H 21.m Kalana River Connecting Pipe D6mm CIP 1.m 1 Line Pump & Motor Vertical Turbine Self Water Lubricated Pump: Q 417.6m 3 /hr H 28.m 45kw 4 units (2 Standby) Water Raw Water Transmission Main Aerator Parshal Flume & Flash Mixer Clarifloccculator Filter Clear Reservoir Water D4mm 157m CIP 1 Line Cascade Type: 1 unit Each 1 unit (for Chemical Dosing) Circular Horizontal Flow Type with Center Feed/Peripheral Collection Flocculation & Clarifier: D 32.m (Flocc. Zone 12.m) WD 4.m 1 units Detention Period: Flocculation 34.7min Clarifier 3.5hrs 1) Surface Loading for Clarifier: 27 m 3 /m 2 /d (18.8 mm/min) 2) Gravity Rapid Sand Filter Type W 4.35m L 9.m 4 basins Effective Size of Sand:.45~.6mm, Depth of Sand:.6~.7m Filter Area: 19.6 m 2 /cell, 39.2 m 2 /basin Filtration Rate: 5. m/hr 3) (12 m/d) Air Scouring Rate:??m/hr/cell 4) (.??m 3 /min/m 2 /cell) Backwash Rate: 1.2m/hr/cell 5) (.17m 3 /min/m 2 /cell) W 2.5m L 13.m WD 3.m 1 unit Total Volume=8 m 3 Retention Time: 1.3 hr Dry Aluminum Sulfate Solution Tank: 2 units Powder Lime Solution Tank: 2 units Liquid Chlorine (1 tone Container net 9kg) Design Cap. of Intake Pump = 2 1): 2~2.5 hrs 2): 3~4m 3 /m 2 /d Chemical Alum Feeding Feeding Facility Facility Lime Feeding Facility Disinfection Facility Chlorinator: 2 units Laboratory Frequency of Not In-Service, Jar Test: Not in Service Sampling & Daily test: ph, Turbidity, R-Cl Analysis Clear Water Transmission Pump Horizontal Centrifugal Pump: Transmission & Motor Q 36m 3 /hr H 115m 179kw 4 units (2 Standby) Facility Rising Main D4mm DIP 775m 1 Line Clear Water W 2.m L 2.m WD 4.m 1 unit Reservoir (MBR) Total Volume=1,6 m 3 Note: 1) ~ 4) are referring to Manual on Water Supply and Treatment, Third Edition Revised and Updated, May 1999 Based on Specifications of Air Blower & Backwash Pump 3): 4.8~6.m/hr 4): 36~54m/hr 5): 24~36m/hr Design Cap. of Pump = 17 M31-82
37 Figure M Schematic Sequence of Chandel Water Treatment Plant M31-83
38 Table M Present Conditions of Chandel Water Treatment Plant (1/5) Item Background Covered Area for Water Supply Name of Plant Taluka Pernem Chandel W.T.P. Number of W.T.P. Number (1) Capacity of Plant 15 m 3 /d 15, Raw Water Resources River Kalana Dam Year of Construction Year Year of Commission Expected Augmentation Year Plan (Tillari Irrigation Project) Contents Remarks Name of Facility Contents of Facility Remarks Capacity of Raw Water Intake & Water Treatment Plant Head Water Works : Raw Water Intake Intake Well Connecting Pipe Jack Well & Pump House Control Room Raw Water Pump Raw Water Motor Raw Water Transmission Line m 3 /d 18,75 Diameter m 6. Height m 5. Water Depth m? Volume m 3 /unit. Water Level of River H.W.L. m? L.W.L m? Diameter mm 6 Length m 1. Material CIP Velocity m/sec.768 Loss of Head m.13 : Hazen-Williams Formula Diameter m 9. Height m 21. Water Depth m? Volume m 3 /unit Detension Time min. Width m 6. Length m 6. Area of Floor m Capacity l/sec 116 m 3 /min 6.96 m 3 /hr m 3 /d 1,22 Number unit 4 Stand-by unit 2 Total Capacity m 3 /d 2, OK Head Maker m 28. WPIL Ltd. Year of Manufacture 22 Assessment of Condition Working Motor Output HP 6 kw 45 Number Unit 4 Maker Kirlosker Year of Manufacture 22 Assessment of Condition Working Diameter mm 4 Length m 157 Material CIP "B" Velocity m/sec.543 Loss of Head m : Hazen-Williams Formula Assessment of Condition Pipe Valve Good Good : 25% Losses of Nominal Capacity M31-84
39 Table M Present Conditions of Chandel Water Treatment Plant (2/5) Water Treatment Plant Aerator Capacity m 3 /hr : Answer to Questionnare m 3 /d 18,75 15, Number Unit 1 Diameter m 9. Height m? El. of Top Aerator m? Assessment of Condition Good Parshal Flume Number Unit 1 / Weir Assessment of Condition Good Flash Mixer Number Unit 1 Clarifiers / Settling Tank (Coagulation Basin) Flocculator & Drive Arrangement Filter Filter Washing Criteria & Method Item Assessment of Condition Good Dsign Capacity m 3 /min/unit 13. m 3 /hr/unit m 3 /d/unit 18,75 Number Unit 1 Water Depth m 4. Overall Diameter m 32. Flocc. Zone Dia. m 12. Frequency of Desludging General Season: 1 Time/48 hrs Monsoon Season: 1 Time/24 hrs Volume Overall m 3 /unit 3,217. Flocculation Zone m 3 /unit Clarifying Zone m 3 /unit 2,764.6 Retention Time Flocculation Zone min 34.7 OK Clarifying Zone min OK Overall min Surface Area m 2 /unit Surface Loading mm/min 18.8 Ok W.L. of Clarifier m? Assessment of Condition Working Condition Number unit 1 Assessment of Condition Working Condition Design Capacity m 3 /hr/unit m 3 /d/unit 4,687.5 Number Unit 4 Contents Type Rapid Sand Gravity Filter Width m 4.35 Length m 9. Height m? Water Depth m 2.15 Filtered Area m 2 /unit 39.2 Velocity Filter Media m 3 /d/m OK Standard Size E.S. of Sand mm.45~.6 : E.S. = Effective Size Depth of Sand mm 6~7 : U. C. E. = 1.3~1.7 Type of Underdrain System CIP with Header Tee Year Replacement of Media No Replacement Water Level of Filter m? Assessment of Condition Working Condition Air Scouring Rate m 3 /min/m 2 Air Scouring Time Backwash Rate min m 3 /min/m NO Backwashing Time min 15~2 Frequency of Washing General : 1 Time/72 hrs Maximum : 1 Time/24 hrs Remarks M31-85
40 Table M Present Conditions of Chandel Water Treatment Plant (3/5) Name of Facility Contents of Facility Remarks Backwash Pump & Motor Air Blower Clear Water Reservoir (Sump) Chemical Facility Alum Feeding Facility Lime Feeding Facility Disinfection System Capacity m 3 /min 6.71 m 3 /hr Number unit 2 Stand-by unit 1 Total Capacity m 3 /min 6.71 Head Type of Pump m 12. Centrifugal Motor Output HP 1 kw 75 Assessment of Condition Working Capacity m 3 /min m 3 /hr m 3 /d Number unit Stand-by Total Capacity unit m 3 /min m 3 /d Head Motor Output mm WG HP 4. kw 3. Assessment of Condition Working Width m 2.5 Length m 13. Water Depth m 3. Number Unit 1 Volume m 3 8 Total m 3 8 Detention Time hr 1.3 Last Date of Cleaning Pediodical Water Level 12.7 m 1. Assessment of Condition Working Capacity kg/hr m 3 /unit 9.2 Diameter m : + T.C.L. Tank 8 m3? Width m Length m Height m Volume m 3 Number 2 Unit Stand-by Assessment of Condition Working Capacity kg/hr m 3 /unit 27. Diameter m : + T.C.L. Tank 8 m3? Width m Length m Height m Volume m 3 Number 4 Unit Stand-by Assessment of Condition Working Chemical Used Liquid Chlorine Type of Plant & Machinery Vaccum Type : Pnwatt? Capacity kg/hr Number 2 Unit Stand-by Safty Measures Taken - Commissioned Assessment of Condition 22 Working M31-86
41 Table M Present Conditions of Chandel Water Treatment Plant (4/5) Name of Facility Contents of Facility Remarks Laboratory Chemical Testing Laboratory Not in-service? Jar Testing - Availability of Skilled Chemists - Availability of Required Chemicals From Assonora Store :? month store Use of Test Reports Frequency of Sampling & Analysis As per Format 2 Parameters Tests Fortnightly Daily Test: Turb., ph, R-CL General Quality of Water Treatable with Water Treatment Process Raw Water Quality Turbid., Low ph Clear Water Quality Excellent Transformers Number of Transformer (1) (2) Pole Mounted / Pad Mounted Floor Floor Capacity kva Number Standby Commissioned Unit Likely Design Life Year 3 3 Last Replacement - - Assessment of Condition Good Good Equipment Status Flow Meters Other Operating Valves No Flow Meters Working Other Important Assets Valve's Condition Working Condition Visible Leakage and Locations Building Condition Good Wastewater Disposal Arrangements Sludge Chamber with Disposal Transmission (Clear Water) Facility Transmission (Clear Water) Pump Capacity l/sec 1 m 3 /min 6. m 3 /hr 36. m 3 /d 8,64 Number 4 Stand-by unit 2 Total Capacity m 3 /d 17, Head m 115. Type of Pump Maker Vertical Kirlosker Year of Manufacture 22 Assessment of Pump Working Condition Condition Valve Working Condition Transmission Motor Output HP 24 (Clear Water) kw 179 Motor Number Unit 4 Maker Crompton Year of Manufacture 22 Assessment of Condition Working Condition Raising Main Diameter mm 4 (Transmission Length m 775 Lines) Material DIP (K-9) Velocity m/sec Loss of Head m : Hazen-Williams Formula Assessment of Pipe Working Condition Valve Working M31-87
42 Table M Present Conditions of Chandel Water Treatment Plant (5/5) Name of Facility Contents of Facility Remarks Master Balancing Reservoir (M.B.R.) Width m 2. Length m 2. Water Depth m 4. Number Unit 1 Volume m 3 1,6 Total m 3 1,6 Detention Time hr 2.6 Last Date of Cleaning Pediodical Water Level 14. : Inlet m 1. Assessment of Condition Working Present Condition of Chandel Water Treatment Plant N.3 Organization & Staff Deployed General Shift Working Hour : 5: 19: (12: : Lunch Time) Night Duty : 16: ~ 9: : 8 Persons Shift in Plant Shifting System 2 Shifting System Covering 24 Hours Operation Working Hour : 1: 8: 2:, 2: 2: 8: Staff Deployed at the Plant Person Qualification Year of Service Service at plant Management Staff - Engineers Assistant Engineer 1 M.E.(P.H.E.) 2 2 Sub-total 1 Skilled Staff - Operators / Quality Testing Mechanics 2 I.T.I. 2 2 Electrician 2 I.T.I. 2 2 Operator 8 I.T.I. 2 2 Sub-total 12 Unskilled Staff 17 - Helper, Sweeper, Security Guards Total Number 3 M31-88
43 Table M Monthly Water Qaulity of Chandel Water Treatment Plant Analysed by PWD s Laboratory from January 23 to May 25 (1/2) Color Odor Taste Turbidity ph Specific Conductivity (NTU) ( /u mhos/cm) Raw Filtered Treated Raw Filtered Treated Raw Filtered Treated Raw Filtered Treated Raw Filtered Treated Raw Filtered Treated Jan Feb Mar Apr May Jun Jul Aug Sep Oct Nov Dec Jan Feb Mar Apr May Jun Jul Aug Oct Nov Dec Jan Feb Mar Apr May Max Min Average Total Solids Total Dissolved Solids Total Hardness as CaCO Suspended Solids 3 (TDS) (TALK) Ca 2+ Mg 2+ (mg/l) (mg/l) (mg/l) (mg/l) (mg/l) (mg/l) Raw Filtered Treated Raw Filtered Treated Raw Filtered Treated Raw Filtered Treated Raw Filtered Treated Raw Filtered Treated Jan Feb Mar Apr May Jun Jul Aug Sep Oct Nov Dec Jan Feb Mar Apr May Jun Jul Aug Oct Nov Dec Jan Feb Mar Apr May Max Min Average M31-89
44 Table M Monthly Water Qaulity of Chandel Water Treatment Plant Analysed by PWD s Laboratory from January 23 to May 25 (2/2) Cl - Total Alkalinity as CaCO 3 - SO 4 Fe 2+ Mn NO 3 KMnO 4 oxidizability as O 2 (mg/l) (mg/l) (mg/l) (mg/l) (mg/l) (mg/l) (mg/l) Raw Filtered Treated Raw Filtered Treated Raw Filtered Treated Raw Filtered Treated Raw Filtered Treated Raw Filtered Treated Raw Filtered Treated Jan Feb Mar Apr May Jun Jul Aug Sep Oct Nov Dec Jan Feb Mar Apr May Jun Jul Aug Oct Nov Dec Jan Feb Mar Apr May Max Min Average BOD at 27 and 3days DO F - Al 3+ Plate Count on nutrient agar MPN of Coliform MPN of E.Coli. (mg/l) (mg/l) (mg/l) (mg/l) no/1ml no/1ml no/1ml Raw Filtered Treated Raw Filtered Treated Raw Filtered Treated Raw Filtered Treated Raw Filtered Treated Raw Filtered Treated Raw Filtered Treated Jan Feb Mar Apr May Jun Jul Aug Sep Oct Nov Dec Jan Feb Mar Apr May Jun Jul Aug Oct Nov Dec Jan Feb Mar Apr May Max Min Average M31-9
45 Color Turbidity Total Solids Color, Pt/Co scale Jan-3 May-3 Sep-3 Jan-4 May-4 Jan-5 May-5 Total Solids, mg/l Jan-3 Jan-3 May-3 May-3 Sep-3 Jan-4 May-4 Jan-5 May-5 Jan-3 May-3 Sep-3 Jan-4 May-4 Jan-5 Sep-3 Jan-4 May-4 Jan-5 May-5 Jan-3 May-3 Sep-3 Jan-4 May-4 Jan ph Turbidity,NTU ph May Specific Conductivity 6 Total Dissolved Solids (TDS) 4 2 Specific Conductivity, /u mhos/cm Jan-3 May-3 Sep-3 Jan-4 May-4 Jan-5 May-5 TDS, mg/l May Suspended Solids Total Hardness as CaCO 3 1 Ca Suspended Solids, mg/l Jan-3 May-3 Sep-3 Jan-4 May-4 Jan-5 May-5 Total Hardness, mg/l Jan-3 May-3 Sep-3 Jan-4 May-4 Jan-5 May-5 Jan-3 May-3 Sep-3 Jan-4 May-4 Jan-5 Ca 2+, mg/l May Mg Cl Total Alkalinity (TALK) Mg 2+, mg/l Jan-3 May-3 Sep-3 Jan-4 May-4 Jan-5 May-5 Cl -, mg/l Jan-3 May-3 Sep-3 Jan-4 May-4 Jan-5 May-5 Jan-3 May-3 Sep-3 Jan-4 May-4 Jan-5 TALK, mg/l as CaCO3 May-5 Raw Filtered Treated Acceptable Cause for Rejection Figure M Monthly Water Qaulity of Chandel Water Treatment Plant Analysed by PWD s Laboratory from January 23 to May 25 (1/2) M31-91
46 SO Fe 2+ Mn SO42-, mg/l Jan-3 May-3 Sep-3 Jan-4 May-4 Jan-5 May-5 Fe 2+, mg/l Jan-3 May-3 Sep-3 Jan-4 May-4 Jan-5 May-5 Jan-3 May-3 Sep-3 Jan-4 May-4 Jan-5 Mn 2+, mg/l May NO KMnO 4 oxidizability day BOD at 27 NO32-, mg/l Jan-3 May-3 Sep-3 Jan-4 May-4 Jan-5 May-5 KMnO4 oxidizabilty, mg/l as Jan-3 O2 May-3 Sep-3 Jan-4 May-4 Jan-5 May-5 Jan-3 May-3 Sep-3 Jan-4 May-4 Jan-5 BOD, mg/l May DO F -.5 Al OD, mg/l Jan-3 May-3 Sep-3 Jan-4 May-4 Jan-5 May-5 F -, mg/l Jan-3 May-3 Sep-3 Jan-4 May-4 Jan-5 May-5 Jan-3 May-3 Sep-3 Jan-4 May-4 Jan-5 Al 3+, mg/l May Plate Count on Nutrient agar at 37,24hrs, /ml MPN of Coliform, /1 ml MPN of E.Coli., /1 ml Plate Count, /ml Jan-3 May-3 Sep-3 Jan-4 May-4 Jan-5 May-5 MPN of Coliform, /1 ml Jan-3 May-3 Sep-3 Jan-4 May-4 Jan-5 May-5 Jan-3 May-3 Sep-3 Jan-4 May-4 Jan-5 MPN of E.Coli., /1 ml May-5 Raw Filtered Treated Acceptable Cause for Rejection Raw Filtered Treated Acceptable Cause for Rejection Figure M Monthly Water Qaulity of Chandel Water Treatment Plant Analysed by PWD s Laboratory from January 23 to May 25 (2/2) M31-92
47 Table M List of Reservoirs for the Chandel Water Supply Scheme Serial No. Inlet Pipe Name of GLR / OHR Dia. Type Capacity Material (Name of Location) GLR/OHR Elevation (m) Supply Area (Village Name) (mm) (m3) RL HWL LWL 1 4 DIP Casarvarem MBR GLR 1, Outlet:6CIP 2 1 DIP Casarvarem GLR Casarvornem(18) 3 1 DIP Chandel GLR Chandel(15) 4 1 PVC Alorna GLR Alona(16) 5 1 PVC Ibrampur GLR Ibrampur(16) 6 1 PVC Ozari GLR Ozorim(19) 7 1 PVC Varcond GLR Varconda(9) 8 1 PVC Ambernem GLR Cancem(8), Amberem(1) 9 1 PVC Naibag GLR Poroscodem(7) 1 1 DIP Ugvem GLR Uguem(11) DIP Tamboxem GLR Tamboxem(12) 12 1 PVC Torshem GLR Torxem(13) 13 1 PVC Patradevi GLR Torxem(13) 14 2 DIP Dhargal GLR Dargalim(2) 15 1 PVC Virnoda GLR PVC GLR Virnora(21) 17 2 DIP Malpe GLR Pernem(M CI)(27), Pernem(Rural)(6) DIP Pernem GLR Pernem(M CI)(27), Pernem(Rural)(6) DIP Parastem GLR DIP GLR Pernem(M CI)(27) 21 2 DIP Tuem GLR DIP GLR Tuem(22) 23 2 DIP GLR DIP Parcem GLR Parcem(CT)(28) 25 1 PVC Agarwada GLR Chopdem(25), Agarvado(26) DIP Morjim GLR DIP GLR Morgim(24) DIP Mandrem GLR Mandrem(23) DIP Dandoswada GLR Mandrem(23) 3 15 DIP Korgao GLR Corgao(5) 31 2 DIP Kerim GLR Querim(2) 32 2 DIP Harmal GLR Arambol(4) DIP Paliyem GLR Paliem(3) Total 6,23 Detention Time 1. hrs Note: Remarks RL=Reduced Level (Base Elevation of Reservoir), HWL=High Water Level in Reservoir, LWL=Low Water Level in Reservoir, GLR=Ground Level Reservoir, OHR=Over Head Reservoir, MBR=Master Balancing Reservoir M31-93
48 M31.4 Assonora Water Supply Scheme The Assonora facility consists of a 12 plant commissioned in 1968 and a 3 planned commissioned in The 12 plant sources water from the Amthane Dam by gravity feed approximately 1 km from the plant as well as a supplementary supply from the Assonora River via a jack well. The river source supply line is interconnected with the 3 plant to supplement the main incoming raw water supply from Podocem (2 km s away) which provides 25 to the plant. The site also contains a clear water sump for the approximately 15 treated water received from Podocem WTP for onward distribution to the Assonora supply area. We understand that a proposal for an additional 4 plant has been prepared and submitted to PWD for approval. Table M lists the summary of asset data for the WTP and Table M contains detailed asset data for the WTP. The plant schematic is shown on Figure M The raw water pump house and the treatment plant are located within the same compound. The compound is adequately gated, fenced and secured by 24 hour on-site security personnel. The plant is manually operated and operates for 24 hours a day, using a three shift system. Flow measurement devices are not installed. Therefore, raw water supplied to the plant (from the dam, river and Podocem), clean water fed to the plant from the Podocem WTP, and onward transmission via the clean water reservoir was estimated using pump design capacities and pump operating hours. The raw water pump house has three pumps (one duty) each of 15 capacity. Maintenance standards are good, however the drive couplings/shafts are not adequately guarded. Records of pumping hours, loads etc are logged, however maintenance records are not kept. Maintenance is generally reactive to rectify problems as they become apparent, except for oiling and greasing which is undertaken regularly. There are no operation and maintenance manuals available and training for new staff is only provided on the job by existing experienced staff. There are no written or formal safety systems. The treatment plants are manually controlled. Most equipment appears to be in good working M31-94
49 order (considering the age of the plant) except for the alum and lime mixers which do not work. Since the alum and lime mixers are out of service lime and alum are added by hand at the flash mixer point. Generally, good maintenance was evident and the treated water pumps were well guarding. This plant should be used as an example of good practice for the other sites. Records of pump running hours, load, filter backwashing, and clear water reservoir levels are logged. However repairs to assets, maintenance and responses to breakdown problems are not recorded. The laboratory staff keep records of chemical usage and treatment parameters. Disinfection is achieved using gas chlorination. Chlorination is achieved using one tonne cylinders. There are usually eight cylinders in the chlorine house at any one time (five are empty). There are four vacuum type chlorinators (two are for standby). Maintenance of the chlorinators is performed in-house, however periodic calibration of the chlorinators does not occur and records of maintenance are not kept. Maintenance, installation standards and operation practices for chlorine use are poor. Ammonia solution is used as a means of detecting leaks along pipes and at the connection joints. Immersion tanks are the only facilities available to detect or contain gas leaks, however they are not easily accessible during an emergency and were empty when the study team visited the site. During the site visit, flexible copper pipes were noted to be trailing on the platform, presenting a trip hazard and placing the pipes in danger of being damaged. This is not a safe practice. The feeder pipe to the contact tanks is PVC and unprotected, which is not a safe practice. Personal breathing apparatus is available in the laboratory but is not used or maintained. This facility is probably in the poorest condition of all the facilities visited and presents a serious health hazard. The clean water reservoirs are cleaned every six months by PHE staff. There are no safety precautions, safety equipment, or safety systems implemented during the work. The cleaning procedure consists of removing the covers to provide fresh air to the workers and to allow the workers to enter. The desludging is undertaken manually by hosing/flushing down the internal surfaces. Tables M and M and Figures M and M show the data on monthly water quality at Chandel Water Treatment Plant. Table M shows a list of existing reservoirs for Assonora Water Supply Scheme. M31-95
50 Table M Summary of Asset Register of Assonora Water Treatment Plant Raw Water Intake & Raw Water Transmission Facility Treatment Facility Chemical Feeding Facility Name of Facility Intake Well & Connecting Pipe 12 3 Contents of Facility Remarks Contents of Facility Remarks D4mm CIP 1 Line, Assonora River D4mm (from 12 Intake) Assonora River Pump & Motor Horizontal Centrifugal Pump: Q 625m 3 /hr H 17.m 55kw 3 units (2 - Standby) Raw Water Transmission Main Design Cap. of Intake Pump =15 Vertical Pump: 7kw 2 units Valvant River D45mm 1,m ACP 1 Line Amthane Dam D6mm/D5mm L 2.12km 1 Line (25 : from Podocem Intake), Aerator Cascade Type: 2 units Cascade Type: 2 units Flash Mixer & Weir / Weir 1 unit (for Chemical Dosing), Flash Mixer 1 unit Parshal Flume 2 units (for Chemical Dosing), Flasha Parshal Flume Mixer 1 unit Clariflocculator Circular Horizontal Flow Type with Center Feed/Peripheral Collection Flocculation & Clarifier: D 22.9m (Flocc. Zone D 1.2m) WD 3.75m 1 unit Detention Period: Flocculation - 35min Clarifier 2.4 hrs Surface Loading: 38.2 m 3 /m 2 /d (26.5 mm/min) 2) Filter Gravity Rapid Sand Filter Type Alum Feeding Facility Dry Aluminum Sulfate Solution Tank: 2 units W 6.m L 5.m 2cells/basin 4 basins Effective Size of Sand:.6mm~.8mm, Depth of Sand:.55m Filter Area: 15. m 2 /cell, 3. m 2 /basin Filtration Rate: 4.4 m/hr 3) (15 m/d) Air Scouring Rate: 39.6m/hr/cell 4 ) (.66 m 3 /min/m 2 /cell) Backwash Rate: 26.4 m/hr/cell 5) (.44 m 3 /min/m 2 /cell) using 2m 3 Backwash Tank 1): 2~2.5 hrs 2): 3~4m 3 /m 2 /d Based on Specifications of Air Blower & Backwash Pump 3): 4.8~6.m/hr 4): 36~54m/hr 5): 24~36m/hr Circular Horizontal Flow Type with Center Feed/Peripheral Collection Flocculation & Clarifier: D 41.2m (Flocc. Zone D 18.4m) WD 4.m 1 unit Detention Period: Flocculation - 48min Clarifier 3.2 hrs Surface Loading: 29.5 m 3 /m 2 /d (2.5 mm/min) 2) Gravity Rapid Sand Filter Type W 4.m L 8.6m 2cells/basin 6 basins Effective Size of Sand:.6mm~.8mm, Depth of Sand:.75m Filter Area: 17.2 m 2 /cell, 34.4 m 2 /basin Filtration Rate: 6.4 m/hr 3) (153 m/d) Air Scouring Rate: 33.6m/hr/cell 4 ) (.56 m 3 /min/m 2 /cell) Backwash Rate: 17.4 m/hr/cell 5) (.29 m 3 /min/m 2 /cell) Dry Aluminum Sulfate Solution Tank: 2 units Using 12 s Facility Lime Feeding Facility Powder Lime, Solution Tank: 2 units, Non-Function from Commissioning Using Temporary Place under Aerator by Hand Carrying Disinfection Facility Liquid Chlorine (1 tone Container net 9kg) Chlorinator: 4 unit (2 units for 12 & 2 units for 3 ) Laboratory Frequency of Sampling & Analysis Clear Water Transmission Facility Clear Water Sump Volume=1,2 m 3 1 unit, Retention Time: 2.7 hr Transmitted Pump & Motor Horizontal Centrifugal Pump: Q 684m 3 /hr H 136m 4kw 3 units (1 or 2 Standby) In-Service, Jar Test: Not in Service Every Hour: ph, Turbidity, R-Cl Daily: Turbidity, ph, Alkalinity, Hardness, Chlorine, Mn, Fe, D.O.,R-Cl, Color, Oder, Bacteriorogical Design Cap. of Pump = 16 ~32 Volume=1,m 3 2 units, Volume=2,m 3 1 unit Retention Time: 3.3 hr Horizontal Centrifugal Pump: Q 684m 3 /hr H 136m 4kw 4 units (1 Standby) Transmission Line D4mm 8m C.I.P. 1 Line, D6mm 8m C.I.P. 1 Line, D9mm 8m D.I.P. 1 Line Clear Water Reservoir Volume=8 m 3 4 units & Volume=5, m 3 1 unit, Total Volume = 7,4 m 3 in Assonora MBR (MBR) Note: 1) ~ 4) are referring to Manual on Water Supply and Treatment, Third Edition Revised and Updated, May 1999 Valvant River 1): 2~2.5 hrs 2): 3~4m 3 /m 2 /d Based on Specifications of Air Blower & Backwash Pump 3): 4.8~6.m/hr 4): 36~54m/hr 5): 24~36m/hr Non-Function from Commisioning Design Cap. of Pump = 49 M31-96
51 Assonora WTP Schematic Sequence, not to scale 15 treated water from Podocem WTP 2m3 Reservoir Treated Water Sump 1m3 Power Sub-Station Treated Water Sump 1m3 3 WTP 6 x Gravity Sand Filters Alum & Lime dosing (Open Area) Flash mixer Parshal Flume Floculation Aerator Aerator 3 Clarifier 25 Raw Water from Podocem Intake D6mm/D5mm L=2.12km Raw Water Reser.8 m3 Rising Mains Jack Well/ Pump House 2 Pumps Valvant River Intake Assonora River intake Amthane Dam intake D4mm CIP Raw Water Pump House 3 Pumps (1 Duty) 12m3 Reservoir Gas chlor. Clear Water Pump House 4 Pumps (3 Duty) Clear Water Pump House 3 Pumps (2 Duty) D45mm ACP D5mm DIP Laboratory 4 x Gravity Sand Filters with 2m3 Wash Water Tank Rising Mains Weir Aerator Aerator Alum & Lime dosing Flash Mixer 12 WTP D9mm DIP D6mm CIP D4mm CIP Floculation 12 Clarifier Assonora MBR 8m3 Res. 8m3 Res. Reservoir gravity feed to distribution networks 8m3 Res. 8m3 Res. 5m3 Reservoir Figure M Schematic Sequence of Assonora Water Treatment Plant M31-97
52 Table M Present Conditions of Assonora Water Treatment Plant (1/9) Background Covered Area for Water Supply Taluka Bardez & Part of Bicholim Name of Plant Assonora W.T.P. Number of W.T.P. Number (1) 12 (2) 3 Assonora w.t.p. Assonora W.T.P. from Podocem W.T.P. Total Capacity of Plant m 3 /d 12, 3, 15, 57, Assonora Assonora Dam Anthane Year of Construction Year Year of Commission Year Expected Augmentation Plan (Tillari Irrigation Project) Item Raw Water Resources River Contents 25 Raw Water Received from Raw Water Reservoir via Valvant River Intake Pump Station 15 Clear Water Received from Padocem W.T.P.(4 ) Remarks M31-98
53 Table M Present Conditions of Assonora Water Treatment Plant (2/9) Name & Number of W.T.P. Capacity of Plant (Transmitted Water Supply from Plant) Capacity of Raw Water Intake & Water Treatment Plant Number (1) 12 (2) 3 Assonora w.t.p. Assonora W.T.P. from Podocem W.T.P. Total Remarks m 3 /d 12, 3, 15, 57, 15 Clear Water Received from Padocem W.T.P.(4 ) m 3 /d 12,6 31,5 15, 59,1 Name of Facility Contents of Facility (1) 12 (2) 3 Total Head Water Works : Raw Water Intake Intake Well Width m? Length m? Height m? Water Depth m? Design Water Level Connecting Pipe Raw Water Pump & Motor? H.W.L. m? L.W.L.. m? Volume m 3 /unit Retention Time min Diameter mm D=.4 Number of Line No C= 11 Length m Q=.146 Material CIP Note Velocity m/sec Loss of Head m Capacity l/sec m 3 /min m 3 /hr m 3 /d 15, Number unit Stand-by unit Total Capacity m 3 /d 15, Head m Maker M & P Year of Manufacture Assessment of Condition Working Motor Output HP kw Number Unit Kirlosker Maker Year of Manufacture Assessment of Condition Assonora River Working : Estimated 5% lossesof Nominal Capacity Remarks One additional pump (9. m3/min 2 m) for 12 Plant in case of insufficint raw water. M31-99
54 Table M Present Conditions of Assonora Water Treatment Plant (3/9) Raw Water Transmission Line Water Treatment Plant Diameter mm /5 D=.6 Length m - 1, 12 2, C= 11 - ACP CIP / MS CIP Q=.289 Velocity m/sec - Loss of Head m - Assessment of Pipe - Good Condition Valve - Leakage Aerator Capacity m 3 /hr/unit m 3 /d/unit 6,3 15,75 Number Unit 2 2 Width m Length m El. of Top Aerator m Assessment of Condition Working Working Weir 2 Parshal Flume Working Working 1 Flash Mixer 1 Flash Mixer Assessment of Condition Working Working Dsign Capacity m 3 /min/unit m 3 /hr/unit ,312.5 m 3 /d/unit 12,6 31,5 Number Unit 1 1 Water Depth m Parshal Flume / Weir Assessment of Condition Flash Mixer Clarifiers / Settling Tank (Coagulation Basin) Name of Facility Contents of Facility Source of Raw Water Material Overall Diameter m Flocc. Zone Dia. m Frequency of Desludging Once a Day : General Once a Day : General Volume Twice a Day : Monsoon SeasTwice a Day : Monsoon Season Overall m 3 /unit 1, ,332.7 Flocculation Zone m 3 /unit ,63.62 Clarifying Zone m 3 /unit 1, ,269.5 Retention Time - (1) 12 (2) 3 from Amthane Tank to Aerator 25 Raw Water Received from Raw Water Reservoir via Valvant River Intake Pump Station Good Leakage Flocculation Zone min Clarifying Zone min OK OK Overall min Surface Area m 2 /unit ,67.3 Surface Loading mm/min 26.5 OK 2.5 OK W.L. of Clarifier m Assessment of Condition Working Working Total Remarks M31-1
55 Table M Present Conditions of Assonora Water Treatment Plant (4/9) Flocculator & Drive Arrangement Name of Facility Number unit 1 1 Assessment of Condition Working Working m 3 /hr/unit m 3 /d/unit 3,15 5,25. Number Unit 4 6 Type Rapid Gravity Sand Filter Rapid Gravity Sand Filter Width m Length m Height m Water Depth m Filtered Area m 2 /unit Velocity m 3 /d/m Filter Design Capacity Filter Washing Criteria & Method Backwash Pump & Motor Filter Media E.S. of Sand mm.6 ~.8.6 ~.8? Depth of Sand mm 55 too thin 75 Type of Underdrain Year Replacement of Media 23 Replace New 23 Replace New Water Level of Filter m Assessment of Condition Working Working Air Scouring m 3 /min/m 2.66 Generaly OK.56 NO Rate Air Scouring Time min 1 1 Backwash Rate m 3 /min/m 2.44 Generaly OK.29 NO Backwashing Time Frequency of Washing min Once a Day : General Once a Day : General Twice a Day : Maximum Twice a Day : Maximum Capacity m 3 /min 2.8 Lifting Pump 5. m 3 /hr 125 to Back Wash 3 m 3 /d 3, Water Tank = 7,2 3 Number unit 2 2m 3 2 Stand-by unit 1 1 Total Capacity m 3 /min m 3 /d 3, 7,2 Head m Type of Pump Centrifugal Pump Centrifugal Pump Motor Output HP 2 4 kw Assessment of Condition Working Working Contents of Facility Remarks (1) 12 (2) 3 Depend on 15 turb. of wash 15 water drain Depend on turb. of wash water drain Total M31-11
56 Table M Present Conditions of Assonora Water Treatment Plant (5/9) Air Blower Clear Water Reservoir Name of Facility Contents of Facility Capacity (1) 12 (2) 3 m 3 /min m 3 /hr m 3 /d 14,34 13,8 Number unit 2 2 Stand-by unit Total Capacity m 3 /min m 3 /d 28,68 27,6 Head mm WG 5, Motor Output HP 2 2 kw Maker USHA/Kirlosker EVEREST/CROMPTON GREVES Assessment of Condition Working 21 Working Number of C.W.R. Unit (1) (1) (2) Width m Diameter m Length m Water Depth m Number Unit Volume m 3 1,35 1,39 2,28 Total m 3 1,35 (1,2 m 3 ) 4,16 (4, m 3 ) Detention Time hr Last Date of Cleaning Water Level m Pediodical Pediodical Pediodical Transmission (Clear Water) Facility Transmission (Clear Water) Pump Assessment of Condition Capacity Slab Damaged Slab Damaged Under Construction l/sec m 3 /min m 3 /hr m 3 /d 16,416 16,416 Number 3 4 unit Stand-by 2 1 Total Capacity m 3 /d 16, 49, Head m Type of Pump Maker Year of Manufacture Assessment of Condition Centrifugal Pump Centrifugal Pump M & P M & P Pump Working Working Valve Working Working Total Remarks M31-12
57 Table M Present Conditions of Assonora Water Treatment Plant (6/9) Transmission (Clear Water) Motor Raising Main (Transmissio n Lines) Chemical Facility Alum Feeding Facility Name of Facility Contents of Facility (1) 12 (2) 3 Motor Output HP kw 4 4 Number Unit 3 4 Maker GEC GEC Year of Manufacture Assessment of Condition Working Working Diameter mm Length m Material CIP "B" CIP "B" DIP (K-9) Velocity m/sec Assessment of Pipe Working Condition Valve Working Capacity kg/hr - - m 3 /unit Diameter m Width m Length m Height m Volume m 3 Common for 2 Plants 3 Lines to 8 m 3 3 GLR & 5, m 3 GLR at Assonora M.B.R. Lime Feeding Facility Number 2 2 Unit Stand-by Assessment of Condition Functional Non-Function : from Commissioning Capacity kg/hr - - m 3 /unit Diameter m Width m Length m Height m Volume m 3 Disinfection System Number 2 Unit Stand-by Assessment of Condition Non-Function Non-Function : from Commissioning Common for 2 Plants Chemical Used Liquid Chlorine / Bleaching Powder Type of Plant & Machinery Chlorinators Capacity kg/hr 2.5 Number 4 : 2 for 12 & 2 for 3 Unit Stand-by 1 Neutralization (Caustic Soda) : Tank Provided 1993 Working Safty Measures Taken Commissioned Assessment of Condition Total Remarks M31-13
58 Table M Present Conditions of Assonora Water Treatment Plant (7/9) Laboratory Chemical Testing Laboratory In-service (Exist) Jar Testing In-service (Exist) Availability of Skilled Chemists Available Availability of Required Chemicals Available Average 2 Months Storage for Chemicals of Alum, Lime & Cl Use of Test Reports As per Format Frequency of Sampling & Analysis 12 Parameters Tests Daily Every Hour: ph, Turb. R.-Cl, Bacteriological (once a day) : Raw Water - : Clear water - General Quality of Water Good Transformers Name of Facility Contents of Facility (1) 12 (2) 3 Raw Water Quality Clear Water Quality Good Turbid.(Max:25NTU, Ave:35-4NTU, Min:1NTU), Low ph (Max:6.97, Ave:6.8, Mun:6.5) Number of Transformer (1) (2) (3) (4) (2) Borrowed from Opa Pole Mounted / Pad Mounted Pad Pad Pad Pad Capacity kva 1,6 2,5 5 5 Number Unit Standby 1 Commissioned Likely Design Life Year Last Replacement Assessment of Condition Equipment Status Flow Meters Other Operating Valves Other Important Assets Working Valve's Condition Working Condition Visible Leakage and Locations Nil Building Condition Wastewater Disposal Arrangements River Down Stream Common for 2 Plants Daily : Other (Turb., ph, Alkalinity, Hardness, Chloride, Mn, Fe, D.O., R.-Cl, Color, Odor, Bacteriological)Test Common for 2 Plants Non-Functional Not Provided Need Replacement Need Replacement Total Remarks M31-14
59 Table M Present Conditions of Assonora Water Treatment Plant (8/9) Organization & Staff Deployed General Shift 2 Plants (12 & 3 ) Working Hour : Staff Deployed : Shift in Plant Operation 8:3 17:3 (12: : Lunch Time) Management Staff - Engineers Assistant Engineer 1 Person Junior Engineer 3 Persons L.D.C 1 Person Peon 1 Person Watchman 2 Persons Drivers 4 Persons Others 19 Persons Total 31 Persons Shifting System 3 Shifting System Covering 24 Hours Working Hour : 1: 8: 14:, 2: 14: 21:, 3: 21: 8: Grouping Staff Deployed : 2 Plants (12 & 3 Shift in Charge Electrician, Operator, Security, etc. Total 13 ~ 14 Persons M31-15
60 Table M Present Conditions of Assonora Water Treatment Plant (9/9) Staff Deployed at the Plant Management Staff - Engineers Assistant Engineer 1 Junior Engineer 3 Assistant Chemist 1 Lab. Technician 1 L.D.C 1 Peon 1 Watchman 1 Drivers 4 Sub-total 13 Skilled Staff - Operators / Quality Testing Work Assistant 2 Electrician 3 Pump Operator 1 Plumber 2 Assist. Plumber 1 Assistant Operator 2 Lab - Technician 1 Mechanic G - Ⅱ 3 Lab - Attendant 2 Filter Operator 1 Chlorine Operator 1 Highly Skilled Labour 2 Skilled Worker 8 Assist. Mason 1 Senior Operator 1 Sub-total 31 Unskilled Staff 43 Total Number 87 2 Plants (12 & 3 ) Person Qualification Year of Service Service at plant - Junior Operator, Watchman, Sweeper, Khalashi, Labour, Unskilled Worker, Helper, Workman M31-16
61 Table M Monthly Water Quality of Assonora Water Treatment Plant, 12 Analysed by PWD s Laboratory from January 23 to May 25 (1/2) Color Odor Taste Turbidity ph Specific Conductivity (NTU) ( /u mhos/cm) Raw Filtered Treated Raw Filtered Treated Raw Filtered Treated Raw Filtered Treated Raw Filtered Treated Raw Filtered Treated Jan Feb Mar Apr May Jun Jul Aug Sep Oct Nov Dec Jan Feb Mar Apr May Jun Jul Aug Oct Nov Dec Jan Feb Mar Apr May Max Min Average Total Solids Total Dissolved Solids Total Hardness as CaCO Suspended Solids 3 (TDS) (TALK) Ca 2+ Mg 2+ (mg/l) (mg/l) (mg/l) (mg/l) (mg/l) (mg/l) Raw Filtered Treated Raw Filtered Treated Raw Filtered Treated Raw Filtered Treated Raw Filtered Treated Raw Filtered Treated Jan Feb Mar Apr May Jun Jul Aug Sep Oct Nov Dec Jan Feb Mar Apr May Jun Jul Aug Oct Nov Dec Jan Feb Mar Apr May Max Min Average M31-17
62 Table M Monthly Water Quality of Assonora Water Treatment Plant, 12 Analysed by PWD s Laboratory from January 23 to May 25 (2/2) Cl - Total Alkalinity as CaCO 3 - SO 4 Fe 2+ Mn NO 3 KMnO 4 oxidizability as O 2 (mg/l) (mg/l) (mg/l) (mg/l) (mg/l) (mg/l) (mg/l) Raw Filtered Treated Raw Filtered Treated Raw Filtered Treated Raw Filtered Treated Raw Filtered Treated Raw Filtered Treated Raw Filtered Treated Jan Feb Mar Apr May Jun Jul Aug Sep Oct Nov Dec Jan Feb Mar Apr May Jun Jul Aug Oct Nov Dec Jan Feb Mar Apr May Max Min Average BOD at 27 and 3days DO F - Al 3+ Plate Count on nutrient agar MPN of Coliform MPN of E.Coli. (mg/l) (mg/l) (mg/l) (mg/l) no/1ml no/1ml no/1ml Raw Filtered Treated Raw Filtered Treated Raw Filtered Treated Raw Filtered Treated Raw Filtered Treated Raw Filtered Treated Raw Filtered Treated Jan Feb Mar Apr May Jun Jul Aug Sep Oct Nov Dec Jan Feb Mar Apr May Jun Jul Aug Oct Nov Dec Jan Feb Mar Apr May Max Min Average M31-18
63 Color Turbidity Total Solids Jan-3 Color, Pt/Co scale May-3 Sep-3 Jan-4 May-4 Aug-4 Dec-4 Apr-5 Total Solids, mg/l Jan-3 Jan-3 May-3 May-3 Sep-3 Jan-4 May-4 Aug-4 Dec-4 Apr-5 Jan-3 May-3 Sep-3 Jan-4 May-4 Aug-4 Dec-4 Sep-3 Jan-4 May-4 Aug-4 Dec-4 Apr-5 Jan-3 May-3 Sep-3 Jan-4 May-4 Aug-4 Dec ph Turbidity,NTU ph Apr Specific Conductivity 6 Total Dissolved Solids (TDS) 4 2 Jan-3 Specific Conductivity, /u mhos/cm May-3 Sep-3 Jan-4 May-4 Aug-4 Dec-4 Apr-5 TDS, mg/l Apr Suspended Solids Total Hardness as CaCO 3 1 Ca Jan-3 Suspended Solids, mg/l May-3 Sep-3 Jan-4 May-4 Aug-4 Dec-4 Apr-5 Total Hardness, mg/l Jan-3 May-3 Sep-3 Jan-4 May-4 Aug-4 Dec-4 Apr-5 Jan-3 May-3 Sep-3 Jan-4 May-4 Aug-4 Dec-4 Ca 2+, mg/l Apr Mg Cl - Total Alkalinity (TALK) Jan-3 Mg 2+, mg/l May-3 Sep-3 Jan-4 May-4 Aug-4 Dec-4 Apr-5 Cl -, mg/l Jan-3 May-3 Sep-3 Jan-4 May-4 Aug-4 Dec-4 Apr-5 Jan-3 May-3 Sep-3 Jan-4 May-4 Aug-4 Dec-4 TALK, mg/l as CaCO3 Apr-5 Raw Filtered Treated Acceptable Cause for Rejection Raw Filtered Treated Acceptable Cause for Rejection Figure M Monthly Water Quality of Assonora Water Treatment Plant, 12 Analysed by PWD s Laboratory from January 23 to May 25 (1/2) M31-19
64 SO Fe 2+ Mn SO42-, mg/l Jan-3 May-3 Sep-3 Jan-4 May-4 Aug-4 Dec-4 Apr-5 Fe 2+, mg/l Jan-3 May-3 Sep-3 Jan-4 May-4 Aug-4 Dec-4 Apr-5 Jan-3 May-3 Sep-3 Jan-4 May-4 Aug-4 Dec-4 Mn 2+, mg/l Apr NO KMnO 4 oxidizability day BOD at NO32-, mg/l Jan-3 May-3 Sep-3 Jan-4 May-4 Aug-4 Dec-4 Apr-5 KMnO4 oxidizabilty, mg/l as O2 Jan-3 May-3 Sep-3 Jan-4 May-4 Aug-4 Dec-4 Apr-5 Jan-3 May-3 Sep-3 Jan-4 May-4 Aug-4 Dec-4 BOD, mg/l Apr DO F -.5 Al OD, mg/l Jan-3 May-3 Sep-3 Jan-4 May-4 Aug-4 Dec-4 Apr-5 F -, mg/l Jan-3 May-3 Sep-3 Jan-4 May-4 Aug-4 Dec-4 Apr-5 Jan-3 May-3 Sep-3 Jan-4 May-4 Aug-4 Dec-4 Al 3+, mg/l Apr Plate Count on Nutrient agar at 37,24hrs, /ml MPN of Coliform, /1 ml MPN of E.Coli., /1 ml Plate Count, /ml Jan-3 May-3 Sep-3 Jan-4 May-4 Aug-4 Dec-4 Apr-5 MPN of Coliform, /1 ml Jan-3 May-3 Sep-3 Jan-4 May-4 Aug-4 Dec-4 Apr-5 Jan-3 May-3 Sep-3 Jan-4 May-4 Aug-4 Dec-4 MPN of E.Coli., /1 ml Apr-5 Raw Filtered Treated Acceptable Cause for Rejection Raw Filtered Treated Acceptable Cause for Rejection Figure M Monthly Water Quality of Assonora Water Treatment Plant, 12 Analysed by PWD s Laboratory from January 23 to May 25 (2/2) M31-11
65 Table M Monthly Water Quality of Assonora Water Treatment Plant, 3 Analysed by PWD s Laboratory from January 23 to May 25 (1/2) Color Odor Taste Turbidity ph Specific Conductivity (NTU) ( /u mhos/cm) Raw Filtered Treated Raw Filtered Treated Raw Filtered Treated Raw Filtered Treated Raw Filtered Treated Raw Filtered Treated Jan Feb Mar Apr May Jun Jul Aug Sep Oct Nov Dec Jan Feb Mar Apr May Jun Jul Aug Oct Nov Dec Jan Feb Mar Apr May Max Min Average Total Solids Total Dissolved Solids Total Hardness as CaCO Suspended Solids 3 (TDS) (TALK) Ca 2+ Mg 2+ (mg/l) (mg/l) (mg/l) (mg/l) (mg/l) (mg/l) Raw Filtered Treated Raw Filtered Treated Raw Filtered Treated Raw Filtered Treated Raw Filtered Treated Raw Filtered Treated Jan Feb Mar Apr May Jun Jul Aug Sep Oct Nov Dec Jan Feb Mar Apr May Jun Jul Aug Oct Nov Dec Jan Feb Mar Apr May Max Min Average M31-111
66 Table M Monthly Water Quality of Assonora Water Treatment Plant, 3 Analysed by PWD s Laboratory from January 23 to May 25 (2/2) Cl - Total Alkalinity as CaCO 3 - SO 4 Fe 2+ Mn NO 3 KMnO 4 oxidizability as O 2 (mg/l) (mg/l) (mg/l) (mg/l) (mg/l) (mg/l) (mg/l) Raw Filtered Treated Raw Filtered Treated Raw Filtered Treated Raw Filtered Treated Raw Filtered Treated Raw Filtered Treated Raw Filtered Treated Jan Feb Mar Apr May Jun Jul Aug Sep Oct Nov Dec Jan Feb Mar Apr May Jun Jul Aug Oct Nov Dec Jan Feb Mar Apr May Max Min Average BOD at 27 and 3days DO F - Al 3+ Plate Count on nutrient agar MPN of Coliform MPN of E.Coli. (mg/l) (mg/l) (mg/l) (mg/l) no/1ml no/1ml no/1ml Raw Filtered Treated Raw Filtered Treated Raw Filtered Treated Raw Filtered Treated Raw Filtered Treated Raw Filtered Treated Raw Filtered Treated Jan Feb Mar Apr May Jun Jul Aug Sep Oct Nov Dec Jan Feb Mar Apr May Jun Jul Aug Oct Nov Dec Jan Feb Mar Apr May Max Min Average M31-112
67 Color Turbidity Total Solids Jan-3 Color, Pt/Co scale May-3 Sep-3 Jan-4 May-4 Aug-4 Dec-4 Apr-5 Total Solids, mg/l Jan-3 Jan-3 May-3 May-3 Sep-3 Jan-4 May-4 Aug-4 Dec-4 Apr-5 Jan-3 May-3 Sep-3 Jan-4 May-4 Aug-4 Dec-4 Sep-3 Jan-4 May-4 Aug-4 Dec-4 Apr-5 Jan-3 May-3 Sep-3 Jan-4 May-4 Aug-4 Dec ph Turbidity,NTU ph Apr Specific Conductivity 6 Total Dissolved Solids (TDS) 4 2 Jan-3 Specific Conductivity, /u mhos/cm May-3 Sep-3 Jan-4 May-4 Aug-4 Dec-4 Apr-5 TDS, mg/l Apr Suspended Solids Total Hardness as CaCO 3 1 Ca Jan-3 Suspended Solids, mg/l May-3 Sep-3 Jan-4 May-4 Aug-4 Dec-4 Apr-5 Total Hardness, mg/l Jan-3 May-3 Sep-3 Jan-4 May-4 Aug-4 Dec-4 Apr-5 Jan-3 May-3 Sep-3 Jan-4 May-4 Aug-4 Dec-4 Ca 2+, mg/l Apr Mg Cl Total Alkalinity (TALK) Jan-3 Mg 2+, mg/l May-3 Sep-3 Jan-4 May-4 Aug-4 Dec-4 Apr-5 Cl -, mg/l Jan-3 May-3 Sep-3 Jan-4 May-4 Aug-4 Dec-4 Apr-5 Jan-3 May-3 Sep-3 Jan-4 May-4 Aug-4 Dec-4 TALK, mg/l as CaCO3 Apr-5 Raw Filtered Treated Acceptable Cause for Rejection Raw Filtered Treated Acceptable Cause for Rejection Figure M Monthly Water Quality of Assonora Water Treatment Plant, 3 Analysed by PWD s Laboratory from January 23 to May 25 (1/2) M31-113
68 SO Fe 2+ Mn SO42-, mg/l Jan-3 May-3 Sep-3 Jan-4 May-4 Aug-4 Dec-4 Apr-5 Fe 2+, mg/l Jan-3 May-3 Sep-3 Jan-4 May-4 Aug-4 Dec-4 Apr-5 Jan-3 May-3 Sep-3 Jan-4 May-4 Aug-4 Dec-4 Mn 2+, mg/l Apr NO KMnO 4 oxidizability 3-day BOD at NO32-, mg/l Jan-3 May-3 Sep-3 Jan-4 May-4 Aug-4 Dec-4 Apr-5 KMnO4 oxidizabilty, mg/l as O2 Jan-3 May-3 Sep-3 Jan-4 May-4 Aug-4 Dec-4 Apr-5 Jan-3 May-3 Sep-3 Jan-4 May-4 Aug-4 Dec-4 BOD, mg/l Apr DO F -.5 Al OD, mg/l Jan-3 May-3 Sep-3 Jan-4 May-4 Aug-4 Dec-4 Apr-5 F -, mg/l Jan-3 May-3 Sep-3 Jan-4 May-4 Aug-4 Dec-4 Apr-5 Jan-3 May-3 Sep-3 Jan-4 May-4 Aug-4 Dec-4 Al 3+, mg/l Apr Plate Count on Nutrient agar at 37,24hrs, /ml MPN of Coliform, /1 ml MPN of E.Coli., /1 ml Plate Count, /ml Jan-3 May-3 Sep-3 Jan-4 May-4 Aug-4 Dec-4 Apr-5 MPN of Coliform, /1 ml Jan-3 May-3 Sep-3 Jan-4 May-4 Aug-4 Dec-4 Apr-5 Jan-3 May-3 Sep-3 Jan-4 May-4 Aug-4 Dec-4 MPN of E.Coli., /1 ml Apr-5 Raw Filtered Treated Acceptable Cause for Rejection Raw Filtered Treated Acceptable Cause for Rejection Figure M Monthly Water Quality of Assonora Water Treatment Plant, 3 Analysed by PWD s Laboratory from January 23 to May 25 (2/2) M31-114
69 Table M List of Reservoirs for the Assonora Water Supply Scheme (1/3) Series No. System Name of GLR / OHR (Name of Location) Type 1 Assonora Assonora WTP GLR 1,2 2 WTP GLR 1, 3 GLR 1, 4 GLR 2, Sub-Total 5,2 5 Assonora Assonora MBR GLR 8 6 MBR GLR 8 7 GLR 8 8 GLR 8 GLR/OHR Supply Area Capacity Elevation (m) (m3) RL HWL LWL Taluka Village Name GLR 5, Sub-Total 8,2 1 Sirsaim GLR Bardez Sircaim(8) 11 Cansa-Bodiem GLR ditto- Tivim(9) 12 Colvale GLR ditto- Colvale(CT)(35) 13 Tivim-IDC OHR ditto- Tivim(9), Mapusa(M CI)(36) 35 (Old) 14 Verla-Canca GLR ditto- Verka(16), Canca(17) 15 GLR ditto- 16 Parra GLR ditto- Parra(15) Sub-Total 1,75 17 Quitula GLR Bardez Aldona(CT)(44) 18 Aldona GLR ditto- 19 GLR ditto- Ponolem(25), Calvim(26), Aldona(CT)(44) 2 Khorjuem GLR ditto- Corjuem(24) 21 Nachinola OHR ditto- 22 OHR ditto- Nachinola(23) 23 GLR ditto Moira OHR ditto- Moira(22) 25 Lakuem GLR ditto- Aldona(CT)(44) 26 Olaulim GLR ditto- Olaulim(27), 27 Pomburpa GLR ditto- Pomburpa(28) 28 Ecoxim GLR ditto- Pomburpa(28) 29 Salai GLR ditto- 3 GLR ditto- Salvador do Mundo(33) Sub-Total 3,2 15. Remarks M31-115
70 Table M List of Reservoirs for the Assonora Water Supply Scheme (2/3) Series No. System Name of GLR / OHR (Name of Location) Type GLR/OHR Supply Area Capacity Elevation (m) (m3) RL HWL LWL Taluka Village Name 31 Assonora GLR Bardez Moitem(6), Assonora(7) 32 Tivim GLR ditto- Tivim(9) 33 Accoi OHR ditto- Mapusa(M CI)(36) 34 Khorlim GLR ditto- Mapusa(M CI)(36) 35 Bastora GLR ditto- Bastora(18), Paliem(19), Punola(2), Ucassaim(21) 36 Anjuna GLR ditto- Assagao(11) 37 Girim GLR ditto- Guirim(CT)(37) 38 OHR ditto- Guirim(CT)(37) 39 Calangute OHR ditto- Calangute(CT)(39) 4 Torda OHR ditto- Salvador do Mundo(33), Penha-de-Franca(CT)(42), 41 7 GLR ditto- Socorro(Serula)(CT)(43) w / Pump 42 Porvolim OHR ditto- Pilerne(32), Socorro(Serula)(CT)(43) 43 GLR ditto- w / Pump 44 Pilerna GLR ditto- Marra(31), Pilerne(32) 45 Verem GLR ditto- Reis Magos(CT)(41) 46 Alto-Betim GLR ditto- Reis Magos(CT)(41) 47 Pundalik Nagar GLR ditto- w / Pump Penha-de-Franca(CT)(42) 48 OHR ditto- 49 Secretariate Complex GLR -ditto- 2 m 3/ day 5 Nerul GLR ditto- Nerul(3) Sub-Total 6,3 51 Pirna GLR Bardez 52 GLR ditto- Pirna(5) 53 GLR ditto- 54 Nadora GLR ditto- 55 GLR ditto- Nadora(4) 56 Revora GLR ditto- 57 GLR ditto- Revora(3) Colvale GLR ditto- Colvale(CT)(35) 59 Chicalim GLR ditto- Camurlim(2) 6 Camurlim GLR ditto- Camurlim(2) 61 Cuchelim GLR ditto- Mapusa(M CI)(36) 62 Sodiem GLR ditto- Siolim(CT)(34), 63 Oxel GLR ditto- Oxel(1) 64 Peddem OHR ditto- Mapusa(M CI)(36) 65 Marna GLR ditto- Marna(1) Remarks M31-116
71 Table M List of Reservoirs for the Assonora Water Supply Scheme (3/3) Series No. GLR/OHR Supply Area Capacity Elevation (m) (m3) RL HWL LWL Taluka Village Name 66 Siolim GLR ditto- 67 GLR ditto- Siolim(CT)(34), 68 Ucassaim GLR ditto- Uassaim(21) 69 Assagao GLR ditto- Assagao(11) 7 Vagator GLR ditto- Anjuna(12) 71 Arpora GLR ditto- Arpora(13), Nagoa(14) 72 Calangute GLR ditto- Calangute(CT)(39) 73 Candolim GLR ditto- Candolim(CT)(4) 74 GLR ditto Sinquelim GLR ditto- Candolim(CT)(4) 76 GLR ditto- 77 Saligao GLR ditto- Saligao(CT)(38) 78 Sangolda GLR ditto- Sangolda(29) 79 Vadiem GLR ditto- Socorro(Serula)(CT)(43) 8 Socorro OHR ditto- 81 GLR ditto- Socorro(Serula)(CT)(43), Sangolda(29) 82 Sump ditto- w / Pump Sub-Total 1,85 83 Housing Board OHR Bardez 84 OHR ditto- 85 OHR ditto- 86 Mapusa GLR 2, ditto- 87 GLR ditto- Mapusa(M CI)(36) 88 GLR ditto- w / Pump 12 P/Main 89 GLR ditto- 9 Mapusa (Altinho) GLR ditto- 91 GLR ditto- 92 Assagao GLR ditto- Assagao(11), Parra(15), Verla(16), Canca(17), Mapusa(M CI)(36) 93 P.D.A. Colony OHR 3, ditto- Pilerne(32), Reis Magos(CT)(41), Penha-de-Franca(CT)(42) Sub-Total 8,9 94 Sirigao GLR Bicholim Sirigao(6), Maem(12) 95 Usap GLR ditto- Adwalpale(5), Sirigao(6) Note: System Assonora North (Bicholim Taluka) Name of GLR / OHR (Name of Location) Type Sub-Total 85 Total 45, hrs RL=Reduced Elevation, HWL=High Water Level in Reservoir, LWL=Low Water Level in Reservoir, GLR=Ground Level Reservoir, OHR=Over Head Reservoir, MBR=Master Balancing Reservoir Remarks M31-117
72 M31.5 Sanquelim Water Supply Scheme Table M lists the summary of asset data for the WTP and Table M contains detailed asset data for the WTP. The plant schematic is shown on Figure M Tables M and M and Figures M and M show the data on monthly water quality at Chandel Water Treatment Plant. Table M shows a list of existing reservoirs for Sanquelim Water Supply Scheme. Podocem WTP The Podocem WTP was built recently (23) and has a design capacity of 4. The newly constructed raw water pump house supplies the plant with water from the Valvant River. The water is pumped approximately.6 km from the river. There are three pumps (two duty). These pumps are not adequately guarded. A record of running hours, loads etc. is logged. The operation and maintenance of the pump house and treatment plant has been contracted to a local company (run by a retired PHE engineer) on a three monthly basis. This may be revised to be a longer contract (2-5 years). The pump house compound also contains a pump house that was commissioned in It contains two pumps (one duty). These pumps are not adequately guarded. This pump house supplys 25 to the Assonora WTP via a short rising main to a reservoir. The water is fed by gravity from the reservoir to the Assonora WTP which is located approximately 2 km away. A log of running hours, loads etc. is maintained. A third pump house, which contains two pumps (one duty) was commissioned in This pump house supplies water to the 12 Sanquelim WTP via a.6 km rising main. This pump house is untidy and the pumps are not adequately guarded. A log of running hours, loads etc. is maintained. Both the raw water pumping compound and the treatment plant compound are adequately gated, fenced and secured by 24 hour on-site security personnel. The plant is in operation 24 hours a day using a three shift system. Flow measurement devices are not provided on-site. Therefore, the amount of raw water supplied to the plant, as well as the amount of clean water fed to the transmission system via the clean water reservoirs, is estimated based on pump design capacities and hours of operation. Logs are maintained for pump running hours, loads etc, however maintenance records are not M31-118
73 kept. There is a well established system of monthly oiling and greasing. However, other maintenance is reactive. No operation and maintenance manuals are available. Training for new staff is only provided on the job by existing experienced staff. There are no written or formal safety systems for plant operation. The treatment plant is manually controlled but the valves are operated remotely by pneumatic actuators. The plant is new and appears to be in good working order, including the alum and lime mixers. Generally, the maintenance standards are good, however the pump couplings/shafts are not adequately guarded. Logs are kept for pump running hours, load, filter backwashing, and clear water reservoir levels. However, there are no maintenance logs recording repairs to assets or maintenance/breakdown problems. Logs are kept by the laboratory staff for chemical usage and treatment parameters. Disinfection is achieved using gas chlorination. The chlorination uses one tonne cylinders. There are usually two cylinders in the chlorine house at any one time. There are two vacuum type chlorinators (Metito Mach4). Maintenance of the chlorinators is performed in-house, however the chlorinators are not periodically calibrated and records of maintenance are not kept. Operation and maintenance practices for chlorine use are poor. Ammonia solution is used to detect leaks from the pipe and from the connection joints. There are no facilities to adequately detect or contain gas leaks, in particular, no immersion tank is available. Personal breathing apparatus is available in the laboratory but is not used or maintained. The copper connection pipes are repaired locally and appear to be in poor condition. These existing pipes should be discarded and not repaired. The galvanised iron feed pipe to the contact tank is badly corroded and should be replaced. The clean water reservoirs are cleaned annually. During cleaning, the covers are removed to aid natural ventilation and to allow the workers to enter. The workers undertake the sludge removal and flushing. There are no safety precautions, safety equipment or safety systems. Sanquelim WTP The WTP consists of a 7 plant and a 5 plant. Both of these plants were commissioned around The plants are manually operated. Despite their age, the plants appear to be in good working condition. Maintenance standards appear to be reasonable across the site, except for the chemical mixing areas. The chlorine house is equipped with a one tonne cylinder and one vacuum type chlorinator. There are no standbys. Logs are maintained for pump run hours, load, chemical use and treatment parameters. M31-119
74 Table M Summary of Asset Register of Sanquelim Water Treatment Plant (1) Sanquelim Plant, 5 and 7 Raw Water Intake & Raw Water Transmission Facility Treatment Facility Chemical Feeding Facility Name of Facility Connecting Pipe & Jack Well 5 7 Contents of Facility Remarks Contents of Facility Remarks D5mm CIP 1 Line, Valvant River Jack Well: D6.2 m Pump & Motor Vertical Pump: Q 216m 3 /hr H 75m 75kw 1 unit, Q 324m 3 /hr H 75m 1kw 2 units, Q 375m 3 /hr H 75m 11kw 1 unit (1 or 2 Standby) Raw Water Transmission Main D35mm 6m C.I.P. 1 Line D45mm 6m C.I.P./M.S.P. 1 Line Aerator Cascade Type: 1 unit Cascade Type: 1 unit Parshal Flume 1 unit (for Chemical Dosing) 1 unit (for Chemical Dosing) Clariflocculator Circular Horizontal Flow Type with Center Feed/Peripheral Collection Flocculation & Clarifier: D 13.6m (Flocc. Zone 3.4m) WD 3.2m 1 unit Detention Period: Flocculation 8.min Clarifier 2. hrs Surface Loading: 38.6 m 3 /m 2 /d (26.8 mm/min) 2) Filter Gravity Rapid Sand Filter Type Alum Feeding Facility Lime Feeding Facility W 5.55m L 5.m 2cells/basin 2 basins Effective Size of Sand:.??mm, Depth of Sand:.65m Filter Area: 13.9 m 2 /cell, 27.8 m 2 /basin Filtration Rate: 3.9 m/hr 3) (94.6 m/d) Air Scouring Rate:??m/hr/cell 4 ) (?? m 3 /min/m 2 /cell) Backwash Rate: 8.4 m/hr/cell 5) (.14 m 3 /min/m 2 /cell) Dry Aluminum Sulfate Solution Tank: 3 units Powder Lime Solution Tank: 3 units Disinfection Facility Liquid Chlorine (1 tone Container net 9kg) Chlorinator: 2 units Laboratory Frequency of Sampling & Clear Water Transmission Analysis Clear Water Reservoir Volume=8 m 3 1 unit, Retention Time:3.8 hr 1): 2~2.5 hrs 2): 3~4m 3 /m 2 /d Based on Specifications of Air Blower & Backwash Pump 3): 4.8~6.m/hr 4): 36~54m/hr 5): 24~36m/hr Facility Note: 1) ~ 4) are referring to Manual on Water Supply and Treatment, Third Edition Revised and Updated, May 1999 Circular Horizontal Flow Type with Center Feed/Peripheral Collection Flocculation & Clarifier: D 2.m (Flocc. Zone 5.m) WD 3.35m 1 unit Detention Period: Flocculation 12.9min Clarifier 3.2hrs Surface Loading: 24.9 m 3 /m 2 /d (17.3 mm/min) 2) Gravity Rapid Sand Filter Type W 5.1m L 2.6m 2cells/basin 3 basins Effective Size of Sand:.??mm, Depth of Sand:.65m Filter Area: 6.65 m 2 /cell, 13.3 m 2 /basin Filtration Rate: 7.7 m/hr 3) (185 m/d) Air Scouring Rate:??m/hr/cell 4 ) (?? m 3 /min/m 2 /cell) Backwash Rate: 12 m/hr/cell 5) (.2 m 3 /min/m 2 /cell) Dry Aluminum Sulfate Solution Tank: 3 units Powder Lime Solution Tank: 3 units Liquid Chlorine (1 tone Container net 9kg) Chlorinator: 2 units Not In-Service, Jar Test: Not in Service Every Hour: ph, R-Cl Fortnightly: Turbidity, ph, Alkalinity, Hardness, Chlorine, Mn, Fe, D.O.,R-Cl Volume=1, m 3 1 unit, unit, Retention Time: 3.4 hr Design Cap. of Intake Pump = 13~16 1): 2~2.5 hrs 2): 3~4m 3 /m 2 /d Based on Specifications of Air Blower & Backwash Pump 3): Higher than standard (4.8 ~ 6.m/hr) 4): 36~54m/hr 5): 24~36m/hr M31-12
75 (2) Podocem Plant, 4 Raw Intake & Raw Water Transmission Facility Treatment Facility Name of Facility Contents of Facility Remarks Water Intake Well D8.m H 3.5m 1 unit Valvant River Connecting Pipe D9mm H 13m 1 unit Jack Well & P. H. D8.m H 21.m 1 Line Pump & Motor Vertical Pump: Q 835m 3 /hr H 14.m 456kw 3 units (1 Standby) Design Cap. of Intake Pump = 4/system Rising Main D75mm 636m M.S.P. 1 Line Stilling Chamber W 3.m L 3.m WH 3.1m Vol 27.9m 3 1 unit RP 1min RP: Retention period Aerator Cascade Type: 1 unit Parshal Flume 1 unit (for Chemical Dosing) Contact Aeration D 17.m WH 5.m Vol 1,135m 3 1 unit RP 38.9min RP: Retention period Tank Flash Mixer 1 unit with Flocculation Channel Clarifier Sludge Blanket Lamella Clarifier with PVC Tube Modules: 14.m L 14.m WH 5.m 2 units Detention Period: Clarifier 1.1 hrs 1) Surface Loading for Clarifier: 17.1 m 3 /m 2 /d (74.4 mm/min) 2) 1): 2~2.5 hrs 2): 3~4m 3 /m 2 /d Filter Gravity Rapid Sand Filter Type Based on W 4.5m L 9.5m 2cells/basin 4 basins Effective Size of Sand:.??mm, Depth of Sand:.??m Filter Area: 21.4 m 2 /cell, 42.8 m 2 /basin Specifications of Air Blower & Backwash Pump Filtration Rate: 1.2 m/hr 3) (245 m/d) 3): Higher than Air Scouring Rate: 7.2m/hr/cell 4 ) (.12m 3 /min/m 2 /cell) Standard(4.8 ~ Backwash Rate: 28.2m/hr/cell 5) (.47m 3 /min/m 2 /cell) using 6.m/hr) 6m3 Backwash Tank 4): 36~54m/hr 5): 24~36m/hr Dirty Water Sump D 13.m WH 1.5m Vol 199m 3 1 unit Clear Water Parshal Flume 1unit for Post-Chlorination Transmission Clear Water Total Volume=5, m 2units Facility Reservoir Retention Time: 4.6 hr Chemical Alum Feeding Dry Aluminum Sulfate Feeding Facility Facility Solution Tank: 3 units Lime Feeding Powder Lime Facility Solution Tank: 3 units Disinfection Facility Liquid Chlorine (1 tone Container net 9kg) Chlorinator: 3 units Laboratory Frequency of In-Service, Jar Test: Not in Service Sampling & Every Hour: ph, Turbidity, R-Cl, D.O. Analysis Fortnightly: 2 Parameters Note: 1) ~ 4) are referring to Manual on Water Supply and Treatment, Third Edition Revised and Updated, May 1999 M31-121
76 Valvant River intake Gravity Feed to Assonora WTP Jack Well/ Pump House 2 Pumps Sanquerim / Podocem WTP Schematic Sequence, not to scale Jack well/ Pump House. 3 Pumps (2 Duty) Rising Mains Rising Mains to Podocem WTP Recycle for Supernatant Water Stilling Chamber RL 126.2m Aerator Parshall Flume with Flow Meter Contact Aeration Tank RL 123.6m Alum & Lime dosing Gas Chlor. Flash Mixer RL 123.2m 5 m3 Reservoir RL m 113.m Flocculation Channel Sludge Blanket Lamella Clarifier RL 122.5m Gravity feed to Bicholim and Assonora WTP Jack well/ Pump House. 4 pumps 4 No. Rapid Sand Filters RL 121.m with 6m3 Back Wash Water Tank Raw Water Reser. 8m3 Sanquelim WTP (12 ) Rising Mains to Sanquelim WTP Alum Aerator & Lime Aerator dosing Parshall Flumes Gas Chlor. 3 No. Rapid Sand Filters with 15 m3 Back Wash Water Tank 2 No. Rapid Sand Filters with 2m3 Back Wash Water Tank 1 m3 Reservoir 8 m3 Reservoir Gravity Feed to Sanquelim Area Gravity Feed to Sanquelim Area Podocem WTP (4 ) Power Sub-Station Power Sub-Station (7 ) (5 ) Power Sub-Station Power Sub-Station Floculation 7 Clarifier Sludge Blanket Lamella Clarifier Floculation 5 Clarifier RL 124.7m Laboratory Connection Channel(Water Fall) RL 121.3m Parshall Flume with Flow Meter 5 m3 Reservoir Gravity feed to Sanquelim area Backwash Drain and Sludge Drain Dirty Water Sump RL Power Sub-Station Figure M Schematic Sequence of Sanquelim Water Treatment Plant M31-122
77 Table M Present Conditions of Sanquelim Water Treatment Plant (1/9) Background Item Covered Area for Water Supply Taluka Part of Bicholim, Tiswadi & Sattari Name of Plant Sanwuelim W.T.P. Podocem W.T.P. Number of W.T.P. Number (1) (2) Total (3) Capacity of Plant to Assonara m 3 /d 5, 7, 4, 52, Raw Water Resources River Valvant Valvant Valvant Dam Year of Construction Year Year of Commission Year Name & Number of W.T.PNumber Design Capacity of Raw Water Intake & Treated Facility Name of Facility Total m 3 /d 5,25 7,35 12,6 42, 54,6 Contents of Facility Sanwuelim W.T.P. Podocem W.T.P. (1) 5 (2) 7 Total (3) 4 Head Water Works : Raw Water Inta Intake Well Diameter m Height m Water Level HWL m MWL m Volume m 3 /unit Connecting Diameter mm Pipe Length m Material CIP Velocity m/sec Loss of Head m..1 C=11 Jack Well & Diameter m Pump House Water Depth m Height m Inlet Gate unit Volume m 3 /unit Detension Time min M.C.C. & Width m Store Room Length m Area of Floor m Raw Water 5 & 7 Raw Water to Assonora WTP Pump Capacity l/sec m 3 /min m 3 /hr m 3 /d 5,184 7,776 9, 2,4 Number unit Stand-by unit Pumps Duty 1 Total Capacity m 3 /d 12,96 4,8 Head m Maker Worthington Worthington Worthington N.G.E.F. Year of Manufacture Assessment of Condition Working, Valves Leakage Contents Sanquelim W.T.P. Podocem W.T.P. (1) (2) (3) Working Working Raw Water Res. 8m 3 Remarks Remarks :5% Losses of Nominal Capacity Remarks M31-123
78 Table M Present Conditions of Sanquelim Water Treatment Plant (2/9) Raw Water Motor Raw Water Rising Main Stilling Chamber Aerator Parshal Flume Name of Facility Contents of Facility Sanquelim W.T.P. Podocem W.T.P. (1) 5 (2) 7 Total (3) 4 5 & 7 Raw Water to Assonora WTP Motor Output HP kw Number Unit Maker Kirlosker Kirlosker Kirlosker Kirlosker CROMPTON Year of Manufacture Assessment of Condition Working Working Working Diameter mm Length m Material CIP MS + CI DIP K - 9 Velocity m/sec Loss of Head m Assessment of Pipe Good Good Good Condition Valve Good Good Good Dsign Capacity m 3 /min/unit m 3 /hr/unit ,75. m 3 /d/unit , Number Unit Width m Length m Water Depth m Volume m Retention Time min Water Level m Assessment of Condition Working Capacity m 3 /hr/unit ,75. m 3 /d/unit 5,25 7,35 42,. Number Unit Diameter m Cascade Aearator w/ Stilling Height m Chamber & Contact Aeration El. of Top Aerato m Assessment of Condition Working Working Working Assessment of Condition Working Working Working Remarks M31-124
79 Table M Present Conditions of Sanquelim Water Treatment Plant (3/9) Contact Aeration Tank Flash Mixing Basin Flash Mixer Name of Facility Total Dsign Capacity m 3 /min/unit m 3 /hr/unit ,75. m 3 /d/unit , Number Unit Diameter m Water Depth m Volume m ,134.9 Retention Time min Water Level m Assessment of Condition Working Dsign Capacity m 3 /min/unit m 3 /hr/unit ,75. m 3 /d/unit , Number Unit Width m Length m Water Depth m Volume m Retention Time min Water Level m Assessment of Condition Working Assessment of Condition Contents of Facility Sanquelim W.T.P. Podocem W.T.P. (1) 5 (2) 7 (3) Working Remarks M31-125
80 Table M Present Conditions of Sanquelim Water Treatment Plant (4/9) Clarifiers / Settling Tank (Coagulation Basin) Flocculator Drive Arrangement Name of Facility (1) 5 (2) 7 Total m 3 /min/unit Dsign Capacity m 3 /hr/unit m 3 /d/unit 5,25 7,35 21, Number Unit Type of Clarifier Circular Horizontal Flow Type with Center Feed/Peripheral Collection Width m Length m Water Depth m Overall Diameter m Flocc. Zone Dia. m Frequency of Desludging General season: Once a day Monsoon Season: Twice a day at Monsoon Volume Overall m 3 /unit , Flocculation Zone m 3 /unit Clarifying Zone m 3 /unit Retention Time Contents of Facility Sanquelim W.T.P. Podocem W.T.P. (3) 4 Flocculation Zone min Clarifying Zone min OK OK - Overall min OK Surface Area m 2 /unit Surface Loading mm/min 26.8 OK 17.3 OK 74.4? W.L. of Clarifier m Assessment of Condition Working Working Working Number unit - Assessment of Condition Working Working Number unit - Assessment of Condition Working Working Sludge Blanket Lamella Clarifier with PVC Tube Modules Remarks M31-126
81 Table M Present Conditions of Sanquelim Water Treatment Plant (5/9) Filter Filter Washing Method Backwash Pump & Motor Name of Facility Total Design Capacity m 3 /hr/unit m 3 /d/unit 2,625 2,45 1,5 Number Unit Type Rapid Sand Gravity Rapid Sand Gravity Rapid Sand Gravity w /2 m3 Backwash Tank w /15 m3 Backwash Tank w /6 m3 Backwash Tank Width m Length m Water Depth m ? Filtered Area m 2 /unit Velocity m 3 /d/m OK OK High Rate Filter Media Contents of Facility Sanquelim W.T.P. Podocem W.T.P. (1) 5 (2) 7 (3) 4 E.S. of Sand Effective Size - Effective Size - Standard Size Depth of Sand mm Type of Underdrain System Pipe with Slit Pipe with Slit Year Replacement of Media 1996 No Replacement W. L. of Filter m 121. Assessment of Condition Working Working Working Air Scouring...12 NO Rate m 3 /min/m 2 Air Scouring Time min Backwash Rate.14 NO.2 NO.47 OK 6 m3/3 min m 3 /min/m 2 Using Back Wash Tank Using Back Wash Tank + Pump? Using Back Wash Tank Backwashing Time min 1 1 3? Frequency of Washing General Season : each basin - 1 time/day General Season: 1 Time/72 hrs (2 Beds/Day) Monsoon Season : each basin - 2 times/day Monsoon Season: 1 Time/48 hrs (2 Beds/Day) Capacity m 3 /min.. 5. m 3 /hr Lifting Pump Lifting Pump Lifting Pump & Motor & Motor & Motor m 3 /d. 7,197.1 Number unit Stand-by unit Total Capacity m 3 /min... m 3 /d.. Head m Type of Pump Centrifugal Centrifugal Centrifugal Motor Output HP kw 18.5 Assessment of Condition Working Working Working Remarks M31-127
82 Table M Present Conditions of Sanquelim Water Treatment Plant (6/9) Air Blower Clear Water Collection Reservoir Dirty Water Sump Name of Facility Contents of Facility Sanquelim W.T.P. Podocem W.T.P. (1) 5 (2) 7 Total (3) 4 m 3 /min Capacity m 3 /hr 15. m 3 /d. 3,6 Number unit Stand-by unit Total Capacity m 3 /min m 3 /d. 3,6. Head Motor Output HP kw Assessment of Condition Working Working Working Number of C.W.R. Unit M.B.R. Diameter m Water Depth m Number Unit Volume m 3 8 1, 5, Total m 3 8 1, 1,8 1, Detention Time hr #DIV/! 4.6 Last Date of Cleaning Pediodical Pediodical Pediodical Water Level 117. m 113. Assessment of Condition Good Good Good Number Unit Diameter m Water Depth m Volume m 3 /unit Retention Time min Water Level m Assessment of Condition Working Remarks M31-128
83 Table M Present Conditions of Sanquelim Water Treatment Plant (7/9) Alum Feeding Facility Lime Feeding Facility Disinfection System Name of Facility Chemical Facility Contents of Facility Sanquelim W.T.P. Podocem W.T.P. (1) 5 (2) 7 Total (3) 4 Capacity kg/hr m 3 /unit Width m Length m Height m Volume m w/ Poly-Electrolite Solution Tank 8 m 3 Number Stand-by Unit 1 1 Assessment of Condition Working Working Working Capacity kg/hr m 3 /unit Diameter m Width m Length m Height m Volume m 3 8. w/ Poly-Electrolite Solution Tank 8 m 3 Number Stand-by Unit 1 1 Assessment of Condition Working Working Working Chemical Used Liquid Chlorine/Bleaching Powder Liquid Chlorine/Bleaching Powder Liquid Chlorine Type of Plant & Machinery Chlorinator Chlorinator w / Booster Pump 6m 3 /hr 5m Head Capacity kg/hr Number Stand-by Unit Safty Measures Taken Neutralization Tank(Caustic Soda) - Commissioned Assessment of Condition Working Working Working Remarks M31-129
84 Table M Present Conditions of Sanquelim Water Treatment Plant (8/9) Laboratory Name of Facility Contents of Facility Sanquelim W.T.P. Podocem W.T.P. (1) 5 (2) 7 Total (3) 4 Chemical Testing Laboratory Nil Nil Commissioned Jar Testing Nil Nil Nil Availability of Skilled Chemists Nil Nil - Availability of Required Chemicals Alum & Lime Alum & Lime Alum & Lime From Assonara Store From Assonara Store From Assonara Store Use of Test Reports Check Quality of Filter/TreaCheck Quality of Filter/Treatment As per Format Frequency of Sampling Hourly (ph, R-Cl) Hourly (ph, Turb., R-Cl, D.O.) Frequency of Sampling & Analysis Monthly : Other (Turb., ph, Alkalinity, Hardness, Chloride, Mn, Fe, 2 Parameter Tests Fortnightly D.O., Fe, R.-Cl)Test General Quality of Water Good Good Treatable Water Treatment Process Raw Water Quality Turbid., Low ph Turbid., Low ph Turbid., Low ph Clear Water Quality Good(.8NTU) Good(.8NTU) Good Transformers Number/Name of Transformer Raw Water Intake Sanquelim WTP Pole Mounted / Pad Mounted Pole Pole Pad Capacity kva Number Unit Commissioned Likely Design Life Year Last Replacement Stand-by Assessment of Condition Good Good Good Equipment Status Flow Meters Other Operating Valves Other Important Assets - - Ultrasonic - - Working Valve's Condition Working Working Working Visible Leakage and Locations Nil Nil Nil Building Condition Good Wastewater Disposal Arrangements Discharge in Nala through Sludge Chamber Recycling w/pumping Arrangement Remarks M31-13
85 Table M Present Conditions of Sanquelim Water Treatment Plant (9/9) Present Condition of Sanquelim / Podocem Water Treatment Plant No.3 Organization & Staff Deployed General Shift Shift in Plant Operation Working Hour : Shifting System Working Hour : Grouping Staff Deployed : Staff Deployed at the Plant 8:3 am 5:3 pm Junior Engineer 1 Persons Electriciann 1 Person Helper 5 Persons Total 7 Persons Total Persons Raw Water Intake: 2 Persons/Each Shift Raw Water Intake: 2 Persons/Shift 3 Groups W.T.P. : 2 Persons/Each Shift W.T.P. : 8 Persons/Shift 3 Groups Additional Staff : 4 Persons Shift in Charge : 2 Persons Management Staff - Engineers Assistant Engineer 1 D.C.E Technical Assistant 1B.E. 2 1 Junior Engineer 1 D.E.E Sub-total 1 2 Skilled Staff - Operators / Quality Testing 3 Shifting System Covering 24 Hours 1: 8: am 2: pm, 2: 2: pm 8: pm, 3: 8: pm 8: am Person 2 Plants (5 & 7 ) Plant of 4 2 Plants (5 & 7 ) Plant of 4 2 Plants (5 & 7 ) Plant of 4 Qualification Year of Service Service at plant Person Qualification Supervisor SSLC Chemist BSC(Chem) Chlorine Operator ⅩⅡ th Science Filter Operator Pump Operator 2 9 I.T.I. Electrician 1 I.T.I. 3 I.T.I. (Elec) Mechanics G-Ⅱ 3 I.T.I. 3 I.T.I. (Mech) Work Assistant Operator Assistant Operator Plumber Sub-total Unskilled Staff 4 - Workman 1, Labour 2, Sweeper 1 13 Helper-1, Sweeper-2, Gardener-1 Total Number Year of Service Service at plant M31-131
86 Table M Monthly Water Quality of Sanquelim Water Treatment Plant Analysed by PWD s Laboratory from January 23 to May 25 (1/2) Color Odor Taste Turbidity ph Specific Conductivity Total Solids (NTU) ( /u mhos/cm) (mg/l) Raw Filtered Treated Raw Filtered Treated Raw Filtered Treated Raw Filtered Treated Raw Filtered Treated Raw Filtered Treated Raw Filtered Treated Jan Feb Mar Apr May Jun Jul Aug Sep Oct Nov Dec Jan-4 Feb Mar Apr May Jun Jul Aug Oct Nov Dec-4 Jan Feb Mar Apr May Max Min Average Total Dissolved Solids(TDS) Suspended Solids Total Hardness as CaCO 3 Cl - Total Alkalinity as CaCO 3 (TA Ca Mg (mg/l) (mg/l) (mg/l) (mg/l) (mg/l) (mg/l) (mg/l) Raw Filtered Treated Raw Filtered Treated Raw Filtered Treated Raw Filtered Treated Raw Filtered Treated Raw Filtered Treated Raw Filtered Treated Jan Feb Mar Apr May Jun Jul Aug Sep Oct Nov Dec Jan-4 Feb Mar Apr May Jun Jul Aug Oct Nov Dec-4 Jan Feb Mar Apr May Max Min Average M31-132
87 Table M Monthly Water Quality of Sanquelim Water Treatment Plant Analysed by PWD s Laboratory from January 23 to May 25 (2/2) - SO 4 Fe 2+ Mn NO 3 KMnO 4 oxidizability as O 2 BOD at 27 and 3days DO (mg/l) (mg/l) (mg/l) (mg/l) (mg/l) (mg/l) (mg/l) Raw Filtered Treated Raw Filtered Treated Raw Filtered Treated Raw Filtered Treated Raw Filtered Treated Raw Filtered Treated Raw Filtered Treated Jan Feb Mar Apr May Jun Jul Aug Sep Oct Nov Dec Jan-4 Feb Mar Apr May Jun Jul Aug Oct Nov Dec-4 Jan Feb Mar Apr May Max Min Average F - Al 3+ Plate Count on nutrient agar MPN of Coliform MPN of E.Coli. (mg/l) (mg/l) no/1ml no/1ml no/1ml Raw Filtered Treated Raw Filtered Treated Raw Filtered Treated Raw Filtered Treated Raw Filtered Treated Jan ,4 1, Feb , Mar ,6 2,4 1,1 93 Apr ,4 1, May , Jun ,6 2,4 1,1 46 Jul ,6 46 1,1 24 Aug ,6 46 1,1 15 Sep ,4 1,1 1,1 24 Oct ,1 1, Nov ,4 1, Dec , Jan-4 Feb Mar ,4 1,1 1,1 46 Apr ,4 93 1,1 23 May ,4 46 1,2 93 Jun ,4 1, Jul ,6 46 2,1 93 Aug ,6 1,1 2, , Oct , Nov ,4 24 1,1 21 Dec-4 Jan ,4 24 1,1 93 Feb ,4 1, Mar Apr , May , Max ,6 2,4 2,4 46 Min Average , M31-133
88 Color Turbidity Total Solids Jan-3 Color, Pt/Co scale May-3 Sep-3 Jan-4 May-4 Aug-4 Dec-4 Apr-5 Total Solids, mg/l Jan-3 Jan-3 May-3 May-3 Sep-3 Jan-4 May-4 Aug-4 Dec-4 Apr-5 Jan-3 May-3 Sep-3 Jan-4 May-4 Aug-4 Dec-4 Sep-3 Jan-4 May-4 Aug-4 Dec-4 Apr-5 Jan-3 May-3 Sep-3 Jan-4 May-4 Aug-4 Dec ph Turbidity,NTU ph Apr Specific Conductivity 6 Total Dissolved Solids (TDS) 4 2 Jan-3 Specific Conductivity, /u mhos/cm May-3 Sep-3 Jan-4 May-4 Aug-4 Dec-4 Apr-5 TDS, mg/l Apr Suspended Solids Total Hardness as CaCO 3 1 Ca Jan-3 Suspended Solids, mg/l May-3 Sep-3 Jan-4 May-4 Aug-4 Dec-4 Apr-5 Total Hardness, mg/l Jan-3 May-3 Sep-3 Jan-4 May-4 Aug-4 Dec-4 Apr-5 Jan-3 May-3 Sep-3 Jan-4 May-4 Aug-4 Dec-4 Ca 2+, mg/l Apr Mg Cl - Total Alkalinity (TALK) Jan-3 Mg 2+, mg/l May-3 Sep-3 Jan-4 May-4 Aug-4 Dec-4 Apr-5 Cl -, mg/l Jan-3 May-3 Sep-3 Jan-4 May-4 Aug-4 Dec-4 Apr-5 Jan-3 May-3 Sep-3 Jan-4 May-4 Aug-4 Dec-4 TALK, mg/l as CaCO3 Apr-5 Raw Filtered Treated Acceptable Cause for Rejection Raw Filtered Treated Acceptable Cause for Rejection Figure M Monthly Water Quality of Sanquelim Water Treatment Plant Analysed by PWD s Laboratory from January 23 to May 25 (1/2) M31-134
89 SO Fe 2+ Mn SO42-, mg/l Jan-3 May-3 Sep-3 Jan-4 May-4 Aug-4 Dec-4 Apr-5 Fe 2+, mg/l Jan-3 May-3 Sep-3 Jan-4 May-4 Aug-4 Dec-4 Apr-5 Jan-3 May-3 Sep-3 Jan-4 May-4 Aug-4 Dec-4 Mn 2+, mg/l Apr NO KMnO 4 oxidizability day BOD at NO32-, mg/l Jan-3 May-3 Sep-3 Jan-4 May-4 Aug-4 Dec-4 Apr-5 KMnO4 oxidizabilty, mg/l as Jan-3 O2 May-3 Sep-3 Jan-4 May-4 Aug-4 Dec-4 Apr-5 Jan-3 May-3 Sep-3 Jan-4 May-4 Aug-4 Dec-4 BOD, mg/l Apr DO F -.5 Al OD, mg/l Jan-3 May-3 Sep-3 Jan-4 May-4 Aug-4 Dec-4 Apr-5 F -, mg/l Jan-3 May-3 Sep-3 Jan-4 May-4 Aug-4 Dec-4 Apr-5 Jan-3 May-3 Sep-3 Jan-4 May-4 Aug-4 Dec-4 Al 3+, mg/l Apr Plate Count on Nutrient agar at 37,24hrs, /ml MPN of Coliform, /1 ml MPN of E.Coli., /1 ml Plate Count, /ml Jan-3 May-3 Sep-3 Jan-4 May-4 Aug-4 Dec-4 Apr-5 MPN of Coliform, /1 ml Jan-3 May-3 Sep-3 Jan-4 May-4 Aug-4 Dec-4 Apr-5 Jan-3 May-3 Sep-3 Jan-4 May-4 Aug-4 Dec-4 MPN of E.Coli., /1 ml Apr-5 Raw Filtered Treated Acceptable Cause for Rejection Raw Filtered Treated Acceptable Cause for Rejection Figure M Monthly Water Quality of Sanquelim Water Treatment Plant Analysed by PWD s Laboratory from January 23 to May 25 (2/2) M31-135
90 Table M Monthly Water Quality of Podosem Water Treatment Plant Analysed by PWD s Laboratory from January 23 to May 25 (1/2) Color Odor Taste Turbidity ph Specific Conductivity Total Solids (NTU) ( /u mhos/cm) (mg/l) Raw Filtered Treated Raw Filtered Treated Raw Filtered Treated Raw Filtered Treated Raw Filtered Treated Raw Filtered Treated Raw Filtered Treated Jan-3 Feb-3 Mar-3 Apr-3 May-3 Jun Jul Aug Sep Oct Nov Dec Jan Feb Mar Apr May Jun Jul Aug Oct Nov Dec Jan Feb Mar Apr May Max Min Average Total Dissolved Solids(TDS) Suspended Solids Total Hardness as CaCO 3 (TA Ca Mg Cl Total Alkalinity as CaCO 3 (mg/l) (mg/l) (mg/l) (mg/l) (mg/l) (mg/l) (mg/l) Raw Filtered Treated Raw Filtered Treated Raw Filtered Treated Raw Filtered Treated Raw Filtered Treated Raw Filtered Treated Raw Filtered Treated Jan-3 Feb-3 Mar-3 Apr-3 May-3 Jun Jul Aug Sep Oct Nov Dec Jan Feb Mar Apr May Jun Jul Aug Oct Nov Dec Jan Feb Mar Apr May Max Min Average M31-136
91 Table M Monthly Water Quality of Podosem Water Treatment Plant Analysed by PWD s Laboratory from January 23 to May 25 (2/2) - SO 4 Fe 2+ Mn NO 3 KMnO 4 oxidizability as O 2 BOD at 27 and 3days DO (mg/l) (mg/l) (mg/l) (mg/l) (mg/l) (mg/l) (mg/l) Raw Filtered Treated Raw Filtered Treated Raw Filtered Treated Raw Filtered Treated Raw Filtered Treated Raw Filtered Treated Raw Filtered Treated Jan-3 Feb-3 Mar-3 Apr-3 May-3 Jun Jul Aug Sep Oct Nov Dec Jan Feb Mar Apr May Jun Jul Aug Oct Nov Dec Jan Feb Mar Apr May Max Min Average F - Al 3+ Plate Count on nutrient agar MPN of Coliform MPN of E.Coli. (mg/l) (mg/l) no/1ml no/1ml no/1ml Raw Filtered Treated Raw Filtered Treated Raw Filtered Treated Raw Filtered Treated Raw Filtered Treated Jan-3 Feb-3 Mar-3 Apr-3 May-3 Jun ,6 2,4 Jul ,4 1,1 Aug , Sep , Oct , Nov , Dec ,6 21 Jan , Feb Mar , Apr , May , Jun ,6 75 2,4 2 Jul ,4 24 1,1 93 Aug ,6 23 1, , Oct ,4 43 1,1 15 Nov , Dec , Jan ,4 43 1,1 23 Feb ,4 15 1,1 4 Mar , Apr , May , Max ,6 46 2,4 24 Min ,1 75 Average , M31-137
92 Color Turbidity Total Solids Jan-3 Color, Pt/Co scale May-3 Sep-3 Jan-4 May-4 Jan-5 May-5 Total Solids, mg/l Jan-3 Jan-3 May-3 May-3 Sep-3 Jan-4 May-4 Jan-5 May-5 Jan-3 May-3 Sep-3 Jan-4 May-4 Jan-5 May-5 Sep-3 Jan-4 May-4 Jan-5 May-5 Jan-3 May-3 Sep-3 Jan-4 May-4 Jan-5 May ph Turbidity,NTU ph Specific Conductivity 6 Total Dissolved Solids (TDS) 4 2 Specific Conductivity, /u mhos/cm Jan-3 May-3 Sep-3 Jan-4 May-4 Jan-5 May-5 TDS, mg/l Suspended Solids Total Hardness as CaCO 3 1 Ca Suspended Solids, mg/l Jan-3 May-3 Sep-3 Jan-4 May-4 Jan-5 May-5 Total Hardness, mg/l Jan-3 May-3 Sep-3 Jan-4 May-4 Jan-5 May-5 Jan-3 May-3 Sep-3 Jan-4 May-4 Jan-5 May-5 Ca 2+, mg/l Mg Cl - Total Alkalinity (TALK) Jan-3 Mg 2+, mg/l May-3 Sep-3 Jan-4 May-4 Jan-5 May-5 Cl -, mg/l Jan-3 May-3 Sep-3 Jan-4 May-4 Jan-5 May-5 Jan-3 May-3 Sep-3 Jan-4 May-4 Jan-5 May-5 TALK, mg/l as CaCO3 Raw Filtered Treated Acceptable Cause for Rejection Raw Filtered Treated Acceptable Cause for Rejection Figure M Monthly Water Quality of Podosem Water Treatment Plant Analysed by PWD s Laboratory from January 23 to May 25 (1/2) M31-138
93 SO Fe 2+ Mn SO42-, mg/l Jan-3 May-3 Sep-3 Jan-4 May-4 Jan-5 May-5 Fe 2+, mg/l Jan-3 May-3 Sep-3 Jan-4 May-4 Jan-5 May-5 Jan-3 May-3 Sep-3 Jan-4 May-4 Jan-5 Mn 2+, mg/l May NO KMnO 4 oxidizability 5. 3-day BOD at NO32-, mg/l Jan-3 May-3 Sep-3 Jan-4 May-4 Jan-5 May-5 KMnO4 oxidizabilty, mg/l as Jan-3 O2 May-3 Sep-3 Jan-4 May-4 Jan-5 May-5 Jan-3 May-3 Sep-3 Jan-4 May-4 Jan-5 BOD, mg/l May DO F - Al OD, mg/l Jan-3 May-3 Sep-3 Jan-4 May-4 Jan-5 May-5 F -, mg/l Jan-3 May-3 Sep-3 Jan-4 May-4 Jan-5 May-5 Jan-3 May-3 Sep-3 Jan-4 May-4 Jan-5 Al 3+, mg/l May Plate Count on Nutrient agar at 37,24hrs, /ml MPN of Coliform, /1 ml MPN of E.Coli., /1 ml Plate Count, /ml Jan-3 May-3 Sep-3 Jan-4 May-4 Jan-5 May-5 MPN of Coliform, /1 ml Jan-3 May-3 Sep-3 Jan-4 May-4 Jan-5 May-5 Jan-3 May-3 Sep-3 Jan-4 May-4 Jan-5 MPN of E.Coli., /1 ml May-5 Raw Filtered Treated Acceptable Cause for Rejection Raw Filtered Treated Acceptable Cause for Rejection Figure M Monthly Water Quality of Podosem Water Treatment Plant Analysed by PWD s Laboratory from January 23 to May 25 (2/2) M31-139
94 Table M List of Reservoirs for the Sanquelim Water Supply Scheme Inlet Pipe GLR/OHR Series Name of GLR / OHR Supply Area System Dia. Capacity Elevation (m) No. Material (Name of Location) Type (mm) (m3) RL HWL LWL Taluka Village Name 1 Sanquelim Sanquelim WTP MBR MBR 1, ACP Sanquelim GLR ACP GLR 3 3. Carapur(CT)(24) 5 25 CIP Sanquelim GLR Bicholim Sanquelim(M CI)(25) 6 5 CIP Virdi GLR ditto- Sanquelim(M CI)(25) 7 15 ACP Pariem (?) OHR ditto- Sanquelim(M CI)(25) Sub-Total 3,65 8 Podocem-1 Podocem WTP MBR 5, ditto- 9 MBR 5, ditto- 1 Curchirem GLR Bicholim Curchirem(1) DIP Sarvana GLR ditto- Bicholim(M CI)(23), Sarvona(11) DIP Bicholim GLR DIP GLR Bicholim Bicholim(M CI)(23) DIP GLR ditto- Ona(8) 15 3 CIP Mayem GLR ditto CIP GLR ditto CIP Piligao GLR ditto- Piligao(16) DIP Mulgao GLR ditto- Milgao(7) 19 OHR 45. -ditto- 2 1 PVC Maulinguem North GLR ditto- Maulinguem North(9) 21 1 CIP Ladfem GLR ditto- Latambarcem(4) Sub-Total 14,25 22 Podocem-2 15 DIP Navelim GLR Bicholim Navelim(19) Remarks DIP Honda GLR Satari Onda(21) ACP Pisurlem GLR ditto- Pissurlem(43) DIP Dignem GLR 3 9. Bicholim Cudnem(17) DIP Amona GLR ditto- Amone(18) CIP Surla GLR ditto- Cotombi(2), Surla(21), Pale(CT)(26) DIP Velgem GLR ditto- Velguem(22) w/pumping Station 29 2 CIP Pali GLR ditto- 3 2 CIP GLR ditto- Pale(CT)(26) Not in Operation Sub-Total 2,9 Total 17, Note: RL=Reduced Level (Base Elevation of GLR), HWL=High Water Level in Reservoir, LWL=Low Water Level in Reservoir, GLR=Ground Level Reservoir, OHR=Over Head Reservoir, MBR=Master Balancing Reservoir Tiswadi Maem(12), Vainguinim(13), Aturli(14), Naroa(15) Ambarim(1), Chorao(2), Caraim(3), Capao(4) w/pumping Station, Pumping to Series w/pumpimg Station, Pumping to Mayem M31-14
95 M31.6 Dabose Water Supply Scheme The scheme consists of a 5 plant, commissioned around We are told that the plant is currently running at 7 to help met demand. The raw water pump house contains two pumps (one duty) and takes water from the Madei River. The pumps are well guarded. The plant is manually operated. The plant appears to be in good working condition despite its age. There are no flow measuring devices. Security arrangements at the site are good. Maintenance standards are very good, except for at the chemical mixing areas. The chlorine house is equipped with two No. 1 tonne cylinders and one vacuum type chlorinator. There is no standby chlorinator. An immersion tank is available. The chlorination system appears to be well maintained and tidy. A standby generator is available at the site for use during power failures. Records of pump operating hours, loads, chemical use and treatment parameters are logged. Table M lists the summary of asset data for the WTP and Table M contains detailed asset data for the WTP. The plant schematic is shown on Figure M Table M and Figure M show the data on monthly water quality at Dabose Water Treatment Plant. Table M shows a list of existing reservoirs for Dabose Water Supply Scheme. M31-141
96 Table M Summary of Asset Register of Dabose Water Treatment Plant Raw Intake & Raw Water Transmission Facility Treatment Facility Name of Facility Contents of Facility Remarks Water Jack Well & D 6. m H 17.m Manderi River Connecting Pipe D4mm CIP 7.m 1 Line Pump & Motor Vertical Pump: Q 26m 3 /hr H 42m 45kw 2 units (1 Standby) Submersible Pump: Q 1m 3 /hr H 42m 2kw 1 unit Design Cap. of Intake Pump = 6.5 Raw Water D35mm 3m CIP 1 Line Transmission Main Aerator Cascade Type: 1 unit Parshal Flume & Each 1 unit (for Chemical Dosing) Flash Mixer Clarifloccculator Circular Horizontal Flow Type with Center Feed/Peripheral 1): 2~2.5 hrs Collection 2): 3~4m 3 /m 2 /d Flocculation & Clarifier: D 26.m (Flocc. Zone 3.m) WD 4.m 1 unit Detention Period: Flocculation 7.8min Clarifier 9.6hrs 1) Surface Loading for Clarifier: 1 m 3 /m 2 /d (7. mm/min) 2) Filter Gravity Rapid Sand Filter Type Based on W 4.7m L 5.m 2cells/basin 3 basins Effective Size of Sand:.??mm, Depth of Sand:.??m Filter Area: m 2 /cell, 23.5 m 2 /basin Specifications of Air Blower & Backwash Pump 3): 4.8~6.m/hr Filtration Rate: 5. m/hr 3) (74.5 m/d) 4): 36~54m/hr Air Scouring Rate: 22.2 m/hr/cell 4) (.37m 3 /min/m 2 /cell) 5): 24~36m/hr Backwash Rate: 12 m/hr/cell 5) (.2m 3 /min/m 2 /cell) Clear Water Clear Water Sump D 11.5m WD 4.m 1 unit Facility Total Volume=415 m 3 Retention Time: 2. hr Chemical Alum Feeding Dry Aluminum Sulfate Feeding Facility Facility Solution Tank: 2 units Lime Feeding Powder Lime Facility Solution Tank: 2 units Disinfection Facility Liquid Chlorine (1 tone Container net 9kg) Chlorinator: 2 units Laboratory Frequency of Not In-Service, Jar Test: Not in Service Sampling & Daily test: ph, R-Cl Analysis Fortnightly: 2 Parameters Clear Water Transmission Pump Horizontal Centrifugal Pump: Design Cap. of Transmission & Motor Q 23m 3 /hr H 95m 11kw 3 units (1 or 2 Standby) Pump = 11 Facility Rising Main D3mm CIP 15m 1 Line D35mm CIP 8m 1 Line Clear Water D 16.m WD 4.m 1 unit Reservoir (MBR) Total Volume=8 m 3 Note: 1) ~ 4) are referring to Manual on Water Supply and Treatment, Third Edition Revised and Updated, May 1999 M31-142
97 Madei River intake Dabose WTP Schematic Sequence, not to scale Jack well/ Pump House. 3 pumps Dabose WTP 5 (6.5 ) Aerator Parshall Flume Alum & Lime dosing Flash Mixer 3 No. Rapid Sand Filters Floculation Gas chlor. Gravity feed to Valpoi and surrounding villages area MBR 8m3 5 (6.5KLD) Clarifier Rising Main to MBR Clear Water Sump 4m3 Clear Water Pump House 3 Pumps Diesel Generator 25 kva Power Sub-Station Figure M Schematic Sequence of Dabose Water Treatment Plant M31-143
98 Table M Present Conditions of Dabose Water Treatment Plant (1/6) Background Item Covered Area for Water Supply Name of Plant Number of W.T.P. Capacity of Plant Taluka Part of Sattari Number (1) 5 m 3 /d 5, Contents Remarks Raw Water Resources River Madei Dam Year of Construction Year Year of Commission Expected Year Augmentation Plan M31-144
99 Table M Present Conditions of Dabose Water Treatment Plant (2/6) Name of Facility Contents of Facility Remarks Capacity of Raw Water Intake & Water Treatment Plant Head Water Works : Raw Water Intake Intake Well Connecting Pipe Jack Well & Pump House Control Room Raw Water Pump Raw Water Motor Raw Water Transmission Line Aerator Parshal Flume 5.25 : 5% Loss of Nominal Capacity m 3 /d 5,25 Diameter m 6. Height m 8. Water Depth m? Volume m 3 /unit. Water Level of River H.W.L. m? L.W.L m? Diameter mm 4 C= 11 Length m 7. D=.4 Material CIP Q=.68 Velocity m/sec.484 Loss of Head m.6 : Hazen-Williams Formula Diameter m 6. Height m 17. Water Depth m? Volume m 3 /unit Detension Time min. Width m 4. Length m 4. Area of Floor m Capacity l/sec m 3 /min m 3 /hr 26 1 m 3 /d 6,24 2,4 Number unit 2 1 Stand-by unit 1 Total Capacity m 3 /d 12,48 Not 24 hrs Running Head m Type of Pump Centrifugal Submersible Maker Year of Manufacture Assessment of Condition Water Treatment Plant Jyoti (V.T.) Working Condition Motor Output HP 6 27 kw 45 2 Number Unit 2 1 Maker Kirlosker - Year of Manufacture Assessment of Condition Working Condition Diameter mm 35 Length m 3 Material CIP Velocity m/sec.174 Loss of Head m.5 : Hazen-Williams Formula Assessment of Pipe Good Condition Valve Good Capacity m 3 /hr : Answer to Questionnare m 3 /d 5,25 4,992 Number Unit 1 Diameter m 3.65 Height m? El. of Top Aerator m? Assessment of Condition Working Number Unit 1 Assessment of Condition Working M31-145
100 Table M Present Conditions of Dabose Water Treatment Plant (3/6) Name of Facility Contents of Facility Flash Mixer Number Unit 1 Assessment of Condition Working Clarifiers / Dsign Capacity m 3 /min/unit 3.6 Settling Tank m 3 /hr/unit (Coagulation m 3 /d/unit 5,25 Basin) Number Unit 1 Type of Clarifier Circulaar Horizontal Flow Type with Center Feed /Peripherical Collection Water Depth m 4. Overall Diameter m 26. Flocc. Zone Dia. m 3. Frequency of Desludging Once a Day : General Season Twice a Day : Monsoon Season Volume Overall m 3 /unit 2,123.7 Flocculation Zone m 3 /unit 28.3 Clarifying Zone m 3 /unit Retention Time Flocculation Zone min 7.8 Clarifying Zone min OK Overall min Surface Area m 2 /unit Surface Loading mm/min 7. OK W.L. of Clarifier m? Assessment of Condition Working Flocculator & Number unit 1 Drive Assessment of Condition Arrangement Working Filter Design Capacity m 3 /hr/unit 72.9 m 3 /d/unit 1,75 Number Type Unit 3 Rapid Sand Gravity Filter Width m 5. Length m 4.7 Water Depth m? Filtered Area m 2 /unit 23.5 Velocity Filter Media m 3 /d/m OK Standard Size E.S. of Sand mm? : E.S. = Effective Size Depth of Sand mm? Type of Underdrain System Year Replacement of Media? Replacement (Year: Jun. '5) W. L. of Filter m? Assessment of Condition Working Filter Air Scouring NO m 3 /min/m 2.37 Washing Rate Criteria & Method Air Scouring Time Backwash Rate min m 3 /min/m 2 5 NO.2 Backwashing Time min 1 Frequency of Washing General : Once a Day Maximum : Once a Day Remarks M31-146
101 Table M Present Conditions of Dabose Water Treatment Plant (4/6) Backwash Pump & Motor Air Blower Clear Water Reservoir (Sump) Name of Facility Chemical Facility Alum Feeding Facility Capacity m 3 /min 5.46 m 3 /hr m 3 /d 7,862 Number unit 2 Stand-by unit 1 Total Capacity m 3 /min 5.46 m 3 /d 7,862.4 Head Type of Pump m 17. Centrifugal Motor Output HP kw 26. Assessment of Condition Working Capacity m 3 /min 8.8 m 3 /hr 528. m 3 /d 12,672 Number unit 2 Stand-by unit 1 Total Capacity m 3 /min 8.8 m 3 /d 12,672 Head Motor Output mm WG HP kw 9.3 Maker Assessment of Condition Working Diameter m 11.5 Water Depth m 4. Number Unit 1 Volume m Total m Detention Time hr 2. Last Date of Cleaning Pediodical Water Level? m? Assessment of Condition Working Capacity kg/hr m 3 /unit 2. Diameter m Width m Length m Height m Volume m 3 Number 2 Unit Stand-by Assessment of Condition Working Contents of Facility Remarks M31-147
102 Table M Present Conditions of Dabose Water Treatment Plant (5/6) Lime Feeding Facility Disinfection System Laboratory Name of Facility Contents of Facility Remarks Capacity kg/hr m 3 /unit 1. Diameter m Width m Length m Height m Volume m 3 Number 2 Unit Stand-by Assessment of Condition Working Chemical Used Liquid Chlorine Type of Plant & Machinery Pre & Post Capacity kg/hr 2. Number 2 Unit Stand-by Safty Measures Taken Commissioned Assessment of Condition Chemical Testing Laboratory Jar Testing Availability of Skilled Chemists Availability of Required Chemicals Use of Test Reports Frequency of Sampling & Analysis General Quality of Water Raw Water Quality Clear Water Quality Clynder Emercing Tank 1992 Working Condition Not Provided? 3Persons From Assonora Store :? month store As per Format ph & Residual Cl : 3 Times/Day 2 Parameters Test : 2 Times/Month? Treatable with conventional Water Treatment Process Turbid., Low ph Excellent Transformers Number of Transformer (1) (2) (3) Pole Mounted / Pad Mounted Pole Pole Floor Capacity kva Number Unit Stand-by 1 : Diesel Generator: 25 kva Commissioned Old Set Likely Design Life Year Last Replacement Nil Nil Nil Assessment of Condition Good Good Good Equipment Status Flow Meters Other Operating Valves Other Important Assets Valve's Condition Visible Leakage and Locations Building Condition Wastewater Disposal Arrangements No Flow Meters Working Working Condition Good Sludge Chamber Connected to Nalla M31-148
103 Table M Present Conditions of Dabose Water Treatment Plant (6/6) Name of Facility Transmission (Clear Water) Facility Transmission (Clear Water) Pump Capacity l/sec m 3 /min m 3 /hr m 3 /d 5,52 5,52 Number 2 1 Stand-by unit 1 1 Total Capacity m 3 /d 5,52 Head m Type of Pump Centrifugal Pump Maker M & Platt Year of Manufacture 1992 Old Assessment of Condition Transmission Motor Output Pump Valve HP Working Condition Working Condition (Clear Water) kw Motor Number Unit 2 1 Raising Main (Transmissio n Lines) Master Balancing Reservoir (M.B.R.) Maker Kirlosker Year of Manufacture 1992 Old Assessment of Condition Working Condition Diameter mm 35 3 Length m 8 15 Material CIP CIP Velocity m/sec Total Loss of Head m : Hazen-Williams Formula Assessment of Pipe Condition Valve Diameter m 16. Water Depth m 4. Number Unit 1 Volume m 3 84 Total m 3 84 Detention Time hr 3.9 Last Date of Cleaning Water Level m Assessment of Condition Organization & Staff Deployed General Shift Working Hour : Staff Deployed : Shift in Plant Operation Shifting System Working Hour : Grouping Staff Deployed : Contents of Facility Working Condition Working Condition Pediodical?? Working Condition 8:3 17:3 (13: 14. : Lunch Time) Management Staff - Engineers Manager Mechanics Sweeper Helper Total 3 Shifting System Covering 24 Hours 1: 8: 14:, 2: 14: 2:, 3: 2: 8: Manager, Electrician, Lab - Total Assistant, Operator, Helper & 1 Persons/Groupe Security Year of Service at Staff Deployed at the Plant Person Qualification Service plant Management Staff - Engineers Assistant Engineer 1 D.C.E Junior Engineer 1 D.C.E Sub-total 2 Skilled Staff - Operators / Quality Testing Manager 2 Graduate 6 6 Mechanics 1 I.T.I Electrician 3 I.T.I Lab - Assistant 3 I.T.I Operator 9 I.T.I Sub-total 18 Unskilled Staff Total Number Helper, Sweeper, Security Guards Remarks 1 Person 1 Person 2 Persons 5 Persons 9 Persons PWD's Staff Goa PWD Labour Society's Staff (Yearly Contract Basis) M31-149
104 Table M Monthly Water Quality of Dabose Water Treatment Plant Analysed by PWD s Laboratory from January 23 to May 25 (1/2) Color Odor Taste Turbidity ph Specific Conductivity Total Solids (NTU) ( /u mhos/cm) (mg/l) Raw Filtered Treated Raw Filtered Treated Raw Filtered Treated Raw Filtered Treated Raw Filtered Treated Raw Filtered Treated Raw Filtered Treated Jan Feb Mar Apr May Jun Jul Aug Sep Oct Nov Dec Jan Feb Mar Apr May Jun Jul Aug Oct Nov Dec Jan Feb Mar Apr May Max Min Average Total Dissolved Solids(TDS) Suspended Solids Total Hardness as CaCO 3 Cl - Total Alkalinity as CaCO 3 (TA Ca Mg (mg/l) (mg/l) (mg/l) (mg/l) (mg/l) (mg/l) (mg/l) Raw Filtered Treated Raw Filtered Treated Raw Filtered Treated Raw Filtered Treated Raw Filtered Treated Raw Filtered Treated Raw Filtered Treated Jan Feb Mar Apr May Jun Jul Aug Sep Oct Nov Dec Jan Feb Mar Apr May Jun Jul Aug Oct Nov Dec Jan Feb Mar Apr May Max Min Average M31-15
105 Table M Monthly Water Quality of Dabose Water Treatment Plant Analysed by PWD s Laboratory from January 23 to May 25 (2/2) - SO 4 Fe 2+ Mn NO 3 KMnO 4 oxidizability as O 2 BOD at 27 and 3days DO (mg/l) (mg/l) (mg/l) (mg/l) (mg/l) (mg/l) (mg/l) Raw Filtered Treated Raw Filtered Treated Raw Filtered Treated Raw Filtered Treated Raw Filtered Treated Raw Filtered Treated Raw Filtered Treated Jan Feb Mar Apr May Jun Jul Aug Sep Oct Nov Dec Jan Feb Mar Apr May Jun Jul Aug Oct Nov Dec Jan Feb Mar Apr May Max Min Average F - Al 3+ Plate Count on nutrient agar MPN of Coliform MPN of E.Coli. (mg/l) (mg/l) no/1ml no/1ml no/1ml Raw Filtered Treated Raw Filtered Treated Raw Filtered Treated Raw Filtered Treated Raw Filtered Treated Jan Feb , Mar ,4 1,1 1,1 21 Apr , May Jun ,6 1,1 2,4 24 Jul , Aug ,4 46 1,1 93 Sep , Oct ,4 24 1,1 21 Nov ,1 24 1,1 21 Dec ,4 1, Jan ,4 24 2,46 43 Feb , Mar , Apr , May ,4 24 1,1 21 Jun , Jul ,6 46 1,5 24 Aug ,6 1,1 1, ,4 1,1 1,1 24 Oct ,4 1,1 2,4 1,1 Nov , Dec , Jan , Feb , Mar , Apr May Max ,6 1,1 2,46 1,1 Min Average , M31-151
106 Color Turbidity Total Solids Jan-3 Color, Pt/Co scale May-3 Sep-3 Jan-4 May-4 Jan-5 May-5 Total Solids, mg/l Jan-3 Jan-3 May-3 May-3 Sep-3 Jan-4 May-4 Jan-5 May-5 Jan-3 May-3 Sep-3 Jan-4 May-4 Jan-5 Sep-3 Jan-4 May-4 Jan-5 May-5 Jan-3 May-3 Sep-3 Jan-4 May-4 Jan ph Turbidity,NTU ph May Specific Conductivity 6 Total Dissolved Solids (TDS) 4 2 Specific Conductivity, /u mhos/cm Jan-3 May-3 Sep-3 Jan-4 May-4 Jan-5 May-5 TDS, mg/l May Suspended Solids Total Hardness as CaCO 3 1 Ca Jan-3 Suspended Solids, mg/l May-3 Sep-3 Jan-4 May-4 Jan-5 May-5 Total Hardness, mg/l Jan-3 May-3 Sep-3 Jan-4 May-4 Jan-5 May-5 Jan-3 May-3 Sep-3 Jan-4 May-4 Jan-5 Ca 2+, mg/l May Mg Cl - Total Alkalinity (TALK) Jan-3 Mg 2+, mg/l May-3 Sep-3 Jan-4 May-4 Jan-5 May-5 Cl -, mg/l Jan-3 May-3 Sep-3 Jan-4 May-4 Jan-5 May-5 Jan-3 May-3 Sep-3 Jan-4 May-4 Jan-5 TALK, mg/l as CaCO3 May-5 Raw Filtered Treated Acceptable Cause for Rejection Raw Filtered Treated Acceptable Cause for Rejection Figure M Monthly Water Quality of Dabose Water Treatment Plant Analysed by PWD s Laboratory from January 23 to May 25 (1/2) M31-152
107 SO Fe 2+ Mn SO42-, mg/l Jan-3 May-3 Sep-3 Jan-4 May-4 Jan-5 May-5 Fe 2+, mg/l Jan-3 May-3 Sep-3 Jan-4 May-4 Jan-5 May-5 Jan-3 May-3 Sep-3 Jan-4 May-4 Jan-5 Mn 2+, mg/l May NO KMnO 4 oxidizability 3-day BOD at NO32-, mg/l Jan-3 May-3 Sep-3 Jan-4 May-4 Jan-5 May-5 KMnO4 oxidizabilty, mg/l as O2 Jan-3 May-3 Sep-3 Jan-4 May-4 Jan-5 May-5 Jan-3 May-3 Sep-3 Jan-4 May-4 Jan-5 BOD, mg/l May DO F -.6 Al OD, mg/l Jan-3 May-3 Sep-3 Jan-4 May-4 Jan-5 May-5 F -, mg/l Jan-3 May-3 Sep-3 Jan-4 May-4 Jan-5 May-5 Jan-3 May-3 Sep-3 Jan-4 May-4 Jan-5 Al 3+, mg/l May Plate Count on Nutrient agar at 37,24hrs, /ml MPN of Coliform, /1 ml MPN of E.Coli., /1 ml Plate Count, /ml Jan-3 May-3 Sep-3 Jan-4 May-4 Jan-5 May-5 MPN of Coliform, /1 ml Jan-3 May-3 Sep-3 Jan-4 May-4 Jan-5 May-5 Jan-3 May-3 Sep-3 Jan-4 May-4 Jan-5 MPN of E.Coli., /1 ml May-5 Raw Filtered Treated Acceptable Cause for Rejection Raw Filtered Treated Acceptable Cause for Rejection Figure M Monthly Water Quality of Dabose Water Treatment Plant Analysed by PWD s Laboratory from January 23 to May 25 (2/2) M31-153
108 Table M List of Reservoirs for the Dabose Water Supply Scheme Series No. Inlet Pipe Name of GLR / OHR Dia. Capacity Material (Name of Location) Type GLR/OHR Elevation (m) (mm) (m3) RL HWL LWL 1 Dabose WTP GLR CIP Dabose MBR GLR Supply Area (Village Name) Compordem(25), Edorem(26), Satorem(39), Mauzi(4), Codiem(46), Naguem(47), Ansolem(48), Codqui(56), Sanvoreem(57) 3 1 ACP Kudshe GLR w/ Pumping Station Cudeem(49), Sanvordem(5), Sonal(51), Veguem(55) 4 15 DIP GLR ACP Nagargao GLR w/ Pumping Station Bombedem(36), Ambedem(37), Nagargao(38) 6 1 DIP GLR PVC Dabe GLR w/ Pumping Station 8 1 DIP Zormen(23), Dabem(24), Mauzi(4) 9 1 DIP Zarme GLR w/ Pumping Station 1 1 DIP GLR ACP Pali GLR w/ Pumping Station DIP GLR Choraundem(7), Ivrem-Buzruco(8), Ivrem-Curdo(9), ACP Hivre GLR Rivem(15), Dongurli(16), Pale(17) w/ Pumping Station 14 1 DIP GLR CIP Vapoi Town GLR Valpoi(M CI)(75) 16 1 ACP Cottorem GLR Guleili(61), Damocem(64), Cotorem(65), w/ Pumping Station DIP GLR Cnquirem(74) ACP Padeli GLR w/ Pumping Station Advoi(58), Vantem(6), Padeli(62), Birondem(63) 19 1 DIP GLR ACP Bhuipal GLR w/ Pumping Station Saleli(22), Buimpal(41) 21 2 DIP GLR ACP Morley Colony GLR w/ Pumping Station Ponsuli(6), Gululem(18) 23 1 ACP OHR ACP Davem GLR Satrem(12), Derodem(13), Codel(14), Mololi(31) w/ Pumping Station DIP GLR Monorem(32), Vainguinim(33), Ustem(34), Davem(35) (2 step pumping) Kalambolim BK GLR Carambolim-Brama(28) Total 7, hrs Note: RL=Reduced Level (Elevation of Basement of Reservoir), HWL=High Water Level in Reservoir, LWL=Low Water Level in Reservoir, GLR=Ground Level Reservoir, OHR=Over Head Reservoir, MBR=Master Balancing Reservoir Remarks M31-154
109 M31.7 Canacona Water Supply Scheme The Canacona facility consists of a 5 plant commissioned in Raw water is sourced from the Tapona River as well as the Chapoli Dam which came into operation in The river intake has a jack well with 3 pumps (this was locked at the time of visit and therefore we could not assess the condition). The Dam intake pump house was equipped with 3 number 1HP pumps and a small submersible pump (not adequately guarded). The rising main to the plant is approximately 8.5km long. Table M lists the summary of asset data for the WTP and Table M contains detailed asset data for the WTP. The plant schematic is shown on Figure M The raw water pump house and treatment plant are situated in separate compounds. Both compounds were adequately gated, fenced and secured by 24 hour on-site security personnel. The plant is manually operated. The plants operate 24 hours a day, using a three shift system. Measurement of water supplied to and leaving the plant does not occur. The pump house for the dam raw water intake has three pumps (one duty). Each pump has a capacity of 1HP. A small submersible pump is used to augment supplies rather than operating a second large pump. Site maintenance is good, except that the drive couplings/shafts are not guarded. Apart from regular oiling and greasing, maintenance tends to be reactive. No operation and maintenance manuals are available and training for new staff is only provided on the job by existing experienced staff. There are no written or formal safety systems for plant operation. The treatment plant is manually operated. Most equipment appears to be in good working order with the exception of the flash mixer and the clarifier. These two items were not working at the time of the visit. Generally, site maintenance is good. A record of run hours, loads, etc is maintained. Maintenance records are not logged. The plant has a small on-site laboratory and a log is kept of the usual treatment parameters as well as chemical usage. Disinfection is achieved using gas chlorination. Bleaching powder is added manually as a M31-155
110 back-up. The chlorination facilities are not fully contained. Chlorination is achieved using one tonne cylinders. There are usually two cylinders in the chlorination facilities at any one time. There is one vacuum type chlorinator (no standby). Chlorinator maintenance is performed in-house, however the chlorinators are not periodically calibrated and maintenance records are not kept. Spare parts for the chlorination facilities are not kept on-site. Chlorination maintenance, installation methods and operation practices are poor. The only facility to detect or contain gas leaks is an immersion tank. The immersion tank was empty at the time of the site visit. Flexible rubber hose (not copper tubing) is used to connect the cylinders to the chlorinator. This is not a safe practice. A poor quality flexible plastic hose was used as the feeder pipe to the contact tanks. The hose was unprotected. This is not a safe practice and should be rectified immediately. Gas masks are provided (canister type). However, in general, there was a poor understanding and awareness of the safety issues associated with the chlorination process. Table M and Figure M show the data on monthly water quality at Canacona Water Treatment Plant. Table M shows a list of existing reservoirs for Canacona Water Supply Scheme. M31-156
111 Table M Summary of Asset Register of Canacona Water Treatment Plant Raw Intake & Raw Water Transmission Facility Name of Facility Contents of Facility Remarks Water Jack Well & Raw Jack Well: D 12. m H 3.5m 1 unit Talapona River water Sump Raw Water Sump: Volume= 4m 3 Chapoli Dam Pump & Motor Jack Well - Vertical Pump: Q 18m 3 /hr H 87.m 75kw 3units (2 Under Installation), Raw Water Sump; Horizontal Centrifugal Pump: Q 19m 3 /hr H 82.m 45kw 3units (2 Standby) Submersible Pump: Q 6m 3 /hr 1 unit Rising Main D35mm 2,7m CIP 1 Line : Talapona D4mm 5,87m CIP 1 Line : Chapoli Treatment Aerator Cascade Type: 1 unit Facility Parshal Flume 1 unit (for Chemical Dosing) Clarifloccculator Circular Horizontal Flow Type with Center Feed/Peripheral Collection Flocculation & Clarifier: D 14.m (Flocc. Zone 7.m) WD 3.5m 2 unit Detention Period: Flocculation 38.8min Clarifier 1.9 hrs 1) Surface Loading for Clarifier: 43.3 m 3 /m 2 /d (3.1 mm/min) 2) Filter Gravity Rapid Sand Filter Type Based W 4.8m L 4.8m 2cells/basin 2 basins Effective Size of Sand:.??mm, Depth of Sand:.??m Filter Area: 11.5 m 2 /cell, 23. m 2 /basin Filtration Rate: 4.5 m/hr 3) (18 m/d) Air Scouring Rate: 51m/hr/cell 4 ) (.??m 3 /min/m 2 /cell) Backwash Rate: 25.8m/hr/cell 5) (.43m 3 /min/m 2 /cell)- Using 5m 3 Backwash Tank Clear Water Clear Water GLR-Volume=8 m 3 2units, OGR- Volume=3 m 3 1unit Transmission Reservoir (MBR) Retention Time: 7.7 hr Facility Lifting Pump to Horizontal Centrifugal Pump: Q 169.2m 3 /hr H 3.m 22kw OHR 2units (1 Standby) Chemical Alum Feeding Dry Aluminum Sulfate Feeding Facility Facility Solution Tank: 1 unit Lime Feeding Powder Lime Facility Solution Tank: 1 unit Disinfection Facility Liquid Chlorine (1 tone Container net 9kg) Chlorinator: 1 unit Laboratory Frequency of In-Service, Jar Test: Not in Service Sampling & Every Hour: ph, Turbidity, R-Cl Analysis Fortnightly: 2 Parameters Note: 1) ~ 4) are referring to Manual on Water Supply and Treatment, Third Edition Revised and Updated, May 1999 Design Cap. of Intake Pump = 8.8 1): 2~2.5 hrs 2): 3~4m 3 /m 2 /d on Specifications of Air Blower & Backwash Pump 3): 4.8~6.m/hr 4): 36~54m/hr 5): 24~36m/hr M31-157
112 Chapoli Dam intake Canacona WTP Schematic Sequence, not to scale Talapona River intake 1 - Submersible Pump 6 m3/hr Raw Water Sump 4m3 Chapoli Raw Water Pump House 3 Pumps Rising Main D4mm CIP L= 5.87km Jack Well/ Pump House. 3 pumps (2 Pumps : Not Fixed Piping) Power Sub-Station Power Sub-Station Rising Main D35mm CIP L= 2.7km Canacona WTP (5 ) Aerator Parshall Flume with Flow Meter Alum & Lime dosing Floculation 2 No. Rapid Sand Filters with 5m3 Back Wash Water Tank Laboratory Gravity Feed to Agonda 5m3 GLR 5 Clarifier Filtered Water Meter M 3 m3 OHR Lifting Pumps 2 Pumps 8m3 GLR 8m3 GLR Gravity Feed to Supply Area 7 Supply Lines Gas chlor. Figure M Schematic Sequence of Canacona Water Treatment Plant M31-158
113 Table M Present Conditions of Canacona Water Treatment Plant (1/4) Item Contents Remarks Background Covered Area for Water Supply Number of W.T.P. Capacity of Plant Taluka Canacona Number (1) 5 m 3 /d 5, Raw Water Resources River Talapona Dam Chapoli Year of Construction Year Year of Commission Year 1983 Expected Augmentation Plan 1 Under Tendering 3 Pressurized Filter (from Opa) Capacity of Raw Water Intake & 5. Water Treatment Plant m 3 /d 5, Head Water Works : Raw Water Intake Name of Raw Water Talapona Chapoli Intake Well Diameter m 1. Height m 7. Water Depth m Volume m 3 /unit. Water Level of River H.W.L. m L.W.L m Connecting Diameter mm Pipe Length m Material Velocity m/sec #DIV/! C=11 Loss of Head m #DIV/! : Hazen-Williams Formula Jack Well & Jack Well Pump House Raw Water Sump Pump Diameter m 12. House/Raw Height m 3.5 Water Sump Water Depth m Volume m 3 /unit 4 Detension Time min. Control Width m Room Length m Area of Floor m 2 5. Raw Water Pump Raw Water Motor Name of Facility Capacity Contents of Facility Chapoli Talapona l/sec m 3 /min m 3 /hr m 3 /d 4,56 1,44 4,32 Number unit Stand-by unit 2 2 : Under Installation Total Capacity m 3 /d 5, 4, Head m Type of Pump Centrifugal Submersible Centrifugal Maker KBL KBL Year of Manufacture Assessment of Condition Working, Valves Need Replacement Working Motor Output HP 6 1 kw Number Unit 3 3 Remarks Maker KBL KBL Year of Manufacture Assessment of Condition Working Raw Water Diameter mm 35 4 Transmission Length m 2,7 5,87 Line Material CIP CIP Velocity m/sec Loss of Head m : Hazen-Williams Formula Assessment of Pipe Working Condition Condition Valve Working Condition Transformers Number of Transformer (1) Talapona (2) Chapoli WTP's Transformer belong to Pole Mounted / Pad Mounted Pad Pad Electric Dep. Capacity kva 2 3 Number 2 2 Unit Stand-by - - Commissioned Likely Design Life Year Last Replacement - - Assessment of Condition Working Working M31-159
114 Table M Present Conditions of Canacona Water Treatment Plant (2/4) Name of Facility Water Treatment Plant Aerator Capacity m 3 /hr 28.3 m 3 /d 5, Number Unit 1 Diameter m 3. Height m 5. El. of Top Aerator m? Assessment of Condition Working Parshal Number Unit 1 Flume w/ Assessment of Condition Working Clarifiers / Settling Tank (Coagulation Basin) Flocculator & Drive Arrangement Filter Filter Washing Criteria & Method Dsign Capacity m 3 /min/unit 3.5 m 3 /hr/unit 28.3 m 3 /d/unit 5, Number Unit 1 Type of Clarifier Feed/Peripherical Collection Water Depth m 3.5 Overall Diameter m 14. Flocc. Zone Dia. m 7. Frequency of Desludging Once a Day : General Season Twice a Day : Monsoon Season Volume Overall m 3 /unit Flocculation Zone m 3 /unit Clarifying Zone m 3 /unit 44.1 Retention Time Flocculation Zone min 38.8 OK Clarifying Zone min Less Time Overall min Surface Area m 2 /unit Surface Loading mm/min 3.1 OK W.L. of Clarifier m Assessment of Condition Working Condition Number unit 1 Assessment of Condition Working Design Capacity m 3 /hr/unit 14.2 m 3 /d/unit 2,5 Number Unit 2 Contents of Facility Circular horizontal Flow Type with Center Type Rapid Sand Gravity Filter Width m 4.8 Twin of Size Length m 4.8 Water Depth m? Filtered Area m 2 /unit 23. Velocity m 3 /d/m OK Remarks with 5 m3 Back Wash Tank Filter Media Standard Size - Good Condition E.S. of Sand mm? : E.S. = Effective Size Depth of Sand mm? Type of Underdrain System Year Replacement of Media? 24 (Every 2 Year) W. L. of Filter m? Assessment of Condition Working Condition Air Scouring Rate m 3 /min/m 2 Air Scouring Time Backwash Rate min m 3 /min/m 2 5. OK.43 Backwashing Time min 1 ~ 15 Frequency of Washing General : Once a Day Monsoon : 2 ~ 3 Times/Day M31-16
115 Table M Present Conditions of Canacona Water Treatment Plant (3/4) Backwash Pump & Motor Air Blower Master Balancing Reservoir (M.B.R.) / O.H.R. : Clear Water Reservoir Name of Facility Capacity m 3 /min m 3 /hr m 3 /d Number unit 2 Stand-by unit 1 Total Capacity m 3 /min m 3 /d Head Type of Pump m 21/3 Centrifugal Motor Output HP kw 5.5 Assessment of Condition Working Capacity m 3 /min m 3 /hr m 3 /d Number unit 2 Stand-by unit 1 Total Capacity m 3 /min Head Motor Output m 3 /d mm WG HP 3. kw 2. Assessment of Condition Working Diameter m 16. Water Depth m 4. Number Unit 2 Volume m Total m 3 1,6 Detention Time hr 7.7 Last Date of Cleaning Water Level m Pediodical Contents of Facility Assessment of Condition Working Working Lifting to Capacity m 3 /min O.H.R. Pump m 3 /hr & Motor m 3 /d Number unit 2 Stand-by unit 1 Total Capacity m 3 /min m 3 /d Head Type of Pump m 3. Centrifugal Motor Output HP 3. kw 22. Assessment of Condition Working Chemical Facility Alum Feeding Capacity Facility kg/hr m 3 /unit Diameter m Width m Length m Height m Volume m 3 Number 1 Unit Stand-by Assessment of Condition Working Lifting Pump & Motor Remarks M31-161
116 Table M Present Conditions of Canacona Water Treatment Plant (4/4) Lime Feeding Facility Disinfection System Name of Facility Capacity kg/hr m 3 /unit Diameter m Width m Length m Height m Volume m 3 Number 1 Unit Stand-by Assessment of Condition Working Chemical Used Liquid Chlorine Type of Plant & Machinery Chlorinator Capacity kg/hr 2. Number 1 Unit Stand-by Safty Measures Taken Commissioned Assessment of Condition Emersion Tank 1983 Working Laboratory Chemical Testing Laboratory Jar Testing Availability of Skilled Chemists Availability of Required Chemicals Contents of Facility In-service (Exists) Nil Lab. Technician & Chemical Operators Required Alum, Lime & Liquid Chlorine Remarks Use of Test Reports Frequency of Sampling & Analysis General Quality of Water Raw Water Quality Clear Water Quality Equipment Status Flow Meters Other Operating Valves Other Important Assets Valve's Condition Visible Leakage and Locations As per Format Hourly (ph, Turb., R-Cl) 2 Parameter Tests Monthly Good Turbid., Low ph Good Not Provided Working Working Nil Building Condition Wastewater Disposal Arrangements Organization & Staff Deployed Nalla Shift in Plant Operation Shifting System Working Hour : 3 Shifting System Covering 24 Hours 1: 7: 15:, 2: 15: 18:, 3: 18: 8: Grouping Staff Deployed : 1 :Morning Shift- 2 Persons 2 : General Shift- 4 Persons 3 : Night Shift- 3 Persons Staff Deployed at the Plant Person Qualification Year of Service Service at plant Management Staff - Engineers Assistant Engineer 1 D.C.E Junior Engineer 1 D.C.E Sub-total 2 Skilled Staff - Operators / Quality Testing Lab - Technician 1 B.Sc 1 7 Chemical Operator 1 S.S.C. 1 7 Assist. Plumber 2 Certificate 15 7 Lacour 2 I.T.I Watchman 3 S.S.C Sub-total 9 Unskilled Staff 9 - Other Labourers, Watchman, Security Guards Total Number 2 M31-162
117 Table M Monthly Water Quality of Canacona Water Treatment Plant Analysed by PWD s Laboratory from January 23 to May 25 (1/2) Color Odor Taste Turbidity ph Specific Conductivity Total Solids (NTU) ( /u mhos/cm) (mg/l) Raw Filtered Treated Raw Filtered Treated Raw Filtered Treated Raw Filtered Treated Raw Filtered Treated Raw Filtered Treated Raw Filtered Treated Jan-3 Feb-3 Mar-3 Apr-3 May-3 Jun-3 Jul-3 Aug-3 Sep-3 Oct-3 Nov-3 Dec Jan Feb Mar Apr-4 May Jun Jul Aug Oct Nov Dec Jan Feb Mar Apr May Max Min Average Total Dissolved Solids(TDS) Suspended Solids Total Hardness as CaCO 3 (TA Ca Mg Cl Total Alkalinity as CaCO 3 (mg/l) (mg/l) (mg/l) (mg/l) (mg/l) (mg/l) (mg/l) Raw Filtered Treated Raw Filtered Treated Raw Filtered Treated Raw Filtered Treated Raw Filtered Treated Raw Filtered Treated Raw Filtered Treated Jan-3 Feb-3 Mar-3 Apr-3 May-3 Jun-3 Jul-3 Aug-3 Sep-3 Oct-3 Nov-3 Dec Jan Feb Mar Apr-4 May Jun Jul Aug Oct Nov Dec Jan Feb Mar Apr May Max Min Average M31-163
118 Table M Monthly Water Quality of Canacona Water Treatment Plant Analysed by PWD s Laboratory from January 23 to May 25 (2/2) - SO 4 Fe 2+ Mn NO 3 KMnO 4 oxidizability as O 2 BOD at 27 and 3days DO (mg/l) (mg/l) (mg/l) (mg/l) (mg/l) (mg/l) (mg/l) Raw Filtered Treated Raw Filtered Treated Raw Filtered Treated Raw Filtered Treated Raw Filtered Treated Raw Filtered Treated Raw Filtered Treated Jan-3 Feb-3 Mar-3 Apr-3 May-3 Jun-3 Jul-3 Aug-3 Sep-3 Oct-3 Nov-3 Dec Jan Feb Mar Apr-4 May Jun Jul Aug Oct Nov Dec Jan Feb Mar Apr May Max Min Average F - Al 3+ Plate Count on nutrient agar MPN of Coliform MPN of E.Coli. (mg/l) (mg/l) no/1ml no/1ml no/1ml Raw Filtered Treated Raw Filtered Treated Raw Filtered Treated Raw Filtered Treated Raw Filtered Treated Jan-3 Feb-3 Mar-3 Apr-3 May-3 Jun-3 Jul-3 Aug-3 Sep-3 Oct-3 Nov-3 Dec Jan Feb Mar , Apr-4 May ,4 1, Jun ,4 1,1 1,1 21 Jul , Aug ,4 1, Oct , Nov , Dec ,4 1, Jan , Feb ,4 43 1,1 23 Mar Apr May , Max ,46 1,1 1,1 46 Min Average , M31-164
119 Color Turbidity Total Solids Jan-3 Color, Pt/Co scale May-3 Sep-3 Jan-4 May-4 Jan-5 May-5 Total Solids, mg/l Jan-3 Jan-3 May-3 May-3 Sep-3 Jan-4 May-4 Jan-5 May-5 Jan-3 May-3 Sep-3 Jan-4 May-4 Jan-5 Sep-3 Jan-4 May-4 Jan-5 May-5 Jan-3 May-3 Sep-3 Jan-4 May-4 Jan ph Turbidity,NTU ph May Specific Conductivity 6 Total Dissolved Solids (TDS) 4 2 Specific Conductivity, /u mhos/cm Jan-3 May-3 Sep-3 Jan-4 May-4 Jan-5 May-5 TDS, mg/l May Suspended Solids Total Hardness as CaCO 3 1 Ca Jan-3 Suspended Solids, mg/l May-3 Sep-3 Jan-4 May-4 Jan-5 May-5 Total Hardness, mg/l Jan-3 May-3 Sep-3 Jan-4 May-4 Jan-5 May-5 Jan-3 May-3 Sep-3 Jan-4 May-4 Jan-5 Ca 2+, mg/l May Mg Cl - Total Alkalinity (TALK) Jan-3 Mg 2+, mg/l May-3 Sep-3 Jan-4 May-4 Jan-5 May-5 Cl -, mg/l Jan-3 May-3 Sep-3 Jan-4 May-4 Jan-5 May-5 Jan-3 May-3 Sep-3 Jan-4 May-4 Jan-5 TALK, mg/l as CaCO3 May-5 Raw Filtered Treated Acceptable Cause for Rejection Raw Filtered Treated Acceptable Cause for Rejection Figure M Monthly Water Quality of Canacona Water Treatment Plant Analysed by PWD s Laboratory from January 23 to May 25 (1/2) M31-165
120 SO Fe 2+ Mn SO42-, mg/l Jan-3 May-3 Sep-3 Jan-4 May-4 Jan-5 May-5 Fe 2+, mg/l Jan-3 May-3 Sep-3 Jan-4 May-4 Jan-5 May-5 Jan-3 May-3 Sep-3 Jan-4 May-4 Jan-5 Mn 2+, mg/l May NO KMnO 4 oxidizability day BOD at NO32-, mg/l Jan-3 May-3 Sep-3 Jan-4 May-4 Jan-5 May-5 KMnO4 oxidizabilty, mg/l as O2 Jan-3 May-3 Sep-3 Jan-4 May-4 Jan-5 May-5 Jan-3 May-3 Sep-3 Jan-4 May-4 Jan-5 BOD, mg/l May DO F - Al OD, mg/l Jan-3 May-3 Sep-3 Jan-4 May-4 Jan-5 May-5 F -, mg/l Jan-3 May-3 Sep-3 Jan-4 May-4 Jan-5 May-5 Jan-3 May-3 Sep-3 Jan-4 May-4 Jan-5 Al 3+, mg/l May Plate Count on Nutrient agar at 37,24hrs, /ml MPN of Coliform, /1 ml MPN of E.Coli., /1 ml Plate Count, /ml Jan-3 May-3 Sep-3 Jan-4 May-4 Jan-5 May-5 MPN of Coliform, /1 ml Jan-3 May-3 Sep-3 Jan-4 May-4 Jan-5 May-5 Jan-3 May-3 Sep-3 Jan-4 May-4 Jan-5 MPN of E.Coli., /1 ml May-5 Raw Filtered Treated Acceptable Cause for Rejection Raw Filtered Treated Acceptable Cause for Rejection Figure M Monthly Water Quality of Canacona Water Treatment Plant Analysed by PWD s Laboratory from January 23 to May 25 (2/2) M31-166
121 Table M List of Reservoirs for the Canacona Water Supply Scheme Series No. System Inlet Pipe GLR/OHR/Sump Name of GLR/OHR/Sump Dia. Capacity Elevation (m) Material (Name of Location) Type (mm) (m3) RL HWL LWL 1 Canacona Canacona WTP GLR GLR OHR w/ Pumping Station Sub-Total 1,9 4 Canacona1 Godkamol (2) GLR Sadolxem GLR 5 3. Old 6 Sadolxem (2) GLR Poinguinim(6) 7 Talpona GLR under Construction of Distribution Main 8 Galjibaga GLR under Construction of Distribution Main 9 Mahalwada GLR 5 3. under Construction of Distribution Main 1 Maxem GLR Loliem(7) under Construction of Distribution Main Sub-Total Canacona2 15 ACP Hattipal Sump w/pump Station (5HP) ACP GLR 5 1. Sub-Total 6 13 Canacona5 35 DIP Agonda MBR (21) GLR from OHR(Series No.3) of WTP 14 2 PVC Agonda (2) GLR Agonda(3) Sub-Total 9 15 Canacona7 8 ACP Shristhal GLR 5 9. Canacona(4) w/pump Station (5HP), GL=54. Note : Sub-Total 5 Total 3, hrs Supply Area (Village Name) Canacona(4), Canacona(M CI)(9) Poinguinim(6) Remarks RL=Reduced Level (Base Elevation of GLR), HWL=High Water Level in Reservoir, LWL=Law Water Level in Reservoir, GLR=Ground Level Reservoir, OHR=Over Head Reservoir, MBR=Master Balancing Reservoir, Sump=Pump Suction Well M31-167
122 M31.8 Rural Water Supply Scheme During the Reconnaissance Survey as part of Phase I of this study, the water supply scheme in Canacona taluka was selected and assessed as a representative small scale water supply scheme. The Canacona scheme was selected based on recommendations from PWD staff. There are approximately 4 rural water supply schemes operating in the Canacona taluka and the networks for these schemes are completely independent from each other as well as form the regional scheme. The rural supply scheme at Matve, which supplies water to Parekatta, was visited. The Matve scheme consists of a pump house (manned 24 hours a day) with a small (five HP) submersible pump suspended in a bore well, which is approximately 16m deep. The scheme was commissioned in Bore wells in Goa are constructed by the Central Ground Water Board on behalf of the PHE. The pump feeds a 25m 3 OHR which feeds water to the village under gravity flow. A chlorine solution (5%) is added to the OHR (from 25 litre plastic containers) to maintain residual levels. The study team could not determine whether residual chlorine levels are regularly tested. There is no standby pump which means villagers can go without water for days at a time if the pump breaks down. The study team understood that the scheme supplies a population of approximately 1 people. Water is supplied for approximately two to three hours each day. The supply valves are controlled by PHE staff. There are approximately 25 private connections and 25 public stand posts. There is no charge for water consumed from stand posts in rural or urban areas and consumption is not measured. Table M lists the small scale (rural) water supply schemes in each taluka, which data are mentioned in Sector Status Study WSS Goa, 24. Table M also shows the rural water supply schemes, which are based on the information from PWD during the study period. M31-168
123 Table M List of Rural Water Supply Scheme (1/2) Sr.No. ID No. Taluka Town/Village Type Population Household H. Size W. Scheme Pernem Tiracol Rural Groundwater Tiswadi Talaulim Rural Groundwater Tiswadi Goalim Moula Rural Groundwater Tiswadi Gancim Rural Groundwater Tiswadi Curca Rural 2, Groundwater Bicholim Mencurem Rural 1, Groundwater Bicholim Dumacem Rural Groundwater Bicholim Salem Rural 2, Groundwater Bicholim Latambarcem Rural 6,268 1, Groundwater Bicholim Curchirem Rural 1, Groundwater Bicholim Cotombi Rural Groundwater Satari Podocem Rural Groundwater Satari Ravona Rural 1, Groundwater Satari Gonteli Rural 1, Groundwater Satari Siroli Rural Groundwater Satari Ponsuli Rural Groundwater Satari Golauli Rural Groundwater Satari Surla Rural Groundwater Satari Satrem Rural Groundwater Satari Derodem Rural Groundwater Satari Codal Rural Groundwater Satari Rivem Rural Groundwater Satari Gululem Rural Groundwater Satari Querim Rural 2, Groundwater Satari Morlem Rural 3, Groundwater Satari Xelopo-Buzruco Rural Groundwater Satari Sigonem Rural Groundwater Satari Maloli Rural Groundwater Satari Nanorem Rural Groundwater Satari Vainguinim Rural Groundwater Satari Ustem Rural Groundwater Satari Cumarconda Rural Groundwater Satari Vaguriem Rural Groundwater Satari Codvol Rural Groundwater Satari Caranzol Rural Groundwater Satari Carambolim-Buzr Rural Groundwater Satari Ponocem Rural Groundwater Satari Xelopo-Curdo Rural Groundwater Satari Siranguli Rural Groundwater Satari Sirsodem Rural Groundwater Satari Assodem Rural Groundwater Satari Govanem Rural Groundwater Satari Ambeli Rural Groundwater Ponda Conxem Rural Groundwater Quepem Quitol Rural 1, Groundwater Quepem Naquerim Rural Groundwater Quepem Morpila Rural 2, Groundwater Quepem Tiloi Rural Groundwater Quepem Bendordem Rural Groundwater Quepem Cavorem Rural Groundwater Quepem Maina Rural Groundwater Source: Sector Status Study WSS Goa, 24 M31-169
124 Table M List of Rural Water Supply Scheme (2/2) Sr.No. ID No. Taluka Town/Village Type Population Household H. Size W. Scheme Quepem Cordem Rural 1, Groundwater Quepem Padi Rural Groundwater Quepem Quedem Rural Groundwater Quepem Barcem Rural 2, Groundwater Quepem Gocoldem Rural Groundwater Quepem Quisconda Rural Groundwater Quepem Pirla Rural Groundwater Quepem Sulcorna Rural Groundwater Quepem Corla Rural Groundwater Quepem Cazur Rural Groundwater Quepem Mangal Rural Groundwater Sanguem Piliem Rural 4, Groundwater Sanguem Darbandora Rural 3, Groundwater Sanguem Sancordem Rural 1, Groundwater Sanguem Aglote Rural 1, Groundwater Sanguem Surla Rural 1, Groundwater Sanguem Molem Rural 1, Groundwater Sanguem Caranzol Rural Groundwater Sanguem Colem Rural 3, Groundwater Sanguem Sigao Rural 1, Groundwater Sanguem Sangod Rural Groundwater Sanguem Cormonem Rural Groundwater Sanguem Codli Rural 3, Groundwater Sanguem Camarconda Rural Groundwater Sanguem Moissal Rural Groundwater Sanguem Bandoli Rural 1, Groundwater Sanguem Rumbrem Rural Groundwater Sanguem Antoriem Rural Groundwater Sanguem Santona Rural 1, Groundwater Sanguem Calem Rural 2, Groundwater Sanguem Sonauli Rural Groundwater Sanguem Patiem Rural Groundwater Sanguem Maulinguem Rural Groundwater Sanguem Dudal Rural Groundwater Sanguem Comproi Rural Groundwater Sanguem Tudou Rural Groundwater Sanguem Potrem Rural Groundwater Sanguem Bati Rural 1, Groundwater Sanguem Cumbari Rural Groundwater Sanguem Viliena Rural Groundwater Sanguem Dongor Rural Groundwater Sanguem Naiquinim Rural Groundwater Sanguem Porteem Rural 2, Groundwater Sanguem Curpem Rural Groundwater Sanguem Vichundrem Rural Groundwater Sanguem Netorli Rural 1, Groundwater Sanguem Nundem Rural Groundwater Sanguem Verlem Rural Groundwater Canacon Cola Rural 5, Groundwater Canacon Gaodongrem Rural 5, Groundwater Canacon Cotigao Rural 2, Groundwater Source: Sector Status Study WSS Goa, 24 M31-17
125 Table M List of Rural Water Supply Scheme (1/7) Taluka Name of Scheme Source Pump Capacity Supply Population Capacity of Tank Amount (HP) (m 3 covered ) (m 3 /day) Remarks Quepem Barcem Gokuldem open/bore well 5 25 GLR Barcem (Rawapan) 5 5 GLR - spring/bore well 2,79 (Valipwada) 5 25 GLR - Paddi borewell 5 5 GLR 4 - Voili-Paddi borewell 5 25 GLR chlorination Khedem-Assodem spring/borewell Subdolem borewell 5 25 GLR 56 - Quiscond spring Sirlim spring Balli Bondordem 2borewells 5 25 GLR Cordem borewell 5 5 GLR 1,723 - chlorination Fatorpa Quittol borewell/jackwell 6 25 GLR 1,393 - Ventem borewell 5 25 GLR 26 - chlorination Morppila Dhabem borewell 5 5 GLR Morpila spring/salaulimwat 5 5 GLR 2,66 - chlorination Betul Naqueri borewell Dessaiwada openwell 1 25 GLR 48 - Betul(Bapsora) openwell 2 5 GLR 64 - Betul spring GLR 45 - chlorination Khana spring GLR Tembi openwell 6 25 GLR Ollir spring 5 25 GLR 28 - Cavrem-Pirla Pirla borewell 5 25 GLR Sulcorna borewell/spring 5 25 GLR Cazur borewell 6 5 GLR Mangal openwell 5 1 GLR Maina spring - 25 GLR chlorination Cauvrem spring - 7 GLR Nanagotov spring - 35 GLR 5 - Corla openwell 2 2 tanks Sanguem Sancorda Tamoisurla borewell Butter borewell chlorination pressure filters and Panas river 15+15= ,31 chlorination Satpal river GLR 3 chlorination(pressure filters proposed) Dongarwada openwell chlorination Mollem Mollem borewell 7.5+3=1.5 5 OHR 5 chlorination(pressure filters proposed) Sangod borewell 5-2,685 4 Barkatem openwell GLR 25 Casaulim openwell Source: PWD Goa - as of May 26 M31-171
126 Table M List of Rural Water Supply Scheme (2/7) Taluka Name of Scheme Source Sanguem Collem Pump Capacity Supply Population Capacity of Tank Amount (HP) (m 3 covered ) (m 3 /day) Collem borewell OHR - Davcond borewell 5-4 Kirlapal-Dabal Cormone borewell 5-4 Dabal borewell 5 25 GLR 25 Codli borewell 5-4 Kamarkhand borewell 5 5 GLR 4 Vagona borewell 5 1 GLR 4 chlorination(pressure filters shall be installed shortly) chlorination(pressure filters shall be Near bridge river ,648 installed shortly) chlorination(pressure Dudhsagar river (Repaired 5 OHR - filters shall be pump) installed shortly) Hospital borewell OHR - Shigao borewell 5 5 GLR - Dharbandora Gurkhem borewell 5+3=8 5 GLR 4 Around 3,2 souls is from Talsai borewell 3-25 Pilliem,Dhadem,Prata 3,994 Tisk borewell 5-4 pnagar,occamb are covered under Opa water works. Kirlapal borewell 5 5 GLR 6,545 4 Sandol borewell 5-4 Haluliwada borewell GLR 4 pressure filter+chlorination Molerimoi borewell 5-4 Sanvordem Dhadem borewell 2 3 GLR 25 Gandhinagar borewell ,47 Guddemol borewell 5 5 GLR 32 Ambeudoc borewell 5-32 Others Uguem tubewell Valkinim Ⅱ tubewell Valkinim Ⅲ openwell Bhati openwell Portem openwell Cumbari(Cumbari,Val tubewell she,volliana) Cumbari(Cumbari) tubewell Vaddem Ⅰ openwell VaddemⅡ tubewell Natravalim tubewell Nundem spring Veriem openwell Tadou spring Mascavorem openwell Curpem Ⅰ openwell Curpem Ⅱ openwell Vichundrem tubewell Rivona river Keneriwada openwell Source: PWD Goa - as of May 26 Remarks M31-172
127 Table M List of Rural Water Supply Scheme (3/7) Taluka Name of Scheme Source Canacona Loliem-Polem Pump Capacity Supply Population Capacity of Tank Amount (HP) (m 3 covered ) (m 3 /day) Polem sump 5 8 GLR 13 Sheli sump 5 2 GLR 4 Tanshiwada sump GLR 4 3,187 Loliem sump 5 5 GLR 4 Deptamol borewell 5 5 OHR 3 Panskhande borewell 5 8 GLR 16 Poinginim Muthal borewell 3 2 GLR 2 Sadolxem sump 5 5 GLR 5 Ammona borewell 5 2 GLR 3 2,727 Shishewal sump 5 2 GLR 2 Aug to Deptamol sump 5 5 GLR 4 Tirwal sump 5 2 GLR - Cotiago Eda borewell 3 2 GLR 2 Avem borewell 3 5 GLR 4 1,845 Badsorem spring - 2 GLR 3 Aveli spring Gaondongrem Tudal borewell 5 8 GLR 8 Bhuper borewell 5 2 GLR 3 Baras spring - 1 GLR 25 2,93 Zitawadi borewell 5 5 GLR 6 Karvem borewell 5 2 GLR 4 Tallem sump 3 1 GLR 1 Shristal Asali sump 5 2 GLR 2 Gullem borewell 5 2 GLR 3 3,785 Chapoli sump 5 2 GLR 2 Aug to Shristal boosterpump 5 2 GLR 2 Agonda Agonda Mudkud sump GLR - Pervem sump ,231 Shelpewal sump Aug to Agonda sump 3 35 OHR 7 Cola Solyem sump Saleri sump Parikatta borewell Mollorem sump Gavai borewell 5 2 3,515 2 Nuvem spring Paremol stream Popoidanda stream Cabo-De-Rama borewellstream Source: PWD Goa - as of May 26 Remarks M31-173
128 Table M List of Rural Water Supply Scheme (4/7) Taluka Name of Scheme Source Pump Capacity Supply Population Capacity of Tank Amount (HP) (m 3 covered ) (m 3 /day) Remarks Pernem Tiracol Near Check post tubewell Nil Near Fort tubewell LPM openwell Scheme is in operation Keri Talwada tubewell LPM Gadechawada tubewell LPM Talwada near Temple tubewell LPM Harijan wada tubewell LPM openwell Scheme is in operation Paliem Bhandarwada tubewell LMP Tilvewada tubewell LPM openwell Scheme is in operation Kiranpani tubewell LPM Arambol Thakurwada tubewell LPM Parsekarwada Madhalawada tubewell tubewell LPM 15 LPM openwell openwell Scheme is in operation Scheme is in operation Near school tubewell LPM Near church tubewell LPM Deulwada tubewell Mandrem Askawada tubewell LPM Marathwada tubewell LPM openwell Scheme is in operation Madhalamaz tubewell LPM Salgaonkawada tubewell LPM openwell Scheme is in operation Varchawada tubewell LPM Mhamalwada tubewell LPM Askawada tubewell LPM Naikwaqda near tubewell LPM Dandoswada near school tubewell LPM Kmarwada tubewell LPM Dandoswada Mandrem(2nd) tubewell LPM Mandrem tubewell LPM Madhalamaz(New) Gawadewada near temple tubewell LPM tubewell LPM openwell Scheme is in operation Asvem near temple Madhalamaz near market tubewell LPM Malarbhat tubewell LPM Gawadewada tubewell LPM Junaswada tubewell LPM Junaswada tubewell LPM Junaswada tubewell Nil Askawada tubewell LPM Madhalawada tubewell LPM Source: PWD Goa - as of May 26 M31-174
129 Table M List of Rural Water Supply Scheme (5/7) Taluka Name of Scheme Source Pump Capacity Supply Population Capacity of Tank Amount (HP) (m 3 covered ) (m 3 /day) Pernem Bidurbag tubewell LPM Junaswada tubewell Ashvem tubewell LPM Madhalamaz near existing pump house tubewell LPM Deulwada tubewell LPM Corgao Morijim Petechawanda tubewell Petechawanda tubewell LPM Mainwada tubewell LPM Conadiwada tubewell LPM Conadiwada tubewell LPM Deulwada tubewell LPM Gawadewada tubewell LPM Bhatwadi tubewell LPM Bhatwadi tubewell LPM tubewell Dry Bhaidwada tubewell Dry openwell Scheme is in operation Harijianwada tubewell LPM Murdiwada tubewell LPM Newwada tubewell LPM Deulwadaa near tubewell LPM panchayat openwell Warchawada tubewell LPM Khinwada tubewell LPM Khin-Kumbarwada tubewell LPM Newwada tubewell LPM Madhalawada tubewell LPM Dabholkarwada tubewell Agarwada-Chopdem Parcem Tuem Near school Agarwada tubewell LPM Checkpost Agarwada tubewell LPM tubewell LPM Chopedem openwell Agarwada near school tubewell LPM Deulwada tubewell LPM Deulwada tubewell LPM Chaweddwada tubewell LPM Vaidonger near church tubewell LPM Vaidonger junction tubewell LPM Madhalawada tubewell LPM Naiginwada tubewell LPM Remarks Scheme is abandoned due to salanity Scheme is abandoned due to salanity Yuem village tubewell LPM Zolurem tubewell LPM Deulwada tubewell LPM openwell Scheme is in operation Source: PWD Goa - as of May 26 M31-175
130 Table M List of Rural Water Supply Scheme (6/7) Taluka Name of Scheme Source Pump Capacity Supply Population Capacity of Tank Amount (HP) (m 3 covered ) (m 3 /day) Remarks Pernem Vimoda Near panchaiyat tubewell LPM Valpem tubewell openwell Scheme is in operation Malpem tubewell Warchawada tubewell Amberem Amberem tubewell LPM Ugvem Deulwada tubewell LPM openwell Scheme is in operation Mopa Mopa tubewell LPM Torxem tubewell LPM Naikwada Scheme is abandoned openwell due to salanity Fakirpotto tubewell LPM Harijanwada tubewell LPM Patradevi checkpost tubewell LPM Patradevi tubewell LPM Varcond Naer school tubewell LPM Near pump house tubewell LPM Near Vithaladevi temple Near open well of Arjun tubewell Casarvernen Chandel Deulwada tubewell openwell Scheme is in operation tubewell LPM openwell Scheme is in operation Purva tubewell Bodgul tubewell Bailpat tubewell LPM Chandel village tubewell LPM Near temple tubewell LPM Hali Chadel tubewell LPM Kumarwada Chandel tubewell LPM Ibrampur Hankhane Hedus tubewell LM Ibrampur near existing pump house Angadwada HANKHANE tubewell LPM Near culvert tubewell LPM Hankhane near pump house tubewell LPM Harijan wada tubewell LPM Hassapur In the field tubewell LPM Source: PWD Goa - as of May 26 tubewell LPM openwell Scheme is in operation M31-176
131 Table M List of Rural Water Supply Scheme (7/7) Taluka Name of Scheme Source Pernem Pernem Pump Capacity Supply Population Capacity of Tank Amount (HP) (m 3 covered ) (m 3 /day) Mauswada pump tubewell LPM house openwell Scheme is in operation Nanerwada tubewell Surbanwada tubewell LPM Kotkarwada tubewell Surbanwada Ⅱ tubewell LPM Sarmale tubewell LPM Bhirondem near public tap tubewell Parastem near school tubewell LPM Parastem bedko tubewell LPM Harijanwada tubewell LPM Porascadem Dhargai Remarks Near pump house(1) tubewell LPM openwell Scheme is in operation Near pump house(2) tubewell LPM Caznem near temple tubewell Naibag (1) near spring tubewell LPM Naibag near bridge tubewell LPM Near pump house tubewell LPM Casanem tubewell LPM Oxelbag tubewell openwell Scheme is in operation Macazana tubewell LPM Ozarim Madkaiwada openwell Scheme is in operation Source: PWD Goa - as of May 26 M31-177
132 Appendix M32 Data Concerning Number of Connection and Water Consumption Provided by PWD Goa
133 Contents for Appendix M32 M32.1 Data Concerning Number of Connection and Water Consumption Provided by PWD Goa M32-1
134 Appendix M32.1 Data Concerning Number of Connection and Water Consumption Provided by PWD Goa Taluka: Pernem Data Source: Sub-Division office II of Division office XVII, data from Oct 24 to Jun 25 Number of Customers (Number of Connections) Unit: Nos. Category Oct Nov Dec Jan Feb Mar Apr May Jun Total 1 Domestic 5,88 6,35 6,67 6,792 7,29 7,42 7,589 7,832 8, 2 Commercial Government 4 Industries Municipality 6 V. Panchayat 7 Defense 8 Temporary Sup. 9 Inst. Bills 1 Public Stand Post 1,1 1,1 1,1 1,1 1, Total 6,957 7,455 7,824 7,946 8,183 8,257 8,294 8,41 8,428 Water Consumption Billed per Monthe Unit: m3/month Category Oct Nov Dec Jan Feb Mar Apr May Jun Total 1 Domestic 66,295 6,747 53,669 36,889 42,337 83,929 38,892 44,348 11,987 2 Commercial 1,954 4, , Government 1,953 1,754 1,873 1,473 1,475 1,993 1,812 1,749 2, 4 Industries 2, ,15 1,924 1,924 2,114 1,763 1, Municipality 6 V. Panchayat 7 Defense 8 Temporary Sup. 9 Inst. Bills 1 Public Stand Post 165, 165, 165, 165, 165, 12, 97,5 78, 55,5 Total 237,62 232,66 221,931 25, ,276 29,34 14,93 126, ,132 M32-1
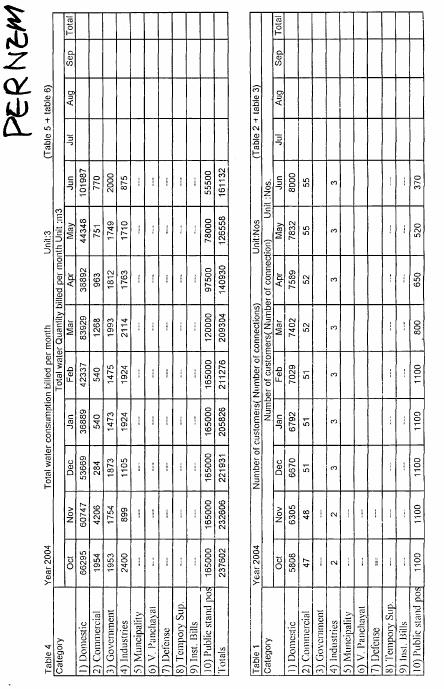
135 M32-2
136 Taluka: Bardez Data Source: Division office XVII, data of June 25 Number of Customers (Number of Connections) Unit: Nos. 25 Category Oct Nov Dec Jan Feb Mar Apr May Jun Total 1 Domestic 42,248 2 Commercial Government Industries 17 5 Municipality 6 V. Panchayat 7 Defense 1 8 Temporary Sup. 5 9 Inst. Bills 1 Public Stand Post Total 43,151 Water Consumption Billed per Monthe Unit: m3/month Category Oct Nov Dec Jan Feb Mar Apr May Jun Total 1 Domestic 848,745 2 Commercial 48,373 3 Government 2,93 4 Industries 14,449 5 Municipality 6 V. Panchayat 7 Defense 8 Temporary Sup Inst. Bills 1 Public Stand Post Total 914,573 M32-3
137 M32-4
138 Taluka: Tiswadi Data Source: Sub Division office I of Division office III, data of average in 24 Number of Customers (Number of Connections) Unit: Nos. 24 Category Oct Nov Dec Jan Feb Mar Apr May Jun Total 1 Domestic 27,228 2 Commercial Government 27 4 Industries 12 5 Municipality 29 6 V. Panchayat 7 Defense 14 8 Temporary Sup. 9 Inst. Bills 1 Public Stand Post Total 28,128 Water Consumption Billed per Monthe Unit: m3/month Category Oct Nov Dec Jan Feb Mar Apr May Jun Total 1 Domestic 599,368 2 Commercial 34,98 3 Government 4,5 4 Industries 42,194 5 Municipality 29 6 V. Panchayat 7 Defense 28,389 8 Temporary Sup. 9 Inst. Bills 1 Public Stand Post Total 79,199 M32-5
139 M32-6
140 M32-7
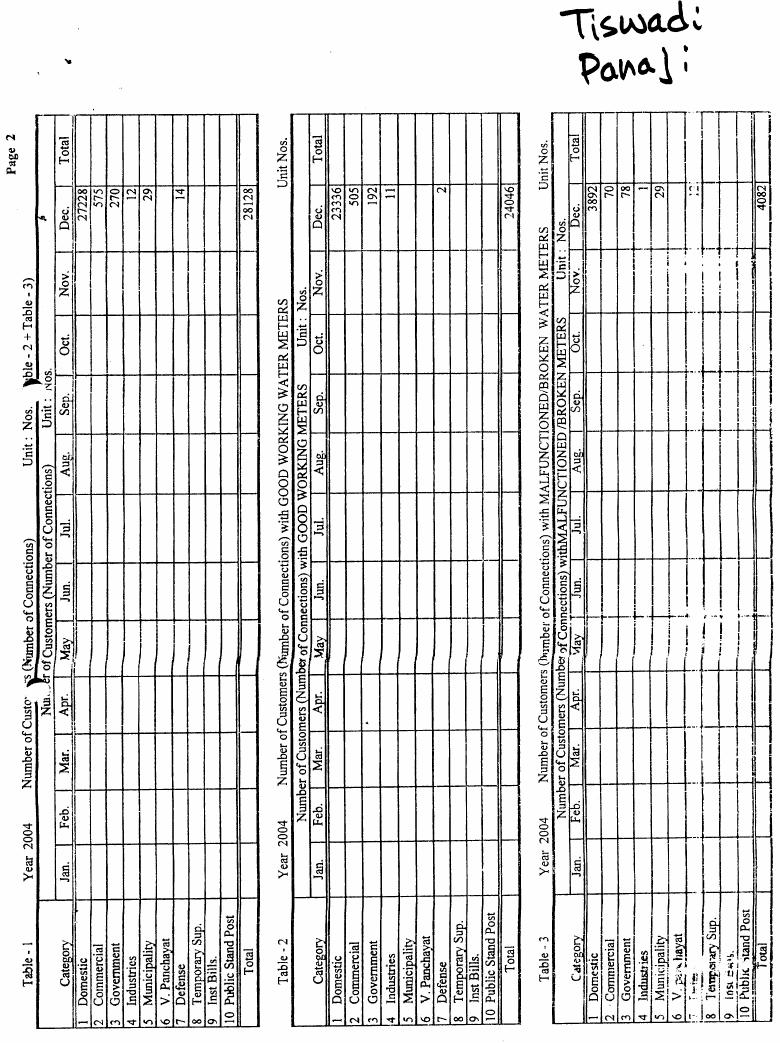
141 M32-8

142 M32-9
143 Taluka: Bicholim Data Source: Division office XVII, data of June 25 Number of Customers (Number of Connections) Unit: Nos. 25 Category Oct Nov Dec Jan Feb Mar Apr May Jun Total 1 Domestic 11,223 2 Commercial 27 3 Government 28 4 Industries 9 5 Municipality 33 6 V. Panchayat 15 7 Defense 8 Temporary Sup. 9 Inst. Bills 65 1 Public Stand Post Total 11,643 Water Consumption Billed per Monthe Unit: m3/month Category Oct Nov Dec Jan Feb Mar Apr May Jun Total 1 Domestic 291,325 2 Commercial 1,998 3 Government 6,54 4 Industries 6,955 5 Municipality 2,455 6 V. Panchayat 64 7 Defense 8 Temporary Sup. 9 Inst. Bills 4,684 1 Public Stand Post Total 323,525 M32-1

144 M32-11