Twinning project Bulgaria
|
|
|
- Donald Calvin Turner
- 5 years ago
- Views:
Transcription
1 Twinning project Bulgaria PROJECT TWINNING BULGARIA Institutional Building at the Energy Efficiency Agency (EEA) Seminar Industrial Energy Audits Energy efficiency case studies Sofia February 20th 2007
2 Twinning project Bulgaria Energy Efficiency Certificate (TEE) Type I: energy saving in the field of electric energy; Type II: energy saving in the field of gas; Type III : energy for different fuels;

3 Twinning project Bulgaria Average price for TEE Type I and Type II

4 Sales for TEE Type I and Type II

5 Twinning project Bulgaria Volume of sale for TEE in 2006
6 Twinning Twinning project project Bulgaria Bulgaria III 13-feb ,5 89,5 89,5 II 13-feb , I 13-feb III 06-feb , II 06-feb ,5 52 I 06-feb III 30-gen ,5 85,5 85,5 II 30-gen , I 30-gen III 23-gen , II 23-gen I 23-gen III 16-gen , II 16-gen , ,9 I 16-gen III 09-gen II 09-gen , I 09-gen-07 TEE sale Reference price ( /tep) Max price ( /tep) Min. price ( /tep) type date
7 Twinning project Bulgaria Average national price for Electric Energy
8 Twinning project Bulgaria Main items considered in case studies (1) Italian situation EE /MWh Gas 30 / NMc TEE (Type I) 65 /TEE Discount rate 4,5 % Inflation rate 2 % Equity 30 %
9 Twinning project Bulgaria Main items considered in case studies (2) Bulgarian situation EE 40 /MWh Gas 18 /NMc TEE (Type I) - /TEE Discount rate 8 % Inflation rate 5 % Equity 30 %
10 Twinning project Bulgaria CASE STUY 1 Application of an ORC (Organic Rankine Cycle) on flue gas from two heating furnaces in a steel making factory
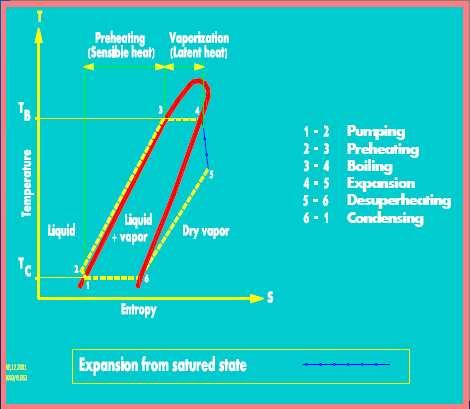
11 ORC characteristics Organic Rankine Cycle (ORC) is made by a closed turbo generator. Rankine cycle is that generally used for steam turbine; ORC, as for steam cycle, works according to a Rankine cycle, but: the fluid is Hydrocarbon or, in general, a kind of organic fluid; The cycle is completely closed
12 ORC characteristics Working fluid is an hydrocarbon, so there are not problems due to icing ; Turbine follows automatically variations due to flue gas flow rate or temperatures By ORC it is possible to use heat at a low entalpic level (not usable in common steam cycle)

13 ORC Process scheme

14 Organic Rankine Cycles

15 ORC Typical lay out
16 Heating furnaces FURNACES h working N Furnaces Flow rate (avg) Flue gas T avg flue gas T out After recovery h/a - kg/s C C
17 Heating furnaces Audit to define possible actions (1): - Data collection on flue gas flow rate and temperature, for about 1 month; - Implementation of collected data by historical data available on methane Flow rate, collected hourly ;
18 Heating furnaces Audit to define possible actions (2) Assessment of average flow rate and temperature (yearly base) ; Assessment of thermal energy that is possible to recover from flue gas; Assessment of technical aspects related to heat exchanger installation on flue gas from heating furnace (lay out, pressure drops, electrical connection)
19 Temperature trend in furnace 1 Heating furnaces
20 Temperature trend in furnace 2 Heating furnaces
21 Heating furnaces Flue gas flow rate trend in furnace 1
22 Heating furnaces Flue gas flow rate trend in furnace 2
23 Heating furnaces Thermal power in flue gas from furnace 1
24 Heating furnaces Thermal power in flue gas from furnace 2

25 Total thermal power in flue gas Heating furnaces
26 Heating furnaces ORC Pe Installed kw Pe media Gross T diathermic oil IN T diathermic oil OUT Cooling water flow rate (20 30 C) Diathermic oil flow rate kw C C Mc/h t/h Pe media Net Ee Produced TEE kw MWh/year -
27 Economical assessment (1) Project data Power installed Internal consumption 3 MWh 0,4 MWh Produced energy MWh/anno
28 Economical assessment (2) Italian situation ESCO Project cost Inflation rate 2 % Discount rate (10 years) 4,5% Equity 30% EE price (BT) 80 /MWh EE applied price 60 /MWh TEE (5 years) 3700 TEE price 65 /TEE IRR (8 years) 25% Pay Back 3,5 years Cash flow for enterprise > /y
29 Economical assessment (3) Bulgarian situation Project cost Inflation rate 5% Discount rate (10 anni) 8% Equity 30% EE price(bt) 40 /MWh TIR (8 years) 10% Pay Back 8 years
30 Twinning project Bulgaria CASE STUY 2 Cogeneration in a tiles factory
31 COGENERATION A cogeneration plant is a thermoelectrical plant in which a power source (the fuel) is used to produce mechanical energy (electrical energy) and heat in cascade, realizing more rational use of the contained energy in the fuel regarding processes that separately produce the two shapes of energy.
32 Application to tiles sector It has been used an engine fuelled by natural gas. It produces: electric power through an alternator mounted on the drive shaft; warm air, to use in the dryer, through the recovery of thermal energy from the water of cooling, the lubricating oil and the engine supercharging air.
33 The convenience (1) If, for absurdity, we thought to use the gas engine in order to produce exclusively electric power, we would notice that the electric efficiency would be too much low and the production cost of the kwh advanced to that one of purchase. Analogous, if we thought to use the gas engine to produce exclusively heat, we would notice that the thermal efficiency would be too much low regarding one normal boiler.
34 The convenience (2) Only taking advantage of both at the same time the produced shapes of energy, the convenience is obtained to use cogeneration. The convenience as well as more is high how much longest is the period in which at the same time the two shapes of energy are requested.
35 Main data It is necessary, therefore, to know in detail the courses of loads (thermal and electric) of the process to estimate: - the percentage of time in which electric and thermal energy are requested at the same time; - the value of the aforesaid requirements; - the duration of the same ones.
36 ELECTRIC LOAD DIAGRAM kw HOUR
37 THERMAL LOAD DIAGRAM kw HOUR
38 TOTAL LOAD DIAGRAM kw HOUR
39 hour ELECTRICAL AND THERMAL LOAD (kw) JANUARY FEBRUARY MARCH APRIL MAY JUNE JULY AUGUST SEPTEMBER OCTOBER NOVEMBER DECEMBER el th el th el th el th el th el th el th el th el th el th el th el th
40 Plant dimensioning From the load diagrams we can look at that requirements exist base of approximately 400 kw for the electric load and the thermal load too. A gas engine was has been chosen to cover only the base of the electric load diagram. The gas engine provides an electrical power of 360 kw and a thermal energy of 735 kw under warm air shape send to the dryer directly. The engine consumption is equal to 1125 kw.
41 Cost/benefits analysis (1) For the economic analysis has been assumed various conditions on the base of economic data Italians and Bulgarians. Italy Bulgaria Electric energy price 10 c /kwh 4 c /kwh Natural gas price 30 c /Nm 3 18 c /Nm 3 Interest real rate (%) 4,5 8 TEE Price ( ) 65 0 Inflation (%) 2 5
42 Cost/benefits analysis(2) The hour saving is: 360/0, /0, = 633 kw In economic terms ( ): Italy Bulgaria Electric energy - 36,00-14,40 Thermal energy +11,55 +6,93 Manteinance +1,48 +1,48 TEE - 5, Total hour saving - 28,12-5,99
43 Cost/benefits analysis(3) Assuming a load factor of 5376 h/year, a life of the engine of hours and, therefore, a duration of the investment to approximately 10 years, it turns out how much follows: Italy Bulgaria Annual saving ( ) Investment ( ) Payback time (years) 2,51 9,44 DCF ( ) TIR (%) 30-11
44 Discounted cash flow diagram Euro Italy Bulgaria Years
45 Discounted cash flow diagram Euro Italy Bulgaria Years
46 Euro Discounted cash flow diagram (with TEE revenue) Italy Bulgaria Years
47 Twinning project Bulgaria CASE STUY 3 Compressed air optimization
48 COMPRESSED AIR Generally, the energy incidence is about 70 % in the costs of a compressed air system. Power kw Hours/year full load (%) no load (%) standby (%) Annual energy (kwh) Annual cost ( ) Italy Bulgaria The power of compressors is generally oversized and this generates the necessity of a regulation that comes put into effect making it to work to empty in lack of demand for air (sees table).
49 Some interventions The parameters that can influence on the operating costs of a compressed air system, are: Pressure and flow rate; compressed air quality; circuit losses; compressed air plant.
50 Pressure and flow rate Verify that it are fixed in order to the effective necessities and, if the plant demands two levels of pressure, estimate the convenience to install two compressors in such a way to produce the two requested levels. As an example, 1 bar of increase of the produced pressure consumes approximately 6 % in more than electric power. It is important also to try to organize the job of the several users in such a way to flatten the most possible demand.
51 Compressed air quality It is tied to the presence of water and lubricating oil within the same air. For the water it would go estimated the technical-economic convenience of the use of centralized air dryers in alternative to the separators of condense. For the oil it would go estimated the technical-economic convenience of the use of compressors without lubrication, more expensive, in alternative to those lubricates, less expensive, but demanding the adoption of opportune filters.
52 Circuit losses(1) They are source of waste of considerable energy Hole diameter (mm) 10 Air flow rate at 7 bar (l/s) 1,2 11, Waste power (kw) 0,4 4,0 10,8 43 The previous table shows the air flow rate from a hole on a circuit to the pressure of 7 bars.
53 Circuit losses(2) Therefore, as an example, if along the compressed air network there were zones of loss whose total surface is equivalent to a hole of 3 millimeter of diameter and our compressor works 100 hours the week for approximately 5200 hours/year, the economic loss, with a cost of the energy of 0,04 /kwh, will be approximately 800 /y. It will be therefore opportune periodically to try the estate of the network detaching all uses of compressed air leaving the network in the exercise pressure. If the circuit does not have losses, the compressor will not be put in function.
54 Compressed air plant The consumed energy in order to compress the air increases with the temperature of the same one. It is therefore convenient to capture the air from outside and opportunely filter it before sending to the compressors.
55 High efficiency electric engines (1) Last, but not the least, to the scope of the energy saving, the adoption of high efficiency electric engines. In the greater part of the cases the engines are oversized. The electric engines are designed for having their maximum electric efficiency around 75 % of the nominal load.
56 High efficiency electric engines(2) If the engine works between 50 % and 100 % of its nominal load, the electric efficiency decreases regarding its maximum, but not a lot. If instead the engine works under 50 % of its nominal load, the electric efficiency collapses to values many bottoms. Contrarily to how much it can be thought, this case happens more frequently.
57 High efficiency electric engines(3) It is to consider also that the power factor (cosφ) is as well as the more high how much the power which the engine works is next to its nominal load. In synthesis, an engine oversized involve two disadvantage main, low electric efficiency and low power factor. These disadvantages determine greater energetic consumptions. 57
58 High efficiency electric engines(4) We suppose to have an engine of 11 kw that works 4,000 hours the year with a load factor of 40 %, an electric efficiency of 78 % and an annual consumption of kwh. It could be replaced with a high efficiency engine of 5,5 kw with load coefficient of 80 %, an electric efficiency of 91 %, a cost of purchase of approximately 300 and an annual consumption, providing the same service, of kwh.
59 High efficiency electric engines(5) A smaller annual consumption of electric power of approximately kwh could be obtained at the cost of 0,04 /kwh. It involves an annual saving of approximately 120 and a payback time more then two years. An additional advantage is to improve the cosφfrom 0,6 to 0,8. That determines a further saving of approximately 50 for the purchase of the condensers that deals to come down payback time less than two years.
60 thank you for your attention!