GSP Coordinating Committee
|
|
|
- Madison Burke
- 5 years ago
- Views:
Transcription
1 GSP Coordinating Committee Coordinating Committee Meeting August 27, 2018 Merced Irrigation-Urban GSA Merced Subbasin GSA Turner Island Water District GSA-1
2 Agenda 1. Call to Order 2. Approval of Minutes for July 23, Stakeholder Committee Update 4. Presentation by Woodard & Curran on GSP Development a) Minimum Thresholds b) Hydrogeologic conceptual model (HCM) c) Projected Water Budget and Sustainable Yield d) Data Management Approach and DMS Demo
3 Agenda 5. Public Outreach Update 6.Coordination with Neighboring Basins 7.Update DWR s SGMA Technical Support Services (TSS) opportunity 8.Public Comment 9.Next Steps and Adjourn

4 Approval of Minutes
5 Stakeholder Committee Update
6 Minimum Thresholds
7 Hydrologic Model Historical Water Budget Current Baseline Projected Water Budget Undesirable Results Hydrogeologic Analysis Data Management System Technical Work GSP Development Policy Decisions Minimum Thresholds Sustainability Goals Measurable Objectives Monitoring Network Water Accounting Interim Milestones Projects & Management Actions Economics & Funding Management Actions Draft GSP & Implement. Plan Jun 2018 Jul 2018 Aug 2018 Sep 2018 Oct 2018 Nov 2018 Dec 2018 Jan 2019 Feb 2019 Mar 2019 Apr 2019 May 2019 Jun 2019 Jul 2019


8 Minimum Thresholds Need to be Developed for All Six Sustainability Indicators Chronic Lowering of Groundwater Levels Reduction in Groundwater Storage Storage addressed by bringing budget into balance Seawater Intrusion Degraded Water Quality Land Subsidence Salinity Addressed Under Water Quality Depletion of Interconnected Surface Water
9 Minimum Thresholds Should Be Set Where Undesirable Results Would Occur Undesirable Results are significant and unreasonable negative impacts that can occur for each Sustainability Indicator Example: Lowest GW elevations can go at a monitoring point without something significant and unreasonable happening to groundwater Used to guide and justify GSP components Monitoring Network Minimum Threshold Projects and Management Actions If issues are already occurring, we only need to go back to Jan 1, 2015 conditions; if no issues are occurring, can set threshold where they would be anticipated to occur
10 Minimum Thresholds Need to be Developed for All Six Sustainability Indicators Chronic Lowering of Groundwater Levels Reduction in Groundwater Storage Seawater Intrusion Degraded Water Quality Land Subsidence Depletion of Interconnected Surface Water
11 Developing Minimum Thresholds is an Iterative Process Projects and Management Actions Undesirable Results Minimum Thresholds Measurable Objectives Sustainability Water Budget
12 Minimum Thresholds Approach Datasets to Identify Minimum Thresholds Historical Low Groundwater Elevations Have we seen URs at past low groundwater levels? If no historical indication of URs, then thresholds can be at this level or deeper If indication of URs, thresholds can be set above that historical level or at 1/1/2015 levels Domestic well depths Typically the shallowest wells, first impacted from declining groundwater elevations Absent known historical URs, domestic well depth can define the minimum threshold Minimum depth Defined percentile
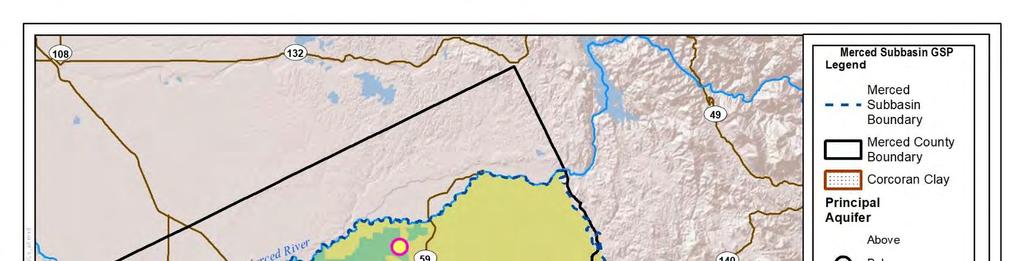
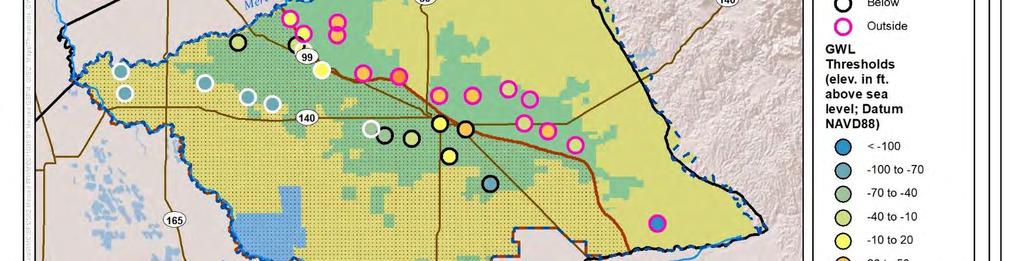
13 Minimum Thresholds Thresholds defined using the same methodology for all 3 principal aquifers: Outside Corcoran Above Corcoran Below Corcoran
14 Minimum Thresholds Updated Approach Minimum threshold is defined as the shallowest of either Historical low groundwater elevation at the monitoring well, minus a buffer (range of min & max GWLs from ) this assumes that over the next 20 years, GWE will decline at approximately half the max rate seen over the past 10 years UNLESS this would dewater more than 25% of the shallowest nearby domestic wells in this case, threshold was increased to protect 75% of nearby wells


15 Minimum Thresholds Approach

16 Where is Well N W001? Well 11

17 Minimum Thresholds Example Example: Example: Well 11

18 Where is Well N W002? Well 11
19 Minimum Thresholds Example Example:
20 Next Steps Update analysis with additional domestic wells from Merced County database Coordinate with GSAs to identify wells in gap areas Compare potential thresholds to 2017 elevations

21 What Comes Next? Projected Water Budget will be used to understand average sustainable pumping rates basin-wide Projects and Management Actions need to be identified to include supply and demand-side measures to achieve sustainability Depending on rate of project implementation, groundwater elevation thresholds may need to be adjusted Preliminary Thresholds Final Thresholds Water Budget
22 Rate of Plan Implementation May Necessitate Changes in GW Elevation Thresholds Groundwater Elevation GSP Implementation Rate Potential Threshold Sustainable Management
23 Hydrogeologic Conceptual Model
24 Hydrogeologic Conceptual Model (HCM) According to DWR regulations, the HCM: Provides an understanding of the general physical characteristics related to regional hydrology, land use, geology geologic structure, water quality, principal aquifers, and principal aquitards of the basin setting Provides the context to develop water budgets, mathematical (analytical or numerical) models, and monitoring networks Provides a tool for stakeholder outreach and communication
25 Hydrogeologic Conceptual Model (HCM), cont d HCM parameters include: Topographic information, surficial (surface) geology, soil characteristics, delineation of existing recharge areas, surface water bodies, source and point of delivery for local and imported water supplies HCM Data gaps: Portions of the basin not well understood Plan to fill data gaps in understanding currently addressing these gaps

26 HCM: Surficial Geology


27 HCM: Corcoran Clay Depth
28 HCM: Corcoran Clay Thickness

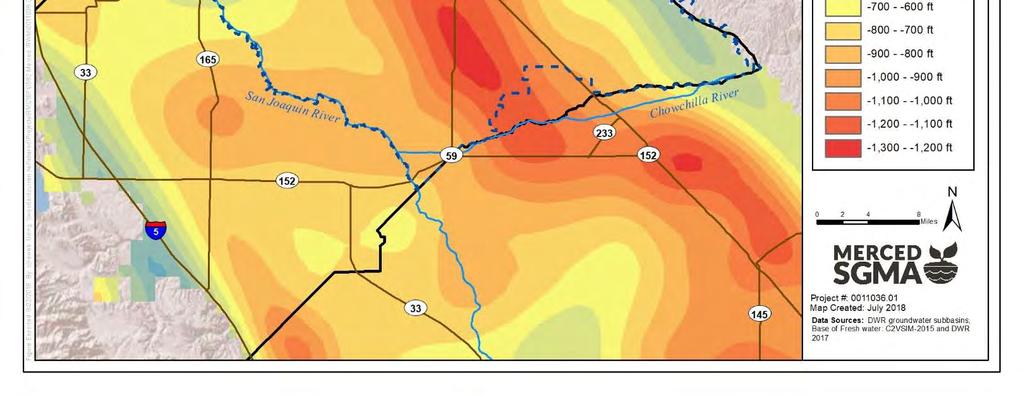
29 HCM: Base of Fresh Water


30 HCM: Geologic Cross Sections

31 HCM: 3D Visual

32 HCM: 3D Visual 2,500 feet
33 Next Steps Continue drafting HCM Water Quality Current Conditions Define data gaps
34 Projected Water Budget, and Sustainable Yield
35 Water Budgets: Defining Timeframes Historical Water Budget Uses historical information for hydrology, precipitation, water year type, water supply and demand, and land use going back a minimum of 10 years. Current Conditions Holds constant the most recent or current data on population, land use, year type, water supply and demand, and hydrologic conditions. Projected Water Budget Uses the future planning horizon to estimate population growth, land use changes, climate change, etc.
36 Projected Conditions Baseline Hydrologic Period: Water Years (50-Year Hydrology) River Flows Merced: MercedSIM San Joaquin: CalSim Local Tributaries: Historic Records Land Use and Cropping Patterns: 2013 CropScape modified per locally supplied data Urban Water Use: General Plan Buildout Conditions Basin Average GPCD: 300 Surface Water Deliveries Merced Irrigation District Stevinson Water District MerquinCounty Water District Turner Island Water District Chowchilla Water District


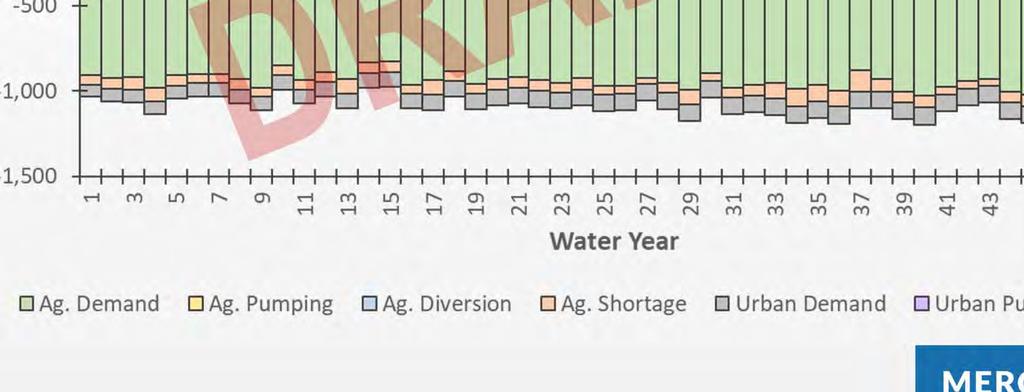
37 Projected Conditions Baseline Land & Water Use Budget Merced Groundwater Subbasin

38 Projected Conditions Baseline Groundwater Budget Merced Groundwater Subbasin

39 Projected Conditions Baseline Groundwater Budget Merced Groundwater Subbasin
40 Sustainable Yield (recap) What is sustainable yield? the maximum quantity of water, calculated over a base period representative of long-term conditions in the basin and including any temporary surplus, that can be withdrawn annually from a groundwater supply without causing an undesirable result. How do we develop this? Can be developed through a groundwater model scenario, modifying conditions to avoid minimum thresholds How do we work toward a balance? Value can direct the need to increase recharge or decrease production leading to needs for projects.
41 Sustainable Yield Modeling Analysis Modeling Approach Lower groundwater production through reduced agricultural acreage/demand across the model domain Reduce Urban unit water use to GPCD Assumptions 25-Year Implementation Period: operations will remain consistent, and groundwater levels will continue to decline until 2040 Inter-Subbasin Flows: adjoining subbasins will operate similarly to Merced, whereas subsurface flows will remain similar to long-term average historical conditions Basin Storage 25-Years 50-Years DRAFT Results: Initial simulations only address subbasin yield, analysis is needed to gauge effect on ensure minimum thresholds.
42 Modeling Assumes Glidepath to Sustainability Between 2020 and 2040 Groundwater Elevation GSP Implementation Rate Potential Threshold Sustainable Management

43 Sustainable Yield Land and Water Use Budget Merced Groundwater Subbasin
44 Sustainable Yield Groundwater Budget Merced Groundwater Subbasin

45 Sustainable Yield Groundwater Budget Merced Groundwater Subbasin

46 Sustainable Yield Groundwater Budget Merced Groundwater Subbasin
47 Sustainable Yield Modeling Results Allocations needed to bring the basin into sustainability by 2040 Groundwater Production 620,000AF 1.0 AF/Ac** Pumping Reduction 100,000AF ~20% Surface Water Supply 360,000AF 2.6 AF/Ac* Notes: Surface Water Yield: is defined as total surface water supplies divided by the ag acreage within MID, SWD, MCWD, and TIWD Groundwater Yield: is defined as basin pumping divided by the total acreage of the basin, both developed and undeveloped
48 Sustainable Yield - Next Steps Identify Projects and Management Actions to Increase Supply Availability and Potentially Reduce Demands Evaluate supply-side options and their effect on yield Evaluate various governance options (water market, etc.)
49 Data Management Approach and DMS Demo
50 DMS Success Criteria Beyond Requirements Now Flexible and open one-stop-shop Transparent and efficient data entry and visualization Coordination and sharing Automated reporting Future Sustainable groundwater management monitoring Ability to track undesirable results


51 Opti is a Ready-to-Use Proven Tool 10 IRWM groups have used Opti, 3+ GSAs are implementing Opti Off-the-Shelf customized DMS to meet the specific needs of the Merced Basin Meets all current phase Success Criteria Open platform enables future enhancements


52 Opti Features Web-based, GIS-enabled Easy-to-Use Flexible Data Structure to Store and Manage Different Datasets User and Agency Security/Permissions Data Entry and Validation Visualization and Analysis Query and Reporting Framework to Link to other Data Management Systems and Modeling Results
53 How Opti Will Evolve (Short-term) Currently: Imported groundwater level data collected through SGMA Readiness project Imported streamflow, precipitation, groundwater quality, and surface water quality collected through previous IRWMP effort Updated DWR/CASGEM data Planned: Collect and input additional agency/private owner data Add model results and ability to view
54 Public Outreach Update


55 Public Outreach Update Public Workshop Presentation August 2 What is SGMA? What is a GSA? What is a GSP? Current Merced Subbasin Groundwater Conditions Undesirable Effects of Overuse of Groundwater Groundwater Sustainability and What it Means
56 Public Outreach Update Sample Questions Asked about SGMA, GSAs and GSPS What is the approval process from the State? Does the public get to review the draft GSP? Sample Questions Asked about Current Groundwater Conditions For the groundwater model being used, will there be ground truthing or validation of the model with real time well data? When it comes to measuring well depths, will it be the responsibility of each individual to recharge their own well if the elevation drops? Are people going to have to track their individual well water usage?
57 Public Outreach Update Discussion with Attendees about Undesirable Effects Improved land use planning is important Coordination with private well groundwater use is needed More education about water use efficiency is needed More surface water is needed Lower groundwater levels negatively affect drinking water supplies for rural schools No water transfers out of the Merced Subbasin Water shortages increase contamination Smaller farmers are not able to afford deeper wells
58 Public Outreach Update Discussion about Sustainability and What it Means Farming and economics need to keep the economy healthy, water is the driver of the whole area Find ways to recharge the groundwater Increase groundwater banking Harvest rainwater/stormwater in urban areas Use the groundwater model for land use decisions Capture Merced River flood flows Consider use of groundwater credits Put recharge areas in subsidence areas Supply surface water to subsidence areas Capture urban runoff in subsidence areas Need federal funding to pay for all this
59 Coordination With Neighboring Basins Update


60 Coordination with Neighboring Basins
61 Inter-Subbasin Coordination - Chowchilla Modeling teams have met to discuss: Interbasin coordination needs, Data and information sharing Technical approach by respective subbasins on sustainability analysis and relationship to the interbasin coordination Chowchilla Subbasin Modeling Approach Development the Madera County Model, a refined version of the C2VSimFG, carved out to include the Chowchilla and Madera Subbasins with 5 mile buffer and will include: Refinement of surface water features, Refinement of the agricultural demand estimations, Localized calibration and aquifer analysis
62 DWR Technical Support Services Update
63 Questions/Comments from Public
64 Next Steps
65 Next Steps Incorporate comments into Sustainable Yield analysis Begin discussion of projects and management actions Adjourn to next meeting (Monday, September 24, 1:30 PM, location Castle Airport) Focus for September meeting Minimum Thresholds Water Budget & Sustainable Yield Projects and management actions
66 GSP Coordinating Committee Coordinating Committee Meeting August 27, 2018 Merced Irrigation-Urban GSA Merced Subbasin GSA Turner Island Water District GSA-1