CASE STUDY. Combined Heat and Power System Installation at Atrium II Condominium, 65 Spring Garden Avenue, Toronto
|
|
|
- Johnathan Burke
- 5 years ago
- Views:
Transcription

1 CASE STUDY Combined Heat and Power System Installation at Atrium II Condominium, 65 Spring Garden Avenue, Toronto
2 2
3 ATRIUM II COMBINED HEAT & POWER- CASE STUDY Contents 1. Executive Summary Project Description and Rationale Design and Installation Project Performance CHP System Production CHP System Efficiency CHP System Financial Analysis Financial Results for the First 10 Months Projected Electricity Cost Savings Conclusions...13

4 1. Executive Summary The Atrium II Condominium is a 35-year-old, 24-storey high rise condominium building managed by Crossbridge Condominium Services. Figure 1-65 Spring Garden Avenue Faced with rising natural gas and electricity costs, the 65 Spring Garden board of directors saw an opportunity to save on the cost of electricity and to reduce space and domestic hot water heating costs. The board of directors also saw an opportunity to reduce greenhouse gas emissions and to benefit from the Behind the Meter Generation incentive for Combined Heat and Power (CHP) projects. 4
5 Combined Heat and Power System Cost $1,600,000 Electricity Generated in 10 Months 2,382 MWh 79% of total building electricity demand 10 Months Energy Cost Savings $80,000 Projected Annual Electricity Cost Savings in 1st year Projected Annual Electricity Cost Savings after 10 years Net Annual Greenhouse Gas Emissions with CHP $96,000 $115,000 with 2% annual electricity cost increase $162,000 - with 6% annual electricity cost increase +100 Tonnes CHP systems capture the waste heat from the engine that spins an electrical generator and use this heat for space or water heating. As a result, they can have energy efficiencies of more than 80 percent. This compares with 60 percent energy efficiency of a standalone natural gas-fired combined cycle power plant, which can lose up to another 10 percent of produced energy through transmission losses. From a power system perspective, CHP systems can offset the need for new centralized generation and transmission capacity and reduce pressure on the aging Toronto distribution grid. By opting for CHP, the board also ensured that the building could remain fully functional during a blackout, rather than just core emergency power loads remaining operational. Standard emergency power systems are designed to allow for a safe building evacuation; as such they only provide adequate power for emergency lighting and other critical systems. With the CHP system, the building s residents can remain in their suites during a blackout with no loss of functionality. The system was placed in service on December 1, 2017 and has produced an energy cost savings of about $80,000 in its first ten months of service.

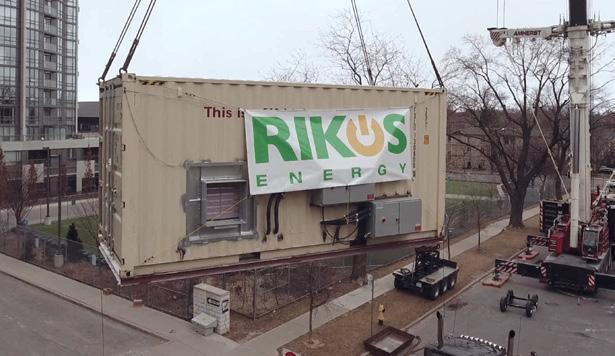
6 Figure 2 - CHP System Being Lifted Into Place 2. Project Description and Rationale The Atrium II condominium is a 24 storey condominium registered in It is currently managed by Crossbridge Condominium Services. Rikos Energy approached Atrium II to use the 246-unit building as a site for installation of a 500kW rooftop combined heat and power (CHP) system. The CHP system was installed on the building s roof for proximity to existing boilers, which involved lifting a 20 foot-long container to the top of the 25 storey building. Lifting the CHP system on to the roof is shown in Figure 2. The existing diesel standby generator was retained. The standby generator complies with CSA Standard (Emergency electrical power supply for buildings). Since the CHP system was not going to be the emergency back-up generator, it could therefore be connected to the existing natural gas supply to boilers in the penthouse. The waste heat from this process could then be transferred to domestic hot water (DHW) storage through a heat exchanger and to the fan coil based space heating system. 6 Benefits of CHP include a local source of power that avoids significant transmission losses and increased operational efficiency over conventional electricity generation. Furthermore, by helping to reduce peak demand, CHP systems can help to prevent or postpone the need for future investment in a new transmission corridor into the City of Toronto.

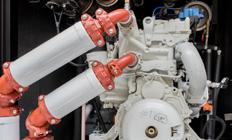
7 3. Design & Installation The 65 Spring Garden Ave. CHP system was designed to supply about 75% of the building s peak electricity demand. For a grid supply outage the CHP system was designed to supply the electrical load of the building when the demand was less than the rated output of the system. When the building demand was greater than the CHP system rated output, the air conditioning load would be shed in the summer and the driveway heater load would be shed in the winter. The existing diesel standby generator remained in service and was used to supply emergency power loads if the CHP system was not running during a grid outage or if load shedding was required. The CHP system consists of two MAN E2676, 250kW, lean burn engines (figure 3), fitted with 250kW WEG 600V generators. The generators are 94% efficient. So, system capacity is 2 X 250kW X 94% = 470kW. The system was designed so that the electrical output would follow the building electrical load. The heat produced is used for space and domestic hot water heating as seen in figure 4. In situations where the building cannot use the CHP system heat, the excess heat is sent to radiators on the roof. The system went into service December 1, Actual system performance is described in the following section. Figure 3 - MAN E2676, 250 kw, lean burn engine as seen from inside container
 shows the CHP system output verses total building load from December 1, 2017 to September 30, 2018.")
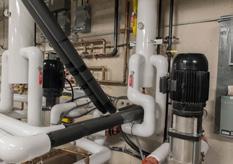
8 Figure 4 - Heat recovery system in mechanical room 4. Project Performance The following graph (Figure 5) shows the CHP system output verses total building load from December 1, 2017 to September 30, September 30 results are the latest results available at the time this case study was prepared. 4.1 CHP System Production The blue line on Figure 5 represents the kwh hours supplied by the grid. The purple line shows the kwh supplied by the CHP system and the red line shows the monthly kwh consumption of the building. 2,382 Megawatt hours was produced during the study period. It can be seen that the building load and the CHP system output peaked in January and July, with the peak in July being the larger peak. The January peak corresponds with the winter heating peak and the July peak corresponds with the summer cooling peak. The bar chart on figure 4 shows the building load, cooling degree days and heating degree days. The building load is highest when the cooling degree days peak in July and represents the highest production for the CHP system. 8
9 Electricity Production Atrium II kwh CHP System Output Toronto Hydro Supply Total Building Load Dec Jan Feb Mar Apr May Jun Jul Aug Sep Figure 5 - Atrium II Electricity Production It should be noted that engine number two was out of service for most of April for warranty repairs, reducing the system production for April. 800 Electricity Production Atrium II Building Load Cooling degree days Heating Degree Days Dec Jan Feb Mar Apr May Jun Jul Aug Sep Figure 6 - Building Load vs Cooling & Heating Days
10 4.2 CHP System Efficiency The CHP system efficiency was calculated by dividing the net electrical output plus the usable heat output by the energy in the natural gas consumed by the engines. The natural gas energy value used was the gross heating value of 38.7MJ/m³. The gross heating value is the total heat obtained by complete combustion at constant pressure of a unit volume of gas in air, including the heat released by condensing the water vapour in the combustion products. The graph shows the system efficiency over the study period. The grey line shows the actual efficiency for each month, the orange line shows the average efficiency for the period. It can be seen that the efficiency is highest in the winter months when the heat produced by the CHP system can be used for space heating in the building. Average efficiency for the first 10 months of service was 61.87% CHP System Efficiency Atrium II Average Eff Actual Eff Dec Jan Feb Mar Apr May Jun Jul Aug Sep Figure 7 - CHP System Efficiency Figure 7. shows the system efficiency over the study period. The grey line shows the actual efficiency for each month, the orange line shows the average efficiency for the period. It can be seen that the efficiency is highest in the winter months when the heat produced by the CHP system can be used for space heating in the building. Average efficiency for the first 10 months of service was 61.87%. 10

11 5. CHP System Financial Analysis The CHP system financial analysis includes financial results for the first 10 months of operation and a projection of the electricity cost savings for the next ten years. 5.1 Financial Results for the First 10 Months Costs and savings generated by the CHP system are shown below in Figure 8. CHP System Monthly Financial Figure 8 - CHP System Financial Revenue generated by the sale of heat and electricity was about $251,000 and is shown in green. The cost of natural gas to run the engines was about $171,000 and is shown in red. The cost of maintenance for the 10 months is not included.
12 When the CHP system went into service in December 2017, the Atrium II condominium was an Enbridge customer being billed on Rate 6, paying $0.2645/m³. During 2018 it was determined that, because of the natural gas generator and the increased natural gas consumption, Atrium II qualified for Enbridge rate 110. The combined effect of negotiating a better gas price from ECNG their natural gas retailer and moving to Rate 110, reduced the cost to $0.2118/m³. These prices included the $0.033/m³ carbon tax, which is slated to end October 1st So, with the elimination of the carbon tax and the reduced natural gas cost, it is expected that the monthly cost savings will increase. Energy cost savings for the 10 month period were about $80,000 and are shown in blue. Extrapolated over one year the annual energy cost savings would be $96, Projected Electricity Cost Savings It is difficult to forecast the cost of electricity over the coming years in Ontario. For that reason it is difficult to project future savings for the Atrium II CHP system. Annual Electricity Savings Projection Vs Electricity Cost Increase Cost Savings Figure 9 - Projected Annual Electricity Cost Savings 12
13 For the purpose of estimating future savings a range of 2% to 6% annual electricity cost increases was used and is shown in figure 9 above. Annual savings for 2% annual electricity cost increase is shown by the blue line. A 2% annual increase would result in annual savings of $96,000 in 2018 and by about $115,000 by A 6% annual increase in electricity prices would result in annual savings of $96,000 in 2018 and by about $162,000 by Conclusions The Atrium II CHP system project has faced a number of challenges, including: lower than expected electricity prices, higher than expected fuel cost in the form of a carbon tax and failure of one of the two engines for several weeks. Despite these setbacks the CHP system provided an electricity cost savings of about $80,000 for the 1st ten months of service. With lower natural gas cost, due elimination of the carbon tax and switching to the Enbridge lower cost Rate 110, it is expected that electricity cost savings per Megawatt Hour (MWh) will improve in the coming year. The system produced 2,382 MWh of electricity over the 10 month period, an average of 238 MWh per month. It is expected that with the warranty repairs completed on engine 2 and refinements that have been made to the engine control settings, the production will exceed 250 MWh per month going forward.


14 Appendix 1 - Images taken from CHP System Installation 1. Staging area for generator enclosure lift to 65 Spring Garden roof top 2. Generator enclosure suspended over 65 Spring Garden roof top 3. Generator enclosure being lowered onto its support structure 4. Final positioning of generator enclosure 5. View of generator enclosure and crane from the street 6. End view of one of the natural gas engines inside the generator enclosure 7. Plumbing connections between natural gas engines and building heating loop 8. Installation of support springs under generator enclosure 9. Generator control system display showing generator delivering 210 kw to the building


15
16 145 Industrial Pkwy South, Unit 12. Aurora, ON L4G 3V5 Toll Free: Direct: 1 (416)