SALT LAKE CITY DEPARTMENT OF PUBLIC UTILITIES. Comprehensive Water, Sewer, and Stormwater Rate Study
|
|
|
- Winfred Warren
- 5 years ago
- Views:
Transcription

1 SALT LAKE CITY DEPARTMENT OF PUBLIC UTILITIES Comprehensive Water, Sewer, and Stormwater Rate Study Draft-Final Report / July 17, 2018
2

3 5619 DTC Parkway Suite 850 Greenwood Village, CO Phone July 16, 2018 Ms. Laura Briefer Director of Public Utilities Salt Lake City Department of Public Utilities 1530 South West Temple Salt Lake City, UT Subject: Comprehensive Water, Sewer, and Stormwater Rate Study Dear Ms. Briefer, Raftelis is pleased to provide this 2018 Water, Sewer and Stormwater Rate Study to the Salt Lake City Department of Public Utilities. The Report details the revenue requirement, cost of service, and rate design analysis used to develop proposed fiscal year 2019 water, sewer, and stormwater rates. This study also includes a review and update to the City s miscellaneous water, sewer, and stormwater fees. As part of this study, the City convened a Rate Advisory Committee (RAC). The RAC was charged with reviewing and providing recommendations to Staff and the Public Utilities Advisory Board (PUAC) on water and sewer rate structure alternatives. The RAC s final recommendations are discussed in this report along with the PUAC recommendation to City Council. We would like to thank you, Mr. Brad Stewart, Mr. Kurt Spjute and the members of the RAC for their assistance and support during this study. Questions regarding this report and the Study should be direct to Mr. Cristiano or me at the contact information below. Sincerely, RAFTELIS, INC. Rick Giardina Executive Vice President rgiardina@raftelis.com Todd Cristiano Manager tcristiano@raftelis.com
4
5 TABLE OF CONTENTS Executive Summary Introduction Study Findings and Recommendations Rate Advisory Committee Public Utilities Advisory Committee Water Rate Study Sewer Rate Study Stormwater Rate Study Miscellaneous Fees Study... 7 Introduction Study Background Cost-of-Service Approach Reliance on Department-Provided Data Acknowledgement...10 Water Rate study Introduction Cost-of-Service Process Projected FY19 Revenue at FY19 Utility Presented Rates Test Year Revenue Requirement Revenue Requirement Cost Allocation Functional Cost Components Allocation Factors Allocation of Functionalized Costs Allocated Revenue Requirement Customer Class Units of Service Unit Cost of Service Distribution of Costs to Customer Classes Comparison of FY19 Proposed Raftelis Cost of Service to Revenue at FY19 Utility Presented Rates County Differential Rate Design Introduction FY19 Utility Presented and FY19 Proposed Raftelis Structure and Rates Typical Monthly City Single Residence Bills Summer Usage Secondary Irrigation Water Rate...24 Sewer rate study Introduction Cost-of-Service Process Projected FY19 Revenue at FY19 Utility Presented Rates Test Year Revenue Requirement Revenue Requirement Cost Allocation Functional Cost Components Salt Lake City Department of Public Utilities Water, Sewer and Stormwater Rate Study
6 4.5.2 Allocation of Functionalized Costs Allocated Revenue Requirement Development of Cost of Service Units of Service Unit Cost of Service Distribution of Costs to Customer Classes Comparison FY19 Proposed Raftelis Cost of Service to Revenue at FY19 Utility Presented Rates Rate Design Introduction FY19 Utility Presented and FY19 Proposed Raftelis Structure and Rates Typical Monthly Bill Comparison Stormwater rates Introduction Projected FY19 Revenue at FY19 Utility Presented Rates Test Year Revenue Requirement Rate Design Introduction FY19 Utility Presented and FY19 Proposed Raftelis Rates Miscellaneous fees Introduction Process Water Utility Fees Connection Fees Other Miscellaneous Fees Charges to City and County Fire Departments Proposed New Fees Sewer Utility Fees Sewer Miscellaneous Fees Sewer Pretreatment Fees Stormwater Utility Fees...44 Salt Lake City Department of Public Utilities Water, Sewer, Stormwater, and Street Light Rate Study
7 LIST OF TABLES Table 1.1: Water Current and Proposed Rate Structure Alternatives City and County...3 Table 1.2: Sewer FY19 Utility Presented and FY19 Proposed Raftelis Rate Structure...4 Table 1.3: Water FY19 Utility Presented and FY19 Proposed Raftelis Fixed Charges (1)...5 Table 1.4: Water FY19 Utility Presented and FY19 Proposed Raftelis Residential Volume Rates (1) City Customers...6 Table 1.5: Sewer - Comparison of FY19 Utility Presented and FY19 Proposed Raftelis Rates...7 Table 1.6: Stormwater - Comparison of FY19 Utility Presented and FY19 Proposed Raftelis Rates...7 Table 3.1: Water - FY19 Revenue at FY19 Utility Presented Rates...12 Table 3.2: Water FY19 Revenue Requirement...12 Table 3.3: Water FY19 Allocated Revenue Requirement...15 Table 3.4: Water FY19 Proposed Raftelis Customer Class Units of Service...16 Table 3.5: Water FY19 Proposed Raftelis Unit Cost of Service...17 Table 3.6: Water FY19 Proposed Raftelis Distribution of Cost of Service to Customer Classes...17 Table 3.7: Water Comparison of FY19 Proposed Raftelis Cost of Service to Revenue at FY19 Utility Presented Rates...18 Table 3.8: Water - Development of County Rate Differential Based on a FY18 Revenue Requirement...20 Table 3.9: Water FY19 Utility Presented and Proposed Rate Structures...21 Table 3.10: Water FY19 Utility Presented and FY Proposed Raftelis Fixed Charges...22 Table 3.11: Water - FY19 Utility Presented and FY19 Proposed Raftelis Single Residence Volume Rates (1,2) City Customers...23 Table 3.12: Water FY19 Typical Monthly Summer Bills - Single Residence City Customers...24 Table 3.13: Water - Secondary Irrigation Water Rate Calculation...25 Table 4.1: Sewer - FY19 Revenue at FY19 Utility Presented Rates...27 Table 4.2: Sewer - FY19 Revenue Requirement...28 Table 4.3: Sewer FY19 Allocated Revenue Requirement...29 Table 4.4: Sewer FY19 Proposed Raftelis Units of Service...30 Table 4.5: Sewer - Calculation of Minimum Bill Revenue...31 Table 4.6: Sewer FY19 Proposed Raftelis Unit Cost of Service...31 Table 4.7: Sewer FY19 Proposed Raftelis Customer Class Cost of Service...32 Table 4.8: Sewer Comparison of FY19 Proposed Raftelis Cost of Service to Revenue at FY19 Utility Presented Rates...33 Table 4.9: Sewer - FY19 Utility Presented Rates (1)...34 Table 4.10: Sewer FY19 Proposed Raftelis Rates (1)...35 Table 4.11: Sewer - Typical Monthly Bill Comparison...35 Table 5.1: Stormwater FY19 Revenue at FY19 Utility Presented Rates...36 Table 5.2: Stormwater - FY19 Revenue Requirement...37 Table 5.3: Stormwater FY19 Comparison of FY19 Utility Presented and FY19 Proposed Raftelis Rates...38 Table 6.1: Water Connection Fees...40 Table 6.2: Water Utility Metering Fees...41 Table 6.3: Fire Hydrant Maintenance Fees...41 Table 6.4: Flat Water Charge to City and County Agencies...42 Table 6.5: Proposed Water Utility Fees...42 Table 6.6: Sewer Miscellaneous Fees...43 Table 6.7: Sewer Pretreatment Fees...44 Table 6.8: Stormwater Miscellaneous Fees...44 Salt Lake City Department of Public Utilities Water, Sewer and Stormwater Rate Study
8 LIST OF APPENDICES APPENDIX A: Rate Advisory Committee Final Report APPENDIX B: Water Utility Cost-of-Service Analysis APPENDIX C: Sewer Utility Cost-of-Service Analysis APPENDIX D: AWC Billing Technical Memorandum Salt Lake City Department of Public Utilities Water, Sewer, Stormwater, and Street Light Rate Study
9 This page intentionally left blank to facilitate two-sided printing. Salt Lake City Department of Public Utilities Water, Sewer and Stormwater Rate Study
10
11 EXECUTIVE SUMMARY The Salt Lake City Department of Public Utilities (Department) retained Raftelis to conduct a water, sewer, stormwater rate and miscellaneous fees study. This study included the following:» Engaging a Rate Advisory Committee (RAC) to provide input and feedback on water and sewer rate structure alternatives to the PUAC.» Development of revenue requirements for the water, sewer and stormwater utilities for fiscal year (FY)19 12.» Analysis of customer class cost of service for each utility.» Design of cost-of-service rates and rate alternatives as recommended by the Rate Advisory Committee for FY19.» Review and update the Department s miscellaneous fees for the water, sewer and stormwater utilities. Raftelis applied industry standard methodologies supported by the American Water Works Association (AWWA) Principles of Water, Rates, Fees, and Charges M1 manual and the Water Environment Federation Financing and Charges for Wastewater Systems Manual of Practice, No. 27 in the development and design of utility rates Rate Advisory Committee Department Staff assembled a Rate Advisory Committee to participate in a review of the Department s water and sewer rate structures. Raftelis along with The Langdon Group and Department Staff, facilitated six meetings with the RAC. These meetings included, among other topics, the identification and ranking of pricing objectives, RAC input on alternative rate structures, and the RAC s recommended rate structure for FY19 implementation designed to meet the identified goals and objectives. The results were presented to the Department s Public Utilities Advisory Committee (PUAC) on January 25, 2018 for their review and recommendation to the Mayor and City Council. Appendix A contains the 2018 Rate Advisory Committee report summarizing the water and sewer rate structure recommendations. The RAC developed rate alternatives based on the following ranked pricing objectives: 1. Conservation 2. Essential use affordability 3. Demand management 4. Rate stability 1 FY19 is the period from July 1, 2018 through June 30, The term FY19 Utility Presented shown in this report are the adopted FY18 rates for water, sewer, and stormwater multiplied by the FY19 proposed revenue adjustment for each utility. Water, Sewer and Stormwater Rate Study Report 1
12 5. Interclass equity 6. Intraclass equity To meet these objectives, the RAC recommended the following modifications to the water and sewer rate structures: Water Rate Structure Recommended Alternatives» Retain the fixed charge by meter size. Modify the price ratio between the meter sizes to reflect capacity potential of each meter size to a ¾ meter. This fixed charge modification is recommended regardless of which volumetric rate alternative is selected.» The RAC recommended two water volumetric rate structure alternatives using a class-based cost-of-service rate for consideration to the PUAC. Table 1.1 compares the existing rate structure and the alternative rate structures. Many alternatives were considered by the RAC. For purposes of this report, the original names of the alternatives, as considered by the RAC, have been retained. o o Alternative #2: COS/Existing Structure Adjusted for COS. Retain the fixed-block rate structure for all residential customers and the average winter consumption (AWC)- based rate structure for commercial, institutional and industrial (CII) customers. Reduce the block 4 threshold from 70 hundred cubic feet (ccf) to 60 ccf for the single residence, duplex, and triplex customer classes. Reduce the CII block 4 threshold from 700% of AWC to 600% of AWC. Alternative #3: COS/AWC All Modify the existing fixed-block structure for single residence, duplex, and triplex to an AWC-based 4 block rate structure, the same structure as CII. Set the single residence, duplex, and triplex customer class block 4 threshold at 600% of AWC. Reduce the CII customer class block 4 threshold from 700% of AWC to 600% of AWC. 2 Salt Lake City Department of Public Utilities
13 Block Winter Period (Nov-Mar) Table 1.1: Water Current and Proposed Rate Structure Alternatives City and County FY19 Utility Presented Residential (1) CII (2) Alt. #2 COS/Existing Block 1 Rate for All Usage Alt. #3 COS/AWC All FY19 Utility Presented Summer Rate Structure (April through November) Alt. #2/ Alt. #3 Block 1 Rate for All Usage Block ccf 0-10 ccf 0-AWC (3) 0-AWC 0-AWC Block ccf ccf AWC-300% AWC-300% AWC-300% Block ccf ccf 300%-600% 300%-700% 300%-600% Block 4 >70 ccf >60 ccf >600% >700% >600% (1) Single residence block 1: 0 to 10 ccf Duplex block 1: 0 to 13 ccf Triplex block 1: 0 to 16 ccf (2) Alternative #2 and Alternative #3 CII rate structures are the same. (3) AWC = Average Winter Consumption. AWC 300% means usage greater than a customer s AWC and less than or equal to 300% of the customer s AWC. Sewer Rate Structure Recommended Alternatives» Retain the customer class volumetric rate structure by volume and strength of wastewater flow for each alternative. Strength categories include biochemical oxygen demand (BOD) and total suspended solids (TSS). The two alternatives recommended are: o Alternative #1: No Minimum Charge. Eliminate the minimum charge. Customers are only charged for their AWC monthly flow. o Alternative #3: Reduced Minimum Charge. Reduce the minimum charge allowance from 4 ccf to 2 ccf. This reduces the minimum charge by approximately 43. Table 1.2 shows the existing sewer rate structure. The proposed structure remains unchanged from the existing. Water, Sewer and Stormwater Rate Study Report 3
14 Table 1.2: Sewer FY19 Utility Presented and FY19 Proposed Raftelis Rate Structure Class (1) BOD Strength mg/l TSS Strength mg/l Flow $ per ccf BOD $ per ccf TSS $ per ccf Applies to Existing and All Alternatives , , ,200 1,500 1,200 1, ,500 1,800 1,500 1,800 Same volume rate for all classes Volume rate varies by BOD strength 7 >1,800 >1,800 Special Rate by Customer Volume rate varies by TSS strength (1) Customers in classes 1 through 6 are billed monthly based on their average winter consumption (AWC) times the sum of the rates for flow, BOD, and TSS rates or a minimum charge whichever is greater. AWC is the average of water usage for the months November through March Public Utilities Advisory Committee Staff presented the water and sewer alternatives at the PUAC s January 25, 2018 meeting. The PUAC recommended the following:» Water: o Monthly fixed charge: Varies by meter size; capital costs by meter size varies by on meter capacity ratios. o Volume rate structure: Alternative #2: COS/Existing Structure Adjusted for COS» Sewer: Alternative #3: Reduced Minimum Charge The remainder of this report will show the proposed water and sewer rates under these alternatives. The term proposed rates refers to rates based on the recommended rate structure alternatives from the PUAC Water Rate Study FY19 Proposed Raftelis water rates for were developed based on the following:» A system-wide 4% revenue increase over FY18» Customer class cost-of-service analysis» Rate structure recommendations from the RAC and final recommendations from the PUAC Fixed Charge The proposed fixed charge varies by meter size. The fixed charge recovers the following costs: meter reading/billing, customer service, and a portion of capital costs. Meter reading, billing and customer service costs do not vary by meter size. Capital costs increase as meter size increases recognizing the additional costs to serve larger capacity customers. The capital cost differential by 4 Salt Lake City Department of Public Utilities
15 meter size is based on the ratio of the maximum allowable flow capacity to a ¾ meter. Table 1.3 shows the FY19 Utility Presented and FY19 Proposed Raftelis fixed charges. Table 1.3: Water FY19 Utility Presented and FY19 Proposed Raftelis Fixed Charges (1) Meter Size FY19 Utility Presented FY19 Proposed Raftelis Change - $ Change - % 3/4" $9.89 $8.84 ($1.05) (11%) % 1 ½ % 2" % 3" % 4'' % 6" % 8" % % (1) County fixed charges are 1.35 times City fixed charges. Volume Rates The proposed volume structures for residential and commercial (CII) retains the 4-block inclining structure. The irrigation volume structure retains the 3-block inclining structure. The residential rate structure is a fixed block structure while the commercial or CII class is an individualized structure. Residential rates include single residence, duplex, and triplex classes. CII includes commercial, industrial, and institutional customers. The CII structure s thresholds are based on each customer s average winter consumption (AWC). The irrigation structure retains the individualized target budget-based structure. The volume rates developed in this study are based on each class cost of service. Table 1.4 shows the FY19 Utility Presented and FY19 Proposed Raftelis rates. Water, Sewer and Stormwater Rate Study Report 5
16 Table 1.4: Water FY19 Utility Presented and FY19 Proposed Raftelis Residential Volume Rates (1) City Customers Block RESIDENTIAL (2) FY19 Utility Presented $ per ccf FY19 Proposed Raftelis $ per ccf Winter (November April) Change - $ Change - % All Usage $1.35 $1.30 ($0.05) (3.7%) Summer (April October) 1 $1.35 $1.30 ($0.05) (3.7%) (0.07) (3.8%) (0.10) (3.9%) (0.11) (4.0%) COMMERCIAL Winter (November April) All Usage $1.35 $1.42 $ % Summer (April October) 1 $1.35 $1.42 $ % % % % IRRIGATION Winter (November April) All Usage ($0.14) (7.6%) Summer (April October) 1 $ (0.14) (7.6%) (0.19) (7.4%) (0.21) (7.7%) (1) County rates are 1.35 times City rates (2) Includes single residence, duplex, and triplex. See Table 1.1 for the block thresholds for each class Sewer Rate Study FY19 Proposed Raftelis sewer rates were developed based on the following:» A system-wide 15% revenue increase» Customer class cost-of-service analysis» Rate structure recommendations from the RAC and final recommendations from the PUAC The FY19 Proposed Raftelis sewer structure and rates retain the customer class by sewer strength classification. The customer classes are assessed unit charges ($ per ccf) for flow, BOD, and TSS. Table 1.5 summarizes the FY19 Utility Presented and FY19 Proposed Raftelis rate structure and rates. 6 Salt Lake City Department of Public Utilities
17 Table 1.5: Sewer - Comparison of FY19 Utility Presented and FY19 Proposed Raftelis Rates Class BOD Strength mg/l TSS Strength mg/l FY19 Utility Presented (1) FY19 Proposed Raftelis (2) Change - $ Change - % $3.05 $3.11 $ % $ % $ % , , $ % 5 1,200 1,500 1,200 1, $ % 6 1,500 1,800 1,500 1, $ % 7 >1,800 >1,800 Special Rate by Customer Extra Strength Rates, $ per lb Chemical oxygen demand (COD) $0.221 $0.356 $ % Biochemical oxygen demand (BOD) $ % Total suspended solids (TSS) $ % (1) Customers in classes 1 through 6 are billed monthly based on their average winter consumption (AWC) times the sum of the flow rates for flow, BOD, and TSS or a minimum charge of $11.93 whichever is greater. AWC is the average of water usage for the months November through March. (2) Customers in classes 1 through 6 are billed monthly based on their average winter consumption (AWC) times the sum of the flow rates for BOD, and TSS rates or a minimum charge of $6.82 whichever is greater. AWC is the average of water usage for the months November through March Stormwater Rate Study Table 1.6 shows compares the FY19 Utility Presented and FY19 Proposed Raftelis stormwater fees. There is no change to the structure for FY19. Table 1.6: Stormwater - Comparison of FY19 Utility Presented and FY19 Proposed Raftelis Rates Customer Class FY19 Utility FY19 Proposed Presented Raftelis Change $ Change % 1 or 2 Units <.25 acres $4.94 $4.94 $ % 1 or 2 Units > % 3 or 4 Units % Impervious Area Based % Miscellaneous Fees Study The Department assesses fees for various goods and services associated with providing water, sewer, and stormwater service. These goods and services directly benefit the customer requesting the service. As such, these costs are passed directly to the customer rather than through all rate payers. Raftelis reviewed selected fees from the water, sewer, and stormwater utilities, proposed updates and also evaluated new fees for the utilities. The existing and proposed fees can be found in Section 7 of this report. The fee categories reviewed include: Water, Sewer and Stormwater Rate Study Report 7
18 » Water connection fees» Meter inspection and testing» Fire hydrant maintenance fees» Flat water charge City and County Agencies» Pressure testing» Disconnection» Plan review fees» Sewer inspections/industrial wastewater discharge permits» Stormwater inspection fees» Stormwater discharge permits 8 Salt Lake City Department of Public Utilities
19 INTRODUCTION The Department retained Raftelis to update their water, sewer and stormwater cost-of-service and rate structures. The Department also requested that Raftelis evaluate each utility s miscellaneous fees and make recommendations for updates and/or additions to the fee schedule. The Department convened a Rate Advisory Committee to review, evaluate and provide recommendations on changes to the rate structures 3. The RAC committee held six meetings over a six-month period to learn about the water and sewer systems, the rate-setting process and evaluate rate structure alternatives. The RAC s recommended rate structure alternatives were presented to the PUAC for their review and recommendation to City Council. The RAC report is contained in Appendix A of this report. Raftelis developed the FY19 revenue requirement, conducted a detailed customer class cost-ofservice analysis, and designed water and sewer rates based on the RAC s recommended rate structure alternatives. The revenue requirement analysis included calculating the revenue required from rates to meet the water and sewer utilities projected FY19 expenditures, target reserve requirements, and debt service coverage requirements. The water and sewer cost-of-service analysis included a comprehensive review of customer water usage and billable sewer flow data from FY15 through FY17, calculating water demand and sewer flow and strength requirements, allocating functionalized costs to customer service characteristics and determining the cost to serve each customer class. The customer class cost of service serves as the basis for the water and sewer rates presented in this report. This report contains the following sections:» Section 1 - Executive Summary. Summarizes the study results for the water, sewer stormwater cost of service analysis and rate structure alternatives design.» Section 2 Introduction and Background. Provides an overview and purpose of study as well as those involved in the study process.» Section 3 Water Rate Study. Details the water rate study analysis» Section 4 Sewer Rate Study. Details the sewer rate study analysis.» Section 5 Stormwater Rate Study. Details the stormwater rate study analysis.» Section 6 Miscellaneous Fees. Details current and proposed fees along with new fees for the water, sewer, and stormwater utilities Cost-of-Service Approach The industry accepted process for conducting a water utility cost of service study is detailed in the American Water Works Association (AWWA) Manual of Water Supply Practices M1, Principles of 3 Ultimately, the Department excluded the stormwater rate structure review from the RAC s analysis. Their primary focus was water and sewer rate structure alternatives analysis. Water, Sewer and Stormwater Rate Study Report 9
20 Water Rates, Fees, and Charges (AWWA Manual M1). The industry accepted process for conducting a wastewater utility cost of service study is detailed in the Water Environment Federation (WEF) Manual of Practice No. 27, Financing and Charges for Wastewater Systems published by the WEF. This study followed the industry accepted practices as presented in these publications with appropriate modifications to reflect the unique service characteristics and Department objectives. Such modifications are customary in any cost of service study and allow for the recognition of each utilities attributes while still conforming to general industry practices. During this project, the Department (and/or its representatives) provided Raftelis with a variety of technical information, including cost and revenue data. Raftelis did not independently assess or test for the accuracy of such data historic or projected. Raftelis have relied on this data in the formulation of our findings and subsequent recommendations, as well as in the preparation of this report. Raftelis also relied on cost allocation data provided by Bowen Collins and Associates (BCA) needed to complete the cost-of-service analysis. There are often differences between actual and projected data. Some of the assumptions used in this report will not be realized, and unanticipated events and circumstances may occur. Therefore, there are likely to be differences between the data or results projected in this report and actual results achieved, and those differences may be material. As a result, Raftelis takes no responsibility for the accuracy of data or projections provided by or prepared on behalf of the Department, nor do we have any responsibility for updating this report for events occurring after the date of this report. The successful completion of this study depended on the efforts of several staff members of the Utilities Department, Mayor s office, and Council office. In particular, the Raftelis study team would like to thank Ms. Laura Briefer, Mr. Brad Stewart, and Mr. Kurt Spjute for their support and guidance throughout this study process. 10 Salt Lake City Department of Public Utilities
21 WATER RATE STUDY The Department s water utility is a self-supporting enterprise fund with revenues collected from rates, impact fees, and other miscellaneous income 4 to meet the utility s annual operating and capital budget, maintain adequate reserves, and meet bond covenant debt service coverage requirements. For the purposes of this study, Raftelis used data provided by the Department to develop the costof-service and rate alternatives. This data included detailed historical water billing data, daily system water production data, detailed asset records, historical financial data, the projected FY19 operating and capital budget as well as information provided by Department Staff. The cost-of-service process is a method to assign costs based on each customer class proportionate share of water demands and number of customers. The cost-of-service analysis consists of the following nine steps: 1. Determine the FY19 rate revenue at FY19 Utility Presented rates 2. Determine test year revenue requirement 3. Functionalize revenue requirement 4. Allocate functionalized costs to cost components 5. Determine system units of service 6. Determine unit cost of service 7. Determine customer class units of service 8. Distribute costs to customer classes 9. Design rates to recover class cost-of-service and total revenue requirement Raftelis developed FY19 rate revenue at FY19 Utility Presented rates using detailed billing records provided by the Department. The revenue under FY19 Utility Presented rates shown in Table 3.1 serves as the basis for determining the FY19 revenue requirement. This billing data analysis is also used in the units of service analysis discussed in Section Other income include revenue from hydrant water sales, flat rate sales, repair and relocation, grounds and rentals, and transfers from the sewer, stormwater, street light, garbage, and transit funds for billing services. Water, Sewer and Stormwater Rate Study Report 11
22 Table 3.1: Water - FY19 Revenue at FY19 Utility Presented Rates Customer Class Accounts Billed Volume ccf Rate Revenue City Residential 48,446 8,385,282 $20,563,680 CII 7,809 14,056,634 23,846,532 Irrigation 1,568 2,263,834 4,987,423 Fire projection ,391 Total City 58,374 24,705,749 $49,482,026 County Residential 22,638 5,235,087 $16,802,108 CII 956 2,474,411 5,692,020 Irrigation ,350 1,299,796 Fire protection ,396 Total County 24,221 8,161,849 $23,807,320 Total 82,595 32,867,598 $73,289,346 The revenue requirement shown in Table 3.2 includes O&M, debt service and capital expenditures. These requirements are met from rate revenues, reserves and miscellaneous revenue. Table 3.2: Water FY19 Revenue Requirement Item $ Expenditures Operating expense $62,888,877 Debt service 1,117,000 Capital outlay 40,186,900 Total expenditures $104,192,777 Less: Adjustments Miscellaneous revenue ($963,000) Transfers (2,449,984) Non-operating income (1,755,000) Change in fund balance (25,735,447) Total adjustments ($30,903,431) FY19 revenue requirement $73,289, Salt Lake City Department of Public Utilities
23 The underlying principle in cost allocation is to convert the test year revenue requirement into costs that best reflect the cost associated with customer water demands placed on the system. Those costs are proportionately allocated to customer classes based on their respective customer service characteristics to determine class cost of service. Customer service characteristics include average day, peak day, and peak hour demands, the number of accounts, and the number of equivalent meters Functional Cost Components Water systems are comprised of several facilities (unit processes or functions) that are designed and operated to collect, treat, and distribute water to customers. The separation of costs into functional components provides a means for distributing costs to customer classes based their respective responsibility in the system. Typical functional categories for water systems include source of supply, transmission and distribution, treatment, pumping, storage, and customer-related costs Allocation Factors Water systems are designed and operated to meet the average and peak demands of their customers. Therefore, data on annual consumption and peak demand contributions are needed to allocate costs equitably among customer classes. Since customers do not exert their maximum demand for water at the same time, water facilities are designed to meet the coincidental demands on the system. Using system peak demand to average demand ratios provides a means for distributing costs equitably to customer classes. For every facility on the system, there is an underlying average demand, or uniform rate of usage, exerted coincidentally by customers for which the average day cost component applies. Certain facilities are operated and designed to meet the demand above the average day demand or maximum day extra-capacity demand. Costs associated with those facilities are allocated to both the average day and maximum day cost components. Similarly, other facilities are designed to meet demands in excess of maximum day requirements or maximum hour extra-capacity. Costs associated with these facilities are allocated to the average day, maximum day, and maximum hour cost components. The ratio of maximum day and average day demand is used to allocate costs between average day and maximum day cost components. A maximum day to average day ratio of 2.41 is used based on a four-year historical average. This indicates approximately 42% of the capacity of facilities designed and operated for maximum day demand is needed for average day demands use. Accordingly, the remaining 58% is for maximum day extra-capacity requirements. A ratio of maximum hour to average day water use of 3.25 is based on demands experienced by Department s water s system. This ratio indicates 31% of the capacity of facilities designed and Water, Sewer and Stormwater Rate Study Report 13
24 operated for maximum hour demand is needed for average day demands, 43% is required to meet maximum day extra-capacity demand, and the remaining 26% is for maximum hour extra-capacity demand. These ratios are used to allocate the line item functionalized costs to cost components. Other cost allocations are based on the allocation of all other categories. Other revenue requirements can be directly assigned to a specific cost component. Billing and administrative costs such as meter reading are allocated directly to the billing cost component. Indirect expenditures not specifically assigned are allocated in proportion to all other operations and maintenance cost components Allocation of Functionalized Costs Once costs have been separated by function, they can be further allocated to cost components using the demand factors identified in Section Allocating costs to cost components provides a means of assigning functionalized costs based on the design and functional parameters that facility serves in the system. Cost components include the annual water usage (i.e. average day demand, peak rates of demand, meters and services and customer). Below is a definition of the customer service characteristics.» Average day costs vary directly with the quantity of water sold under average day load conditions.» Extra-capacity costs represent those costs incurred to meet water demands that exceed average levels of water usage by customers. These costs are incurred to the water usage variations and peak demands imposed on a water system. Extra capacity costs are incurred to meet the capacity above the maximum day and maximum hour demands.» Meter and services costs vary based on the size of meter and include meter repair and maintenance and a portion of capital costs associated with meeting the demands of the customer.» Billing and collection costs include the cost of billing, customer service, and customer accounting. Functional O&M costs are generally allocated to the cost components that best reflect the design or functional parameter associated with that facility s expense. For example, water supply canal costs are allocated to the base or average day costs as source of supply facilities are designed to meet average day demands. Booster pumps and irrigation pumps are designed to meet maximum hour demands. These costs are allocated to the average day, maximum day and maximum hour cost components. Similarly, transmission and distribution mains are designed to meet maximum hour demand. These costs are allocated to the average day, maximum day, and maximum hour cost components. Meter repair is associated with repair and replacement of customer meters. These costs are allocated directly to the meters and services cost component. 14 Salt Lake City Department of Public Utilities
25 Water system assets provide a reasonable basis for allocating annual capital costs. The treatment plants are designed to meet the peak demands on the system. These costs are allocated to the average day and maximum day cost component. Pumping facilities are designed to meet maximum hour demands. These costs are allocated to the average day, maximum day, and maximum hour demands. Other costs not specifically allocated are allocated in proportion to all other assets Allocated Revenue Requirement Table 3.3 summarizes the allocated revenue requirement from the analysis discussed in section and The allocated revenue requirement is distributed to customer classes based on their proportionate share of total customer service characteristics. Description Table 3.3: Water FY19 Allocated Revenue Requirement Average Day Max Day Extra Capacity Max Hour Extra Capacity Equivalent Meters Operating $37,880,768 $9,869,924 $3,118,953 $4,318,322 $7,700,910 $62,888,877 Debt service 391, , ,767 44, ,117,000 Capital 14,080,815 16,103,326 8,410,347 1,592, ,186,900 Less: Adjustments (10,086,371) (11,202,573) (5,849,298) (1,197,952) (2,567,237) (30,903,431) Revenue requirement $42,266,590 $15,218,271 $5,913,768 $4,757,044 $5,133,673 $73,289,346 Bills Total Customers of a water utility are often identified according to customer class. Each customer class has unique water demands and usage characteristics. Because cost-of-service is based on the concept of proportionality, customer service characteristics for each customer class must be analyzed to distribute the functionalized and allocated system revenue requirements based on their respective demand profiles. Table 3.4 details the units of service. Water, Sewer and Stormwater Rate Study Report 15
26 Table 3.4: Water FY19 Proposed Raftelis Customer Class Units of Service Average Day ccf per year Max Day Extra Capacity ccf per day Max Hour Extra Capacity ccf per day Eq. Meter ¾ Equivalent Meters. Billing # of bills Customer Class City Residential 8,385,282 36,414 43,759 52, ,352 CII 14,056,634 53,945 70,871 20,252 93,708 Irrigation 2,263,834 13,188 12,989 4,599 18,816 Fire protection , Total City units of service 24,705, , ,304 77, ,876 County Residential 5,235,087 24,704 28,009 26, ,656 CII 2,474,411 8,947 12,283 3,635 11,472 Irrigation 452,350 2,808 2, ,612 Fire protection Total County units of service 8,161,849 36,506 43,183 30, ,740 Total units of service 32,867, , , , ,616 The unit cost of service is the quotient of the allocated revenue requirement by cost component divided by the units of service for each. Table 3.5 summarizes this calculation. 16 Salt Lake City Department of Public Utilities
27 Table 3.5: Water FY19 Proposed Raftelis Unit Cost of Service Line No 1 Description Allocated revenue requirement Average Day Max Day Extra Capacity Max Hour Extra Capacity Equivalent Meters Billing $42,266,590 $15,218,271 $5,913,768 $4,757,044 $5,133,673 Units of service ccf ccf/day ccf/day Eq. Meters Bills 2 City 24,705, , ,304 77, ,876 3 County (1) 11,018,496 49,283 58,298 41, ,099 4 Total units of service 35,724, , , ,483 1,080,975 Unit cost of service 5 City (Line 1 / Line 4) $ $ $ $ $ County (Line 5 x 1.35) (1) County units of service have been adjusted by a multiple of 1.35 times to account for the differential between City and County rates. Table 3.6 shows the distributed cost-of-service to customer classes. The customer class units of service in Table 3.4 are multiplied by the unit cost of service in Table 3.5 based on the service area. Table 3.6: Water FY19 Proposed Raftelis Distribution of Cost of Service to Customer Classes Average Day Max Day Extra Capacity Max Hour Extra Capacity Equivalent Meter Total Cost of Service Customer Class Billing City Residential $9,920,917 $3,618,036 $1,379,418 $2,104,874 $2,760,906 $19,784,151 CII 16,630,890 5,359,789 2,234, , ,030 25,476,089 Irrigation 2,678,420 1,310, , ,116 89,359 4,670,660 Fire protection 0 33,487 53, ,609 Total City COS $29,230,226 $10,321,628 $4,076,052 $3,094,306 $3,295,296 $50,017,509 County Single residence $8,361,647 $3,313,597 $1,191,954 $1,427,697 $1,741,669 $16,036,564 CII 3,952,208 1,200, , ,357 73,550 5,943,895 Irrigation 722, , ,029 39,684 23,158 1,275,067 Fire protection 0 6,307 10, ,311 Total County COS $13,036,363 $4,896,643 $1,837,716 $1,662,738 $1,838,377 $23,271,837 Total COS $42,266,590 $15,218,271 $5,913,768 $4,757,044 $5,133,673 $73,289,346 Water, Sewer and Stormwater Rate Study Report 17
28 The comparison of cost of service to revenue at FY19 Utility Presented rates in Table 3.7 shows the change in cost to provide service to each customer class. Table 3.7: Water Comparison of FY19 Proposed Raftelis Cost of Service to Revenue at FY19 Utility Presented Rates Class FY19 Utility Presented FY19 Proposed Raftelis Change $ Change % City Residential $20,563,680 $19,784,151 ($779,529) (3.8%) CII 23,846,532 25,476,089 1,629, % Irrigation 4,987,423 4,670,660 (316,763) (6.4%) Fire protection 84,391 86,609 2, % Total City COS $49,482,026 $50,017,509 $535, % County Residential $16,802,108 $16,036,564 ($765,544) (4.6%) CII 5,692,020 5,943, , % Irrigation 1,299,796 1,275,067 (24,729) (1.9%) Fire protection 13,396 16,311 2, % Total County COS $23,807,320 $23,271,837 ($535,483) (2.2%) Total COS $73,289,346 $73,289, % The Department serves customers located both within and outside the City limits City and County customers, respectively. The risks of owning a water system reside with the City, the water customers/taxpayers living in the City. Additionally, customers within the City pay property taxes to the Metropolitan Water District of Salt Lake and Sandy (MWDSL&S); County customers do not. The funds received by the MWDSL&S are used to develop and acquire water resources and provide treated water for both the City and County customers served by the Department. City customers approve the issuance of bonds to fund water utility capital improvements which benefit all customers, including County customers. Long before the Department and City operated the utility as a stand-alone, self-sufficient enterprise, property taxes (paid only by City customers) were used to acquire and construct water service assets. To recognize these risks and to quantify the associated costs, the City uses an industryaccepted approach to establish a differential on the County rates. 18 Salt Lake City Department of Public Utilities
29 The current 1.35-times user charge or rate differential provides a means by which City customers are compensated for the risk associated with serving County customers. Raftelis reviewed the current differential by developing a unit cost for County customers using a utility basis revenue requirement. The utility-basis is generally applicable to investor-owned utilities and public systems under the jurisdiction of state utility commissions or other regulatory bodies. It is also an appropriate method for municipal utilities that serve customers outside of their corporate limits. The utility basis revenue requirement includes operating expenses, depreciation and a return on rate base or investment for facilities used to serve County customers. The return on rate base is calculated using a utility s weighted average cost of capital multiplied by the utility s rate base or net assets. Because the City owns the system, Raftelis developed a unit cost on a cash basis. The quotient of the County to City unit costs is the differential. The primary difference between the cash and utility basis is the concept of ownership and the method of consumer protection. Under the cash-basis, consumer protection is provided by the budgeting oversight of the elected officials. These officials act as a representative of the customers and the utility. These officials are typically elected by the citizens that act as the owners of the utility. Under this approach, ownership and consumer protection are combined into one elected body. Under the utility-basis, consumer protection is often provided by state public utility or service commissions. These regulatory bodies establish financial and rate development rules and regulations and authorize rates of return that provide consumer protection. In addition, consumer protection is often provided by contractual agreements that define the basis of utility rates where municipally-owned utilities provide services to customers located outside their corporate jurisdictions. Raftelis analysis of the County s utility basis unit cost compared to the City s cash basis unit cost is consistent with the current differential of Raftelis recommends the current differential remain in place. Table 3.8 summarizes the calculation; the detailed calculation can be found in Appendix A. Water, Sewer and Stormwater Rate Study Report 19
30 Table 3.8: Water - Development of County Rate Differential Based on a FY18 Revenue Requirement Line No Item $ Units (ccf) Differential 1 Cash Basis Revenue Requirement $73,289,346 2 Less: County Utility Basis Revenue Requirement $28,664,403 11,281, Net Cash Residual Revenue Requirement $44,624,943 23,715, County Differential (Line 1 / Line 3) Introduction In the development of schedules of water rates, a basic consideration is to establish equitable charges to customers commensurate with the cost of providing service. The only method of assessing entirely equitable water rates would be the determination of each customer s bill based upon their unique service requirements. Since this is impractical, schedules of rates are normally designed to meet average conditions for groups (classes) of customers having similar service requirements. Rates should be reasonably simple in application and subject to as few misinterpretations as possible FY19 Utility Presented and FY19 Proposed Raftelis Structure and Rates The Department s existing rate structure has been place since FY10. This structure reflects a balance of many objectives identified by the 2008 Water Rate Committee. These included: conservation, revenue stability, and affordability. The FY19 Utility Presented rate structure consists of two components: 1) a fixed charge that varies by meter size and 2) increasing block volume rate structures for residential, CII, and irrigation customers. Table 3.9 shows the FY19 Utility Presented and FY19 Proposed Raftelis structures. 20 Salt Lake City Department of Public Utilities
31 Block Winter Period (Nov-Mar) Table 3.9: Water FY19 Utility Presented and Proposed Rate Structures FY19 Utility Presented Residential CII Irrigation (1) FY19 Proposed Raftelis Block 1 Rate for All Usage FY19 Utility Presented FY19 Proposed Raftelis Block 1 Rate for All Usage Summer Rate Structure (April through November) Block 1 (2) 0-10 ccf 0-10 ccf 0-AWC (3) 0-AWC Block ccf ccf AWC-300% AWC-300% FY19 Utility Presented Block 1 Rate for All Usage 0 Target Budget Target Budget 300% of Budget Block ccf ccf 300%-700% 300%-600% >300% of Block 4 >70 ccf >60 ccf >700% >600% Target Budget (1) No changes to the irrigation rate structure. (2) Single residence block 1: 0 to 10 ccf Duplex block 1: 0 to 13 ccf Triplex Block 1: 0 to 16 ccf (3) AWC = Average Winter Consumption. AWC 300% means usage greater than a customer s AWC and less than or equal to 300% of the customer s AWC. Fixed Charge The FY19 Proposed Raftelis fixed charge varies by meter size. The fixed charge recovers the following costs: meter reading/billing, customer service, and a portion of capital costs. Meter reading, billing and customer service costs do not vary by meter size. Capital costs increase as meter size increases recognizing the additional costs to serve larger capacity customers. The capital cost differential by meter size is based on the ratio of the maximum allowable flow capacity to a 3/4 meter. Table 3.10 shows the FY19 Utility Presented and FY19 Proposed Raftelis fixed charges. Water, Sewer and Stormwater Rate Study Report 21
32 Table 3.10: Water FY19 Utility Presented and FY Proposed Raftelis Fixed Charges Meter Size FY19 Utility FY19 Proposed Presented Raftelis Change - $ Change - % 3/4" $9.89 $8.84 ($1.05) (11%) % 1 ½ % 2" % 3" % 4'' % 6" % 8" % % (1) County fixed charges are 1.35 times City fixed charges. Volume Rates The proposed volume structures for residential and commercial (CII) retains the 4-block inclining structure. The irrigation volume structure retains the 3-block inclining structure. The residential rate structure is a fixed block structure while the commercial or CII class is an individualized structure. Residential rates include single residence, duplex, and triplex classes. CII includes commercial, industrial, and institutional customers. The CII structure s thresholds are based on each customer s average winter consumption (AWC). The irrigation structure retains the individualized target budget-based structure. The volume rates developed in this study are based on each class cost of service. Table 3.11 shows the FY19 Utility Presented and FY19 Proposed Raftelis rates. 22 Salt Lake City Department of Public Utilities
33 Table 3.11: Water - FY19 Utility Presented and FY19 Proposed Raftelis Single Residence Volume Rates (1,2) City Customers FY19 Utility Block Presented $ per ccf RESIDENTIAL FY19 Proposed Raftelis $ per ccf Winter (November April) Change - $ Change - % All Usage $1.35 $1.30 ($0.05) (3.7%) Summer (April October) 1 $1.35 $1.30 ($0.05) (3.7%) (0.07) (3.8%) (0.10) (3.9%) (0.11) (4.0%) COMMERCIAL Winter (November April) All Usage $1.35 $1.42 $ % Summer (April October) 1 $1.35 $1.42 $ % % % % IRRIGATION Winter (November April) All Usage $1.85 $1.71 ($0.14) (7.6%) Summer (April October) 1 $1.85 $1.71 (0.14) (7.6%) (0.19) (7.4%) (0.21) (7.7%) (1) County rates are 1.35 times City rates (2) See Table 3-9 for each class block thresholds Typical Monthly City Single Residence Bills Summer Usage Table 3.12 compares typical monthly bills under FY19 Utility Presented and the FY19 Proposed Raftelis rates at various levels of consumption. Water, Sewer and Stormwater Rate Study Report 23
34 Table 3.12: Water FY19 Typical Monthly Summer Bills - Single Residence City Customers Usage ccf FY19 Utility Presented FY19 Proposed Raftelis Change ($) Change (%) % of Summer Bills 0 $9.89 $8.84 ($1.05) (10.6%) 4.8% (1.30) (7.8%) 23.1% (1.55) (6.6%) 18.5% (2.25) (5.4%) 19.5% (2.95) (4.9%) 12.2% (3.95) (4.6%) 7.7% (4.95) (4.4%) 4.8% (5.95) (4.3%) 3.0% (5.35) (3.3%) 1.9% The Department requested a review and update of the secondary irrigation water rate for select golf courses and parks. This secondary water service is to the culinary irrigation water demands of select sites. The cost to provide this service includes an annual return on the Department s water resources cost and a water delivery cost. The secondary irrigation water rate follows the same inclining block volume rate structure as the culinary irrigation-only meter rate. Each customer is provided a monthly budget based on the following factors: permeable area, historical evapotranspiration and standard watering practices. Water use within the budget is charged at a rate comparable to Block 2 of the standard residential rate (a block established to reflect reasonable outdoor use). Water use that exceeds the budget is charged in the higher blocks. It is hoped the structure provides incentive for wise use of water. Table 3.13 on the next page shows the summary calculation. Detailed calculations are contained in the appendix. 24 Salt Lake City Department of Public Utilities
35 Table 3.13: Water - Secondary Irrigation Water Rate Calculation Annual Costs Units Unit Cost $ per AF Unit Cost $ per ccf Annual return water resource costs $5,194,331 Reliable Water Supply, Acre-Feet (AF) 115,713 Water resource unit cost, $ per AF $44.89 $ Water delivery cost $1,641,658 Projected volume, AF 14,009 Water delivery cost, $ per AF $ Total, $ per AF $ $ Rate Structure, $ per AF Block 2 $ cents Block cents Block $1.434 Water, Sewer and Stormwater Rate Study Report 25
36 SEWER RATE STUDY The Department s sewer utility is a self-supporting enterprise fund with revenues collected from rates, impact fees, and other income to meet the utility s annual operating and capital budget, maintain adequate reserves, and meet bond covenant debt service coverage requirements. For the purposes of this study, Raftelis used data provided by the Department to develop the costof-service and rate alternatives. This data included detailed historical water billing data, daily system water production data, detailed asset records, historical financial data, the projected FY19 operating and capital budget as well as numerous meetings with Department Staff. The cost-of-service process is a method to assign costs based on each customer class proportionate share of water demands and number of customers. The cost-of-service analysis consists of the following eight steps: 1. Project FY19 rate revenue at FY19 Utility Presented rates 2. Determine test year revenue requirement 3. Functionalize revenue requirement 4. Allocate functionalized costs to cost components 5. Determine system units of service 6. Determine unit cost of service 7. Determine customer class units of service 8. Distribute costs to customer classes 9. Design rates to recover class cost-of-service and total revenue requirement Raftelis developed FY19 rate revenue at FY19 Utility Presented rates using detailed billing records provided by the Department. The revenue at FY19 Utility Presented rates in Table 4.1 serves as the basis for determining the FY19 revenue requirement. This billing data analysis is also used in the units of service analysis discussed in Section Salt Lake City Department of Public Utilities
37 Table 4.1: Sewer - FY19 Revenue at FY19 Utility Presented Rates BOD Class TSS Class Accounts Billed Volume (ccf) Revenue ,001 8,447,569 $28,142, ,552 78, ,272 41, , ,065 1,196, ,202 2,327, , , , , ,110 1,522, ,231 77, , , , ,671 1,611, , ,097 34, , , ,160 7, , , , , ,781 72, , , , , , , , ,446 50, ,008 50,320 10,377,862 $37,677,666 The revenue requirement shown in Table 4.2 includes O&M, debt service and capital expenditures. These requirements are met from rate revenues, reserves and miscellaneous revenue. Water, Sewer and Stormwater Rate Study Report 27
38 Table 4.2: Sewer - FY19 Revenue Requirement Item $ Expenditures Operating expense $18,522,059 Debt service 6,058,000 Capital outlay 86,356,500 Total expenditures $110,936,559 Less: Adjustments Miscellaneous Revenue ($1,287,000) Other Sources (2,740,000) Bond Proceeds (3,985,000) Less: Change in Fund Balance (65,246,893) Total Adjustments ($73,258,893) FY19 Revenue Requirement $37,677,666 The underlying principle in cost allocation is to convert the test year revenue requirement into costs that best reflect the cost associated with the water demands place on the system Functional Cost Components Sewer systems are comprised of several facilities (unit processes or functions) that are designed and operated to collect, treat, and dispose of effluent to natural bodies of water. The separation of costs into functional components provides a means for distributing costs to customer classes based their respective responsibility in the system. Typical functional categories for water systems include pre-treatment, treatment, lift stations, trunk lines, etc Allocation of Functionalized Costs Once costs have been separated by function, they can be further allocated to cost components. Allocating to cost components provides a means of assigning costs based on the design and functional parameters that predominately influence the amount of that cost. Cost components include: contributed flow, biochemical oxygen demand (BOD), total suspended solids (TSS), and customer and billing costs 5. 5 BOD means the quantity of oxygen utilized in the biochemical oxidation of organic matter under standard laboratory procedures for five (5) days at twenty degrees centigrade (20 C). Total suspended solids means the total suspended matter that floats on the surface of or is suspended in water, wastewater or other liquids, and which is removable by laboratory filtering. Both BOD and TSS are usually expressed as a concentration in milligrams per liter (mg/l). 28 Salt Lake City Department of Public Utilities
39 Volume costs are those which vary directly with the quantity of contributed sewer volumes to the plant. BOD and TSS costs are associated the processes needed to treat and discharge effluent. O&M related to the treatment plant are allocated to their respective volume, BOD or TSS cost component. For example, lift station and collection line expenses are allocated directly to the flow cost component. Other treatment related expenses such as operations, maintenance and fleet management are allocated equally to the flow, BOD, and TSS cost components. The lab program is associated with water quality testing. These costs are allocated equally to the BOD and TSS cost components. Other expenses not specifically assigned are allocated in proportion to all other treatment expenses. The allocation of system assets to functional cost components provides the basis for allocating annual capital costs. Cost of service is generally allocated to cost components that reflect the design and functional parameters of the associated facility. For example, assets such as the trunk mains, collection mains, and interceptor mains reflect assets used to serve customers served by the collection system and are allocated directly to the flow cost component. General plant assets not specifically assigned are allocated in proportion to all other plant assets Allocated Revenue Requirement Table 4.3 summarizes the allocated revenue requirement. The allocated revenue requirement is distributed to customer classes based on their proportionate share of total customer service characteristics. Table 4.3: Sewer FY19 Allocated Revenue Requirement Description Flow BOD TSS Customer Total Operating $5,337,445 $4,812,846 $3,208,564 $5,163,204 $18,522,059 Capital 53,125,789 24,888,793 14,399, ,414,500 Less: Adjustments (41,697,389) (19,692,776) (11,390,960) (477,768) (73,258,893) Allocated revenue requirement $16,765,845 $10,008,863 $6,217,522 $4,685,436 $37,677, Units of Service Customers of a sewer utility are often identified according to customer class. Each customer class has unique flow and strength characteristics. Because cost-of-service is based on the concept of proportionality, customer service characteristics for each customer class must be analyzed to distribute the functionalized and allocated system revenue requirements based on their respective demand profiles. The number of minimum bills is based on a reduction in the minimum charge allowance. Similarly, the billable volume has been adjusted to recognize the increase in the billable flow above the reduced minimum. Table 4.4 details proposed the units of service. Water, Sewer and Stormwater Rate Study Report 29
40 BOD Class Table 4.4: Sewer FY19 Proposed Raftelis Units of Service TSS Class Billable Volume 1 ccf BOD lbs TSS lbs Minimum Bills 1 1 8,570,253 8,113,588 9,238, , ,552 21,350 49, ,272 9,725 38, , , , , , ,715 1,289, ,268 78, , , , , , , , ,276 36,561 53, ,371 2, ,464 89,674 26, ,797 1,032, , ,594 1, ,097 18,683 26, , ,426 49, ,159 5,347 2, ,858 4, ,698 2, , ,829 53, ,781 55,560 21, ,104 2, , ,610 23, , ,961 63, , ,453 98, ,446 85,509 17, ,185 2,689 0 Total 10,502,500 14,457,731 13,120, ,715 (1)Projected volume billed above the minimum allowance Unit Cost of Service The unit cost of service is the quotient of the allocated revenue requirement by cost component divided by the units of service for each. The allocated customer costs are greater than what the minimum charge will recover. As a result, those costs not recovered by the minimum charge are reallocated to the volume component. Table 4.5 summarizes the calculation of the minimum charge as well as revenue collected and Table 4.6 shows the adjusted unit cost of service. 30 Salt Lake City Department of Public Utilities
41 Table 4.5: Sewer - Calculation of Minimum Bill Revenue Line No Item $ 1 Total cost of service $37,677,666 2 Annual billable volume 10,811,644 3 Average rate, $ per ccf (Line 1/Line 2) $ Minimum use allowance, ccf (rounded) 2 5 Number of minimum bills 162,715 6 Total minimum revenue (Line 3*4*5) $1,109,849 Table 4.6: Sewer FY19 Proposed Raftelis Unit Cost of Service Line Billing/ Description Volume BOD TSS No Admin 1 Allocated revenue requirement $16,765,845 $10,305,656 $5,920,730 $4,685,435 2 Minimum Charge Adjustment 3,575, (3,575,586) 3 Reallocated Revenue Requirement $20,341,431 $10,305,656 $5,920,730 $1,109,849 Billable Flow, Units of service ccf lbs lbs Bills 4 Total units of service 10,502,500 14,457,731 13,120, ,715 5 Unit cost of service $1.94 $0.71 $0.45 $ Distribution of Costs to Customer Classes The distribution of costs to customer classes is calculated below in Table 4.7. Only a portion of the billing and administrative costs is recovered in the minimum charge. The net billing/admin costs represents the cost of providing approximately 2 ccf of water for a class one customer. The remainder of costs is allocated proportionately to the flow, BOD, and TSS cost components. The reallocated cost totals $3.6 million. Costs are distributed to the various customer classes based on the units of service in Table 4.6. Water, Sewer and Stormwater Rate Study Report 31
42 Table 4.7: Sewer FY19 Proposed Raftelis Customer Class Cost of Service BOD TSS Class Class Flow, ccf BOD TSS Bills Total 1 1 $16,599,021 $5,783,469 $4,169,093 $1,098,589 $27,650, ,678 15,218 22, , ,895 6,932 17, , , , , , ,527 1,678 1,188, ,130, , ,020 5,975 2,364, ,359 55, , , , ,947 47, , , , , ,509, ,650 26,061 24, , , , , ,383 63,920 11, , , , ,020 1,193 1,564, , , ,872 13,317 11, , , ,133 22, , ,245 3,811 1, , ,620 2,750 1, , ,210 1, , , ,466 23, , ,945 39,604 9, , ,058 2,213 1, , , ,616 10, , , ,111 28, , , ,061 44, , ,675 60,952 8, , ,111 1, ,102 Total $20,341,431 $10,305,656 $5,920,730 $1,109,849 $37,677, Comparison FY19 Proposed Raftelis Cost of Service to Revenue at FY19 Utility Presented Rates The comparison of cost of service to revenue at FY19 Utility Presented rates shows the change in cost to provide service for each customer class. Table 4.8 shows this comparison. 32 Salt Lake City Department of Public Utilities
43 Table 4.8: Sewer Comparison of FY19 Proposed Raftelis Cost of Service to Revenue at FY19 Utility Presented Rates BOD Class TSS Class FY19 Utility FY19 Proposed Presented Raftelis Change $ Change % 1 1 $28,142,688 $27,650,171 ($492,517) (1.8%) ,254 81,386 3, % ,499 44,191 2, % 1 7 1,633 1, % 2 1 1,196,323 1,188,540 (7,782) (0.7%) 2 2 2,327,806 2,364,693 36, % N/A , ,121 14, % , ,081 (12,957) (3.0%) 3 2 1,522,916 1,509,878 (13,038) (0.9%) ,424 78, % 3 4 3,291 3, % , ,245 (6,243) (4.8%) 4 2 1,611,205 1,564,282 (46,924) (2.9%) 4 3 2,732 2,714 (17) (0.6%) ,608 34, % , ,268 (16,616) (5.9%) 5 2 7,671 7,294 (377) (4.9%) 5 4 6,319 6,303 (16) (0.3%) 5 5 2,992 3, % , ,844 (23,535) (6.9%) ,088 68,303 (3,785) (5.3%) 6 4 4,618 4,534 (84) (1.8%) , , , % , , , % , , , % ,788 75,670 24, % 7 5 8,008 12,102 4, % Total $37,677,666 $37,677,666 ($0) 0.0% Introduction In the development of schedules of sewer rates, a basic consideration is to establish equitable charges to customers commensurate with the cost of providing service. The only method of assessing entirely equitable sewer rates would be the determination of each customer s bill based upon their unique service requirements. Since this is impractical, schedules of rates are normally designed to meet average conditions for groups (classes) of customers having similar service requirements. Rates should be reasonably simple in application and subject to as few Water, Sewer and Stormwater Rate Study Report 33
44 misinterpretations as possible. Appendix C shows calculation of the FY19 Proposed Raftelis sewer rates FY19 Utility Presented and FY19 Proposed Raftelis Structure and Rates The FY19 Utility Presented rate structure consists of a reduced minimum charge from the existing rate structure. The minimum bill is assessed when a customer s volume rate times average winter consumption is less than $ Otherwise all flow is assessed a volume rate that varies by class based on the flow, BOD and TSS strength characteristics. Raftelis also calculated extra strength charges for Class 7 customers. Extra strength charges include BOD, COD 6, and TSS. The charges for COD, BOD and TSS will be billed on actual pounds of discharge. Customers in this class are assessed BOD or COD charges but not both. When there is an unexplained difference between the two (2) test results of COD and BOD the higher of the two will be used. Tables 4.9 and 4.10 show the FY19 Utility Presented and FY19 Proposed Raftelis rates, respectively. Table 4.9: Sewer - FY19 Utility Presented Rates (1) Class BOD Strength TSS Strength Flow BOD TSS Total mg/l mg/l $ per ccf $ per ccf $ per ccf $ per ccf $1.87 $0.78 $0.40 $ , , ,200 1,500 1,200 1, ,500 1,800 1,500 1, >1,800 >1,800 Special Rate by Customer Extra Strength Rates, $ per lb Chemical oxygen demand (COD) $0.221 Biochemical oxygen demand (BOD) Total suspended solids (TSS) (1) Customers billed based on the average water usage for the months November through March (AWC) or a minimum charge is $11.93, whichever is greater. 6 COD means a measure of the oxygen required to oxidize all compounds, both organic and inorganic, in water. The exists a relationship between BOD and COD which is stated as ratio of BOD/COD. According to Wastewater Engineering, Treatment and Reuse by Metcalf and Eddy, typical ratios found in untreated municipal wastewater ranges from 0.3 to 0.8. The City currently uses a ratio of 0.5 and Raftelis has retained that ratio for the proposed extra strength rates. 34 Salt Lake City Department of Public Utilities
45 Table 4.10: Sewer FY19 Proposed Raftelis Rates (1) Class BOD Strength TSS Strength Flow BOD TSS Total mg/l mg/l $ per ccf $ per ccf $ per ccf $ per ccf $1.94 $0.68 $0.49 $ , , ,200 1,500 1,200 1, ,500 1,800 1,500 1, >1,800 >1,800 Special Rate by Customer Extra Strength Rates, $ per lb Chemical oxygen demand (COD) $0.280 $0.356 Biochemical oxygen demand (BOD) Total suspended solids (TSS) (1) Customers in classes 1 through 6 are billed monthly based on their average winter consumption (AWC) times the sum of the rates for flow, BOD, and TSS or a minimum charge of $6.82 whichever is greater. AWC is the average of water usage for the months November through March Typical Monthly Bill Comparison Table 4-11 compares typical monthly bills under FY19 Utility Presented and the FY19 Proposed Raftelis rates at various levels of AWC for a class 1 BOD and TSS customer. AWC Table 4.11: Sewer - Typical Monthly Bill Comparison FY19 Utility Presented FY19 Proposed Raftelis Change ($) Change (%) 0 $11.93 $6.82 ($5.11) (42.8%) (5.11) (42.8%) (5.11) (42.8%) (2.60) (21.8%) % % % % % % % Water, Sewer and Stormwater Rate Study Report 35
46 STORMWATER RATES The Department s stormwater utility is a self-supporting enterprise fund with revenues collected from rates, impact fees, and other income to meet the utility s annual operating and capital budget, maintain adequate reserves, and meet bond covenant debt service coverage requirements. For the purposes of this study, Raftelis used data provided by the Department to develop this revenue requirement study. This data included detailed historical billing data, impervious data, and the projected FY19 operating and capital budget. Raftelis developed FY19 rate revenue at FY19 Utility Presented rates using detailed billing records provided by the Department. The revenue under FY19 Utility Presented rates serves as the basis for determining the FY19 revenue requirement. Table 5.1 summarizes the FY19 revenue under FY19 Utility Presented rates. Table 5.1: Stormwater FY19 Revenue at FY19 Utility Presented Rates Customer Class ERUs ERU Factor FY19 Utility Presented Rates Monthly Revenue Annual Revenue 1 or 2 Units <.25 acres 36, $4.94 $178,120 $2,137,441 1 or 2 Units >.25 4, , ,624 3 or 4 Units , ,801 All Other Developed Parcels 95, ,261 6,255,134 Total 137, ,917 $8,855,000 The revenue requirement shown in Table 5.2 includes O&M, debt service and capital expenditures. These requirements are met from rate revenues, reserves and miscellaneous revenue. 36 Salt Lake City Department of Public Utilities
47 Table 5.2: Stormwater - FY19 Revenue Requirement Item $ Expenditures Operating expense $6,913,232 Debt service 1,014,000 Capital outlay 5,649,068 Total expenditures $13,576,300 Less: Adjustments Grants/Impact fees ($850,000) Other Revenues (34,000) Short-term financing (1,345,000) Change in Fund Balance (2,492,300) Total adjustments ($4,721,300) FY19 revenue requirement $8,855, Introduction In the development of schedules of stormwater rates, a basic consideration is to establish equitable charges to customers commensurate with the cost of providing service. The only method of assessing entirely equitable stormwater rates would be the determination of each customer s bill based upon their unique service requirements. Since this is impractical, schedules of rates are normally designed to meet average conditions for groups (classes) of customers having similar service requirements. Rates should be reasonably simple in application and subject to as few misinterpretations as possible FY19 Utility Presented and FY19 Proposed Raftelis Rates The Department s FY19 Utility Presented rates has been place since FY17 and are show in Table 5.3. The FY19 Utility Presented rate structure includes a monthly charge per equivalent residential unit (ERU). The FY19 Proposed Raftelis rates retain the existing structure but have been updated to recover the cost to provide services in FY19. Water, Sewer and Stormwater Rate Study Report 37
48 Table 5.3: Stormwater FY19 Comparison of FY19 Utility Presented and FY19 Proposed Raftelis Rates Customer Class FY19 Utility Presented FY19 Change $ Change % 1 or 2 Units <.25 acres $4.94 $4.94 $ % 1 or 2 Units > % 3 or 4 Units % Impervious Area Based % 38 Salt Lake City Department of Public Utilities
49 MISCELLANEOUS FEES The Department assesses fees for various goods and services associated with providing water, sewer, and stormwater service. These goods and services directly benefit the customer requesting the service. As such, these costs are passed directly to the customer as a direct charge. The miscellaneous fees study evaluated over 60 existing fees and developed a number of new fees. These fees are based on a cost of analysis considering, time, labor, material, and overhead. Fines on the other hand, are set at levels to deter customers from engaging in actions that impact the utility. Many of these fees have not been updated for a number of years and therefore will show a significant potential increase. The calculated fees shown in this report represent the maximum costbased fee. The Department may choose to adopt a fee up to that amount and still maintain the cost basis. It has been the intent of the City and the City Council to have all fees based on a cost of service basis and listed in the City s Consolidated Fee Schedule (CFS). During the review, Raftelis recommended some fees on the Salt Lake City CFS be removed and that some existing fees. This was to simplify steps in the permitting and inspection process. Most fees have been rounded to end in five or even dollars to simplify the collection process at the Department s request. Raftelis evaluated the following fees 7 :» Water connection fees» Meter inspection and testing» Fire hydrant maintenance fees» Flat water charge City and County Agencies» Pressure testing» Disconnection» Plan review fees» Sewer inspections» Industrial wastewater discharge permits» Stormwater inspection fees/discharge permits Raftelis reviewed over 60 different fees listed in the current City Consolidated Fee Schedule and reviewed 16 additional new fees requested by the Department. Raftelis used the City s current work order system to pull actual cost information over a two or three-year basis. Work order information was the primary resource for evaluating fees. Raftelis held interviews with individual work groups to list each task involved in each fee process in instances where work order information was 7 The term existing service fee refers to the adopted FY18 fees shown in the Consolidated Fee Schedule. Water, Sewer and Stormwater Rate Study Report 39
50 unavailable. Through discussions with staff, Raftelis developed cost estimates for each step in the task, level of effort required, and the grade level of each employee included in the process. The Water Utility serves both Salt Lake City and a large portion of Salt Lake County s east side. Listed below are the current and proposed water miscellaneous fees Connection Fees Connection fees, shown in Table 6.1, consistently collect the most revenue on an annual basis compared to all the other miscellaneous fees. These fees are charged before the water meter is connected to the system and include the cost of the meter and the installation cost when the City does the installation. These fees are added to the impact fee by meter size on the City s CFS. Table 6.1 shows the water connection fees. Table 6.1: Water Connection Fees Meter Size Existing Calculated inches Service Fee Service Fee Change $ Change % ¾ $602 $500 ($102) -16.9% (66) -10.7% 1.5 1,008 2,395 1, % 2 2,323 2, % 3 3,983 5,985 2, % 4 4,414 8,225 3, % 6 7,239 13,345 6, % 8 10,478 17,280 6, % 10 N/A 22,380 22, % 8 Detector Check 2,014 2, % 10 Detector Check 3,076 4,380 1, % 4 FM 5,863 8,870 3, % 6 FM 9,309 12,000 2, % 8 FM 11,084 13,255 2, % 10 FM 24,225 20,155 (4,070) -16.8% Other Miscellaneous Fees Other fees are charged when customers request new fire hydrants, meter testing, relocating meters or requesting to have their water turned back on. These fees recover the costs of sending employees to inspect new fire hydrants and conduct meter testing when customers are questioning the water usage on their meters. The customers are not billed if the meter is found to be reading in error. The turn on fee is to turn the water back on after it has been turned off for non-payment. Table 6.2 shows the water utility metering fees. 40 Salt Lake City Department of Public Utilities
51 Table 6.2: Water Utility Metering Fees Fee Type Existing Calculated Service Fee Service Fee Change $ Change % New Fire Hydrant Inspect $110 $135 $ % New Fire Hydrant Inspect - Long % Relocating Meter.75 and % Meter Testing Fees 5/8 to % Meter Testing Fees 1 ½ to % Meter Testing Fees >2 Actual Cost Water Turn On Fee % Charges to City and County Fire Departments The City currently charges each Fire Department within their service area for fire hydrant maintenance. The County charges originated from a lawsuit in the 1970 s between the County and the City. The courts held that the County Fire Department was responsible for the cost to maintain fire hydrants located within the county service area. Prior to that date, the City had for many years charged the City Fire Department for maintenance and water usage. The fee paid by the Salt Lake City Fire Department for fire hydrant maintenance has not changed for 45 years and is currently $108,000 annually. The amount paid by each County Fire Department has been set by separate contracts which require the amount they pay to the match that paid by the Salt Lake City Fire Department. In addition, the Salt Lake City Fire Departments pays an estimated fee for water used for fighting fires. The fee is based on an estimated number of fires per year of 13,000 times the estimated number of gallons used per fire of 3,000 gallons. The gallons per fire is based on the average fire lasting 10 minutes with the average water usage of 300 gallons per minute. The current fee has not changed in 45 years and is still based on the 1970 price of per $0.35 ccf. The proposed fee adjusts the charge to the current rate of $1.30 per ccf. Tables 6.3 and 6.4 compare the existing and proposed fire-related fees. Fee Type Table 6.3: Fire Hydrant Maintenance Fees Existing Service Fee Calculated Service Fee Change - $ Change - % Salt Lake City cost per hydrant 6,353 hydrants $24.31 $53.65 $ % Cottonwood Heights 1102 hydrants % Holladay City 737 hydrants % Salt Lake County 1,319 hydrants % Water, Sewer and Stormwater Rate Study Report 41
52 Table 6.4: Flat Water Charge to City and County Agencies Fee Type Existing Calculated Change - Change - $ Service Fee Service Fee % Salt Lake City Fire Department $18, $67,780 $49, % County Fire Departments ,000 25,000 New Salt Lake City Street Cleaning 3,334 10,075 6, % Proposed New Fees Department staff requested Raftelis review and develop new fees for specific services. The fees listed below recover the costs for killing a service which is no longer needed by a developer or homeowner, review water pressure for new development, inspecting automatic fire sprinklers and costs to review plans before construction of water, sewer and storm water facilities. Table 6.5 on the next page shows the new proposed water utility fees. Fee Type Table 6.5: Proposed Water Utility Fees Existing Service Fee Calculated Service Fee Change $ Change % Water Pressure Test (Flow Test) water mains less than 12 N/A $455 $455 New Water Pressure Test (Flow Test) water mains greater 12 N/A New Kills Small meters N/A New Kills Large 3 and greater N/A New Auto sprinklers less than 2 N/A New Auto sprinklers 2 and larger N/A New Plan Review Fee less than 1 acre with no new water, sewer or storm water N/A New lines Plan Review Fee Tenant Remodel N/A New Plan Review Fee Greater than 1 acre but less than 5 acres with new water, sewer or storm water lines Plus all N/A 1,060 1,060 New County connection without water lines Plan Review Fee Greater than 5 acres with new water, sewer or storm water lines N/A $2,124 $2,124 New The sewer utility provides sanitary sewer services to over 45,000 customers within the Salt Lake City. The miscellaneous fees recover costs to inspect and survey new connections to the sewer system. The following fees are based on actual costs to provide these services. 42 Salt Lake City Department of Public Utilities
53 6.4.1 Sewer Miscellaneous Fees Table 6.6 summarizes the sewer miscellaneous fees. Table 6.6: Sewer Miscellaneous Fees Fee Type Existing Calculated Change Change $ Service Fee Service Fee % Sewer Inspection Fee $60 $165 $ % Sewer Lateral Kills N/A New Fee Sewer Lateral Repairs % Sewer Survey % Additional Sewer Survey % Installation of Sewer Wyes Actual Cost 109 After hours Sewer Inspection Fee % Sewer Lateral Kills N/A New Fee Sewer Lateral Repairs % Weekend & Callout Sewer Inspection Fee % Sewer Pretreatment Fees Sewer pretreatment fees are needed to cover the additional costs of monitoring and inspecting commercial and industrial users that could discharge potentially toxic or hazardous pollutants, high strength chemicals and other substances into the sanitary sewer system. The pretreatment program was established to protect the environment, publicly owned treatment works (POTW) infrastructure and personnel, and the community from adverse effects of commercial and industrial wastewater discharge. The Pretreatment program requires and works to help industrial and commercial users control and treat wastewater discharge to prevent the introduction of pollutants which will interfere with operation of the POTW or pass-though the treatment works into the environment. The following chart shows current fees charged, current costs of each fee and the new proposed fee. During the review process, the Department decided not to propose the full cost of service but rather match the current rates charged by other sewer agencies in the valley with the intent of increasing fees in small increments over time. Table 6.7 shows the sewer utility pretreatment fees. Water, Sewer and Stormwater Rate Study Report 43
54 Name of Fee Table 6.7: Sewer Pretreatment Fees Existing Service Fee Cost of Service Calculated Fee Change $ Change % Industrial Wastewater Discharge Permit Existing Customer Renewal $50 $1,990 $250 $ % New Customer 100 2, % Wastewater Sample Fee does not include lab costs (actual laboratory costs will be % charged) Grease Interceptor Inspection Fee (FOG) - First Trip New Grease Interceptor Inspection Fee (FOG) each additional trip New Notice of Violation Fee does not include applicable fines New Significant Noncompliance Fee does not include applicable fines New The stormwater utility provides services to over 44,000 Salt Lake City customers. They are required to maintain the drainage system and monitor water quality discharged into the Jordan River and other irrigation systems. The following fees recover the costs to provide additional services of inspection and review of storm water discharge during construction to protect local streams and rivers. Table 6.8 shows the stormwater utility s miscellaneous fees. Fee Type Table 6.8: Stormwater Miscellaneous Fees Existing Service Fee Calculated Service Fee Change $ Change % Storm Water Inspection Fee N/A $ New Discharge into City Storm Water System Includes 3 site visits % Discharge into Stormwater System Reinspection Fee % Discharge into City Stormwater Registration Fee % 44 Salt Lake City Department of Public Utilities
55 APPENDIX A: RATE ADVISORY COMMITTEE FINAL REPORT
56
57 Salt Lake City Department of Public Utilities Rate Advisory Committee 2018 Water and Sewer Rate Study Recommendations
58 Table of Contents 1.0 Executive Summary Introduction Committee Mission and Purpose RAC Committee Meetings Pricing Objectives Rate Structure Alternatives Selected Rate Structure Alternatives Comparison of Existing Structure and Rates to Alternatives Customer Bill Impacts Appendix A Water Rate Committee Members Appendix B RAC Feedback and Comments on Final Rate Structures Appendix C Available online: Rate Advisory Committee Meeting #1 Rate Advisory Committee Meeting #2 Rate Advisory Committee Meeting #3 Rate Advisory Committee Meeting #4 1 Rate Advisory Committee Meeting #5 1 The RAC meeting #4 presentation was divided into two separate meetings one discussing water rate alternatives and another discussing sewer rate structure alternatives. Water Rate Committee 2018 Rate Study Page i
59 1.0 Executive Summary Salt Lake City Department of Public Utilities (SLCDPU) formed a Rate Advisory Committee (the RAC or Committee) to review, consider alternatives and, as decided by the RAC, recommend changes to the City s water and sewer rate structures. The RAC participated in six meetings 2 over the period from August through December The RAC process included education on the water and sewer systems, review of existing rate structures, customer class usage characteristics, a pricing objectives exercise, the evaluation of numerous alternatives and recommendation of rate structure changes for consideration by the Salt Lake City Public Utilities Advisory Committee (PUAC). Appendix A contains the listing of the RAC members. Appendix B contains feedback and comments on the proposed rate structures from the RAC. The pricing objectives exercise provided a means in which RAC members identified and ranked the important objectives or goals that could be achieved through the water and sewer rate structures. The RAC identified the following six objectives (presented in rank order of importance) to evaluate the existing and new rate structure alternatives. Conservation Essential use affordability Demand management Rate stability Interclass equity Intraclass equity To meet these objectives, the Committee recommended two water and two sewer volumetric rate structure alternatives for consideration by the PUAC; these structures include the following: Water Rate Structure Retain the fixed charge by meter size. Modify the price ratio between the meter sizes to reflect capacity potential of each meter size to a ¾ meter. This fixed charge modification is recommended regardless of which volumetric rate alternative is selected. Retain the uniform volume rate structure for the winter months (November through March) and an increasing block structure for summer months (April through October). RAC members discussed the merits of modifying the winter uniform rate but ultimately decided that adjusting the summer structure would best meet the pricing goals and objectives. 2 The RAC meeting #4 presentation was divided into two separate meetings one discussing water rate alternatives and another discussing sewer rate structure alternatives. Rate Advisory Committee 1
60 Move from volume rates by block that are the same for all classes (system-wide cost-of-service rate) to cost-of-service (COS) based rates that vary by customer class applicable to both volumetric rate alternatives. Reduce the block 4 threshold from 70 ccf to 60 ccf for single residence, duplex, and triplex customer classes. Reduce the commercial, institutional, industrial(cii) customer class block 4 threshold from 700% of AWC to 600% of AWC. This shift is to further encourage demand management and the wise or efficient use of water. For the irrigation customer class, the current volumetric rate structure, an individualized target or budget-based approach, should be retained. The RAC recommended two water volumetric rate structure alternatives using a class-based cost-of-service rate for consideration to the PUAC. Table 1 compares the existing rate structure and the alternative rate structures. Many alternatives were considered by the RAC. For purposes of this report, the original names of the alternatives have been retained. o Alternative #2: COS/Existing Structure Adjusted for COS. Retain the fixedblock rate structure for all residential customers and the average winter consumption (AWC)-based rate structure for CII customers. Reduce the block 4 threshold from 70 ccf to 60 ccf for the single residence, duplex, and triplex customer classes. Reduce the CII block 4 threshold from 700% of AWC to 600% of AWC. o Alternative #3: COS/AWC All Modify the existing fixed-tier structure for single residence, duplex, and triplex to an AWC-based 4 block rate structure, the same structure as CII. Set the single residence, duplex, and triplex customer class block 4 threshold at 600% of AWC. Reduce the CII customer class block 4 threshold from 700% of AWC to 600% of AWC. Description Table 1 Water Current and Proposed Residential and CII Rate Structures City and County Customers Current Residential Alternative 2 COS/Existing Alternative 3 COS/AWC ALL Current CII Alternative 2 and Alternative 3 c Winter Period (Nov-Mar) Block 1 Usage for All Block 1 Usage for All Summer Period (Apr-Oct) Block 1 (a) 0-10 ccf 0-10 ccf 0-AWC 0-AWC 0-AWC Block ccf ccf AWC-300% AWC-300% AWC-300% Block ccf ccf 300%-600% 300%-700% 300%-600% Block 4 >70 ccf >60 ccf >600% >700% >600% (a) Single residence existing Block 1: 0 to 10 ccf Duplex existing block 1: 0 to 13 ccf Triplex Block 1: 0 to 16 ccf 2018 SLCDPU Rate Advisory Committee 2
61 (b) AWC = Average Winter Consumption. AWC 300% means usage greater than a customer s AWC and less than or equal to 300% of the customers AWC. (c) Alternative 2 and Alternative 3 CII rate structures are the same. Sewer Rate Structure Retain the customer class volumetric rate structure by volume and strength of wastewater flow for each alternative. Strength categories include biochemical oxygen demand (BOD) and total suspended solids (TSS). The two alternatives recommended are: o Alternative #1: No Minimum Charge. Eliminate the minimum charge. Customers are only charged for their AWC monthly flow. o Alternative #3: Reduced Minimum Charge. Reduce the minimum charge allowance from 4 hundred cubic feet (ccf) to 2 ccf. This reduces the minimum charge by approximately 50% SLCDPU Rate Advisory Committee 3
62 2.0 Introduction The SLCDPU conducts a comprehensive water rate study every five to seven years. The City retained Raftelis Financial Consultants, Inc. (Raftelis) as the consultant of record for the 2018 Water and Sewer Rate Study. The rate study included a review of water and sewer revenue requirements, the development of a cost of service analysis, and rate design for the fiscal year (FY) 2019 (the 12 months ending June 30, 2019; referred to as FY19). The rates shown in this report and appendices are not the adopted FY18 or proposed/recommended FY19 rates. Rather, these rates were developed using the current fiscal year budget and can only be used as a means of comparison of different rate structure alternatives. Adopted rates under the alternative structures proposed; ultimately adopted by the City Council, may yield different results. The rate study process included formation of a Rate Advisory Committee (RAC). This committee was comprised of stakeholders representing several diverse community groups and the public at-large. Additionally, several committee members that represented each City Council district were selected by the City Council. All of the RAC members are listed in Appendix A. The RAC participated in a series of meetings, providing input and suggestions for adjustments to the existing rate structure that best represented the needs, goals and objectives of the community. This RAC members participated in robust discussions during each meeting where they voiced concerns, agreement, and shared new ideas. Raftelis led the detailed analysis for the study. The meetings were co-facilitated by Raftelis and The Langdon Group. 3.0 Rate Advisory Committee Mission and Purpose The RAC s Mission and Purpose is stated below. Committee Mission. The mission of the RAC is to assemble a diversity of perspectives that represent our community to evaluate and advise on the water, sewer, and stormwater rate structures 3. Committee Purpose. Salt Lake City periodically updates water, sewer and stormwater utility rates to ensure they are current and reflect community values. Salt Lake City believes strongly that our community should have a voice in decisions that affect them. The Salt Lake City Department of Public Utilities Rate Advisory Committee has the unique opportunity to help develop this rate study, leading to improvements that will have a positive impact on the community for decades to come. The RAC has two overarching purposes: 1. To provide input including recommendations to the Public Utilities Advisory Committee, Salt Lake City Mayor and Council 2. To represent and communicate the views of the community 3 Ultimately, water and sewer rate structures became the RAC s primary focus. Stormwater rate structure were removed from the discussion SLCDPU Rate Advisory Committee 4
63 4.0 Rate Advisory Committee Meetings Raftelis and SLCDPU Staff facilitated six RAC meetings. The agenda and goals from each meeting are listed below. Additional information from each meeting is available on the City s web site. 4.1 Meeting #1 Role of RAC in rate study process Water and sewer system review Review of current water and sewer rates and structure Overview of the rate-setting process Pricing objectives definition 4.2 Meeting # pricing objectives review and supporting analytics Ranking 2018 pricing objectives 4.3 Meeting #3 Review ranked pricing objectives and measurement criteria for evaluation Water conservation program presentation Customer class usage and demographic characteristics Potential rate structure ideas and concepts 4.4 Meeting #4 4 Water rate structure alternatives definitions Sewer rate structure alternatives definitions Ranking top two rate structure alternatives for water and sewer 4.5 Meeting #5 Top two water and sewer rate alternatives presented Customer bill impacts for each alternative Selection of alternatives to be presented to PUAC 4 The RAC meeting #4 presentation was divided into two separate meetings one discussing water rate alternatives and another discussing sewer rate structure alternatives SLCDPU Rate Advisory Committee 5
64 5.0 Pricing Objectives The role of the RAC for the 2018 water and sewer rate study was to review the effectiveness of the existing rate structure and provide recommendations for adjustments to the structure. The Committee identified and ranked 11 pricing objectives to assist in aligning the water and sewer rate structures with community values. The pricing objectives, ranked by most important, more important and not as important, are listed in Table 1: Table 1 Ranked Pricing Objectives Most Important Conservation Essential use affordability Demand management More Important Rate stability Interclass equity Intraclass equity Not as Important Revenue stability Impact on customers Customer understanding Ease of implementation Intergenerational equity 1. Definitions can be found in RAC Meeting #2 presentation. The six highest ranked pricing objectives is discussed below. 1. Conservation/Demand management. These two related objectives focus on annual water use reduction and reduction in peak day summer use, respectively. Annual water use relates to availability, management and cost of water resources based upon precipitation, reservoir and snowpack storage. Peak water use drives capacity, size and cost of treatment plants, pumps stations and pipe to convey the maximum flow to customers during peak hour and peak day consumption of the year. Water conservation and peak usage reduction objectives were combined for the purpose of assessing impacts of changes to the rate structure on water use. To be effective with regards to these objectives, the rate structure should be designed to promote the efficient use of resources on a year-round basis as well as during periods of peak use. The rate structure should assign the cost of providing peaking facilities to those customers having significant peak to average water use patterns, and discourage the use of water during peak demand periods. 2. Essential use affordability. This objective was to allow the opportunity for low income or fixed income customers to afford water for essential purposes at the lowest possible cost. 3. Demand management. See item # SLCDPU Rate Advisory Committee 6
65 4. Rate stability. The rate structure should maintain continuity over time while meeting the goals and objectives of the utility. This is coupled with a financial plan that maintains smooth and predictable revenue adjustments. 5. Interclass equity. Equity between customer classes. Through a cost-of-service analysis, costs are recovered proportionately from each customer class rate structure based on their unique demand characteristics. 6. Intraclass equity. Equity between customers within a class. Intraclass equity is maximized when the rate structure results in individual customers paying, to the maximum extent possible, an amount that approximates their unique contribution to their customer class revenue requirement The RAC sought to evaluate rate structure refinements and adjustments in terms of how effective these adjustments were in achieving the objectives. The RAC was presented with customer characteristic and water use data, information on water system demands, sewer system flows, affordability metrics, and other customer billing data to consider in assessing the rate structure options. 5.1 Pricing Objective Measurement Criteria SCLDPU staff developed and shared with the RAC criteria used to evaluate the effectiveness each alternative s ability to meet the criteria. The measurement criteria are presented below. 1. Conservation a. Continue to achieve or exceed existing goals and evaluate more stringent goals b. To what degree does the rate structure reduce water demand, i.e., price elasticity. 2. Essential use affordability a. After considering existing program/options, how can rates be used to make essential water use affordable? 3. Demand management a. Manage peak demands to improve system efficiencies and economies of scale b. To what degree does the rate structure reduce water demand, i.e., price elasticity. 4. Rate stability a. Rate structure alternatives that are flexible and can be adjusted to achieve the financial objectives of the utility as well as the pricing objectives of the community. 5. Interclass equity a. Through the cost-of-service analysis, compare the class cost-of-service for 2018 to the revenue under existing rates. 6. Intraclass equity a. Use the cost-of-service analysis to compare the relationship between the customer bill and their demand for service SLCDPU Rate Advisory Committee 7
66 6.0 Rate Structure Alternatives Three water rate structure alternatives were developed along with comparison against the existing water rate structure. Two alternatives were created along with comparison against the existing sewer utility. The RAC added a third sewer alternative at the final meeting. These alternatives are described below. 6.1 Water Rate Structure Alternatives Status Quo: Existing Structure Adjusted for Cost of Service. Calculate rates under current system-wide cost-of-service (COS) methodology and rate structures. Alternative #1: AWC All. Calculate rates based on one rate structure for all classes, i.e., a system-wide COS and one set of rates/one rate structure for all classes. Alternative #2: COS/Existing Structure Adjusted for Cost of Service. Calculate each customer class COS rates with existing rate structures (i.e., rates and structure vary by class). Alternative #3: COS/AWC All. Calculate each customer class COS rates using an AWC rate structure that is the same for all classes (i.e., rates vary by class/structure same for all classes). 6.2 Sewer Rate Structure Alternatives Status Quo: Existing Structure Adjusted for Cost of Service. Calculate rates under current COS methodology and rate structures. Alternative #1: No Minimum Charge. Only a volume rate applied to average winter consumption for all customers. No AWC = no bill. Alternative #2: Fixed Charge. Calculate rates based on a service charge by water meter size and a volume rate based on each customers AWC. Alternative #3: Status Quo with a reduced minimum charge. Calculate rates under current COS methodology and rate structures however, reduce the minimum charge by approximately 50% SLCDPU Rate Advisory Committee 8
67 7.0 Selected Rate Structure Alternatives Raftelis presented the water and sewer rate structure alternatives concepts at RAC Meeting #4. During RAC Meeting #5, Raftelis presented conceptual rates, bill impacts, and other information for the RAC s consideration and recommendation to the the PUAC. Using a strawman poll, the attending RAC members selected the following alternatives for water and sewer: 7.1 Selected Water Rate Structure Alternatives Water Minimum Charge The RAC retained the existing minimum charge by meter size with one adjustment; the cost ratio between the meter sizes should be based on the American Water Works Association (AWWA) meter capacity ratios. This ensures that a portion of recurring capital costs is equitably distributed to meter sizes based on their meter size capacity potential. In other words, the larger the meter size, the greater the portion of capital costs that should be allocated to reflect the greater demands that can be placed on the system. This change recovers the same percentage of total rate revenue as the existing minimum charge structure: approximately 15%. This indicates that the change in the minimum charge structure will not adversely affect revenue stability. Water Volume Rate Structure The RAC members selected the following two volume rate structure alternatives. Alternative #2: COS/Existing Structure Adjusted for Cost of Service. Calculate each customer class COS rates with existing rate structures (i.e., rates and structure vary by class) Alternative #3: COS/AWC All. Calculate each customer class COS rates using an AWC rate structure that is the same for all classes (i.e., rates vary by class/structure same for all classes) Volume Rate Structure Alternatives Evaluation Conservation and Demand Management. Both Alternative #2 and Alternative #3 promote the continued conservation/demand management efforts of the City. For Alternative #2, the block 4 threshold has been reduced from 70 to 60 ccf for single residence, duplex, and triplex classes. This change broadens the price signal to include more customers who have usage in block 4. Alternative #3 reduces the block 4 threshold from 700% to 600% of AWC. This to moves more customers into block 4 and sends a price signal to reduce usage during peak periods for both residential and CII classes. Interclass and Intraclass Equity. Through a class-based cost-of-service analysis, the rates for residential and CII classes reflects their specific cost to provide service. This cost-ofservice approach ensures that there is interclass equity that is, no subsidy of costs between the customer classes. The increasing block structure for both alternatives also addresses intraclass equity. With an increasing block structure, customers pay their proportionate share based on their specific usage pattern and contribution to their class revenue requirement. In other words, 2018 SLCDPU Rate Advisory Committee 9
68 customers with lower, more steady demands cost less to serve than customers with seasonal peak demands that have usage in the higher or more expensive tiers. Whereas both structures achieve intraclass equity, there are slight differences between the two. The Alternative #2 block thresholds distinguish between indoor and outdoor use for residential classes. Block 1 captures average indoor use. The second block recovers the cost associated with outdoor usage for an average size lot. Blocks 3 and 4 is for usage above the average outdoor use. With Alternative #2, the outdoor use typical occurs during peak periods of demand. As a result, the cost to provide the outdoor demands is greater as well. The Alternative #3 block thresholds are based on the non-peak and peak demands for each customer. Block 1, usage up to the customer s AWC, captures the non-peak demand for each customer. This volume is priced at the lowest rate or unit cost as these volumes represent minimum demands placed on the system. The second block threshold represents the cost to provide service during peak periods for each customer. Blocks 3 and 4 also recover the cost to provide water service during peak demand periods. Essential Use Affordability. Essential use affordability was a highly ranked pricing objective. The RAC recognized that the rate structure should provide essential water service at the lowest possible rate. The RAC also recognizes that assistance programs can play a significant role in ensuring full access to essential water use; perhaps an even greater role than the rate structure. Under Alternative #2 and Alternative #3, the block 1 rate is set at the lowest rate. For Alternative #2, the lowest rate applies up to 10 ccf for single residence customers. Under Alternative #3, the block 1 threshold is set to each customer s average winter consumption. This ensures that everyone pays for essential water use at the same rate. The primary difference between Alternative #2 and Alternative #3 is that under Alternative #2, essential use above the 10 ccf threshold would be charged at the block 2 rate rather than the block 1 rate in Alternative #3. An affordability measurement was discussed at Meeting #2. The measure showed an analysis of how many hours each month, a typical residential household would have to work at minimum wage to pay an essential use water and sewer bill. Table 2 contains the results of this analysis and comparison to other communities. Under the current City water and sewer rates, it would take approximately 4.6 hours at minimum wage to pay for an essential services bill SLCDPU Rate Advisory Committee 10
69 Table 2 Hours Required at Minimum Wage to Pay Monthly Water and Sewer Minimum Services Bill City/Utility Essential Services Water and Sewer Bill (1) Hours Worked at Minimum Wage Phoenix $ Provo* SLCDPU: City - New Structures (2) SLCDPU: City Existing Las Vegas Albuquerque Sandy* Sacramento West Valley* SLCDPU: County - New Structure (2) SLCDPU: County Existing Local Utah Average Denver Aurora Portland Ogden National Average Boise West Jordan* Santa Fe Seattle* *Local Utah utilities 1. Essential water use is 6 ccf and contributed sewer volume is 6 ccf 2. The monthly bill shown is an average of each alternatives monthly bill. The City s existing rates and structure as well as the proposed alternatives for water and sewer are among the lowest locally and regionally in terms of the hours worked at minimum wage to pay for an essential use water and sewer services bill. Rate Stability. Both alternatives provide for rate stability. Like rate adjustments in the past, these rates allow the City to, in the future, make overall rate adjustments to the entire structure (i.e., increasing the minimum charge and volume rate at the same percentage) or the City may choose to adjust a specific component of the structure such as increasing the minimum charge only to recover the additional revenue needed. Conversely, the City may increase one or all of the volume rates to achieve specific goals revenue stability, additional conservation, or adjusting prices to reflect changes in providing indoor/outdoor or non-peak/peak demands SLCDPU Rate Advisory Committee 11
70 7.2 Selected Sewer Rate Structure Alternatives The RAC selected the following sewer rate structure alternatives for consideration by the PUAC. Alternative #1: No Minimum Charge. Only a volume rate applied to average winter consumption for all customers. No AWC = no bill. Alternative #3: Status Quo with a Reduced Minimum Charge. Calculate rates under current cost of service methodology and rate structures however, reduce the minimum charge by approximately 50%. Sewer Structure Alternatives Evaluation Both sewer rate structure alternatives retain the volume rate that varies by the contributed flow and strength. The existing and adopted volume rate consists of three components the contributed sewer flow rate, the BOD rate, and the TSS rate. The contributed sewer flow rate is the same for all seven strength classes. The BOD volume rate and the TSS volume rate vary based on the customer s strength classification. Interclass equity is achieved by recovering the cost to provide service for each strength class based on their specific strength volume rate. Both Alternative #1 and Alternative #3 improve intraclass equity through a change in the minimum charge. Currently, the minimum charge is billed based on the average water usage for the months November through March (AWC) times the class volume rate or a minimum charge is $10.36, whichever is greater. By eliminating the minimum charge in Alternative #2, customers would pay based solely on the contributed flow. The lowered minimum charge in Alternative #3 recognizes that regardless of contributed flow, there should be a minimum charge to recognize the readiness to provide service to customers SLCDPU Rate Advisory Committee 12
71 8.0 Comparison of Existing Structure and Rates to Alternatives The recommended rate structures produced the following conceptual rates. Actual rates adopted by the SLCDPU in future rate studies will be based on different budget year data, customer and utility system data. The rates comparison in Tables 3 through 5 illustrate how water rates would change, comparatively, under the different alternatives. Table 6 shows existing and proposes sewer rate alternatives. Table 3 Water Comparison of Existing and Alternative Minimum Charge (1) $ per monthly bill Meter Size Existing Alternative $ Change % Change 3/4" $9.51 $7.02 ($2.49) -26% (0.66) -7% 1 ½ % 2" % 3" % 4'' % 6" % 8" % % (1) County minimum charges are 1.35 times City minimum charges Table 4 Water Comparison of City Existing and Alternative Volume Rates (1) Single Residence ($ per ccf) Description Existing (1) Alternative #2 COS/Existing Alternative #3 COS/AWC All Winter Period (Nov-Mar) Summer Period (Apr-Oct) Block 1 $1.30 $1.29 $1.27 Block Block Block (1) County volume rates are 1.35 times the City volume rates SLCDPU Rate Advisory Committee 13
72 Table 5 Water Comparison of City Existing and Alternative Volume Rates (1) CII ($ per ccf) Description Existing Alternative #2 COS/Existing Alternative #3 COS/AWC All Winter Period (Nov-Mar) Summer Period (Apr-Oct) Block 1 $1.30 $1.40 $1.40 Block Block Block (1) County rates are 1.35 times the City volume rates. Class BOD Strength (mg/l) Table 6 Sewer Rate Structure Alternatives ($ per ccf) TSS Strength (mg/l) Existing Alt. 1 Alt. 3 $ per ccf (1) $ per ccf (2) $ per ccf (3) 1 <300 <300 $2.65 $2.82 $ , , ,200 1,500 1,200 1, ,501 1,800 1,501 1, >1,800 >1,800 Separately Monitored Class 1. Customers billed based on the average water usage for the months November through March (AWC) or a minimum charge is $12.53, whichever is greater 2. No minimum charge. 3. Customers billed based on the average water usage for the months November through March (AWC) or a minimum charge is $6.27, whichever is greater 2018 SLCDPU Rate Advisory Committee 14
73 9.0 Customer Bill Impacts This section presents typical summer monthly water and sewer bills and bill impacts for City Single Residence and CII customers. 9.1 City Water Single Residence Typical Monthly Bills and Bill Impacts Table 7 shows the typical monthly bill for various levels of consumption under existing, Alternative #2 and Alternative #3 rates and structures. Table 7 Water Typical Monthly Summer Bills Under Existing and Proposed Rate Structure Alternatives City Single Residence Customers Summer Usage Existing Alt. #2: COS/Existing Alt.#3: COS/AWC All AWC = 6 ccf Monthly Bill Monthly Bill $ Change % Change Monthly Bill $ Change % Change 0 $9.51 $7.02 ($2.49) -26.2% $7.02 ($2.49) -26.2% (2.54) -15.9% (2.64) -16.5% (2.59) -11.5% (0.95) -4.2% (2.69) -6.7% (0.09) -0.2% (2.79) -4.8% % (2.99) -3.6% % (3.19) -3.0% % (3.39) -2.6% % (1.99) -1.3% % The 10.7% increase at 30 ccf for Alternative 3 is due to the difference in the block 3 thresholds to the existing rate structure thresholds. Under the existing rate structure, usage is billed in blocks 1 and 2. Under Alternative #3, usage is billed in block 1, 2, and 3. Stated differently, with an AWC of 6, usage above 18 ccf is billed at the block 3 rate for alternative 3 rate ($2.41 per ccf) while the usage above 18 ccf in the existing structure is billed at the block 2 rate ($1.78 per ccf). Tables 8 shows the customer bill impact for City Single Residence customers under Alternative 2 to the existing rates. Under alternative 2, virtually all monthly bills will decrease between $0 and -$5 from bills under existing rates. Similarly, 36.7% of bills will decrease 0 to 5%. This due in part to the reduction in the ¾ meter fixed charge and rates based on class cost-of-service. Class cost of service volume rates are lower than existing volume rates SLCDPU Rate Advisory Committee 15
74 Table 8 Water Single Residence Customer Summer Bill Impact Comparison of Alt. #2: COS/Existing to Existing Rates $ Change in Monthly Bill Percent of Bills % Change in Monthly Bill Percent of Bills <-$10 0.0% < -10% 43.6% -$5 to -$10 0.1% -10% to -5% 19.7% -$5 to $0 99.9% -5% to 0% 36.7% $0 to $5 0.0% 0% to 5% 0.0% $5 to $10 0.0% 5% to 10% 0.0% $10 to $15 0.0% 10% to 15% 0.0% $15 to $20 0.0% 15% to 20% 0.0% >$20 0.0% >20% 0.0% Table 9 shows the Single Residence customer bill impacts of Alternative #3 to existing rates. Approximately 71% of monthly bills will decrease between $0 to $5 under Alternative #3. The high percentage of bills with a decrease is due in part to the reduced ¾ meter fixed charge and class cost-of-service rates 5. Class cost-of-service volume rates are lower than existing volume rates. Bills with an increase can be attributed to the usage distribution based on each customers individualized block thresholds. 5 Approximate 88% of single residence meters are ¾ SLCDPU Rate Advisory Committee 16
75 Table 9 Water Single Residence Customer Summer Bill Impact Comparison of Alt. #3: COS/AWC All to Existing Rates $ Change in Monthly Bill Percent of Bills % Change in Monthly Bill Percent of Bills <-$10 4.1% < -10% 44.6% -$5 to -$10 3.6% -10% to -5% 11.9% -$5 to $0 71.0% -5% to 0% 22.2% $0 to $5 12.5% 0% to 5% 9.6% $5 to $10 8.8% 5% to 10% 10.8% $10 to $15 0.0% 10% to 15% 0.9% $15 to $20 0.0% 15% to 20% 0.0% >$20 0.0% >20% 0.0% 9.2 City Water CII Typical Monthly Bills and Bill Impacts Table 10 shows the typical monthly bill for various levels of consumption under existing, Alternative #2 and Alternative #3 rates and structures. Table 10 Water Typical Monthly Summer Bills Under Existing and Proposed Rate Structure Alternatives (1) City CII Customers (2) Summer Usage ccf Existing Rates Alternative #2 Alt. #2: COS/Existing $ Change % Change Alternative #3 Alt. #3: COS/AWC All $ Change % Change 0 $12.19 $18.92 $ % $18.92 $ % % % % % % % % % % % % % % % (1) Rates and structure for CII Alt. #2 and Alt. #3 are the same. (2) 2 CII customer with an AWC of 100 ccf. Proposed structure: Block 1: ccf Block 2: ccf Block 3: ccf Block 4: >600 ccf The 55.2% or $18.92 change in monthly bill for zero usage due to the change in the monthly fixed charge SLCDPU Rate Advisory Committee 17
76 Tables 11 shows the customer bill impact for City CII customers of water Alternative #2and #3 to the existing rates. The rate structure and rates under Alternatives #2 and #3 are the same. Under the alternatives, about 24% of bills will increase between $0 and $5. Drivers for the increases are due to increases in larger meter size fixed charges and class-based cost-of-service rates which are higher than the existing rates. Table 11 Water CII Customer Summer Bill Impact Comparison of Alternatives #2 and #3 to Existing Rates (1) $ Change in Monthly Bill Percent of Bills % Change in Monthly Bill Percent of Bills <-$10 0.5% < -10% 14.4% -$5 to -$10 0.1% -10% to -5% 8.2% -$5 to $0 31.2% -5% to 0% 9.2% $0 to $5 24.4% 0% to 5% 17.5% $5 to $ % 5% to 10% 38.0% $10 to $15 6.2% 10% to 15% 6.5% $15 to $20 4.1% 15% to 20% 2.3% >$ % >20% 3.9% (1) Rates and structure for CII Alt. #2 and Alt. #3 are the same. 9.3 City Sewer Typical Monthly Bills and Bill Impacts Table 12 shows City single residence typical monthly sewer bills under the existing rates and structure to Alternative #1 and Alternative #3 rates and structures. Table 12 Sewer Typical Monthly Sewer Bill Comparison Class 1 BOD, 1 TSS Customer Sewer Existing Structure Alt. #1: No Minimum Charge Alt. 3: Reduced Minimum Charge Flow ccf Monthly Bill Monthly Bill $ Change % Change Monthly Bill $ Change % Change 0 $10.36 $0.00 ($10.36) % $6.27 ($4.09) -39.5% (7.54) -72.8% $6.27 (4.09) -39.5% (4.72) -45.6% $6.27 (4.09) -39.5% (1.90) -18.3% $8.37 (1.99) -19.2% % $ % % $ % % $ % % $ % % $ % % $ % % $ % 2018 SLCDPU Rate Advisory Committee 18
77 Table 13 shows CII typical monthly sewer bills under the existing and proposed rate alternatives for a Class 4 CII customer. Table 13 Sewer City CII Typical Monthly Bill Comparison Class 4 BOD, 4 TSS Sewer Flow Existing Structure Alt. #1: No Minimum Charge Alt. #3: Reduced Minimum Charge ccf Monthly Bill Monthly Bill $ Change % Change Monthly Bill $ Change % Change 0 $10.36 $0.00 ($10.36) % $6.27 ($4.09) -39.5% 5 $29.45 $27.95 (1.50) -5.1% $27.20 (2.25) -7.6% 10 $58.90 $55.90 (3.00) -5.1% $54.40 (4.50) -7.6% 20 $ $ (6.00) -5.1% $ (9.00) -7.6% 30 $ $ (9.00) -5.1% $ (13.50) -7.6% 45 $ $ (13.50) -5.1% $ (20.25) -7.6% 55 $ $ (16.50) -5.1% $ (24.75) -7.6% 60 $ $ (18.00) -5.1% $ (27.00) -7.6% 70 $ $ (21.00) -5.1% $ (31.50) -7.6% 80 $ $ (24.00) -5.1% $ (36.00) -7.6% Table 14 shows the bill impact for all sewer customers bills under Alternative 1 compared to existing rates. Under alternative 1, approximately 49% of bills will increase between $0 and $2.50. This is due primarily the higher volume rates in Alternative 1. The class 1 rate is $2.82 per ccf for all volume compared to $2.65 under the existing rates. Table 14 Sewer City Customer Bill Impact Alt. #1: No Minimum to Existing Rates All City Sewer Customers $ Change in Monthly Bill Percent of Bills % Change in Monthly Bill Percent of Bills < -$ % < -10% 26.7% -$10 to -$5 6.2% -10% to -5% 11.6% -$5 to $0 20.5% -5% to -0% 0.3% $0 to $ % 0% to 5% 0.6% $2.50 to $5 6.6% 5% to 10% 50.0% $5 to $10 2.7% 10% to 15% 0.0% $10 to $15 0.8% 15% to 20% 0.0% > $15 2.0% >20% 10.9% Table 15 shows the bill impacts of Alternative #3 for all sewer customers. The 38% of bills with a decrease between $0 and $5 is due to the large number of bills with sewer volumes of 3 ccf or less. Under the existing structure, the class 1 bill for 3 ccf and less is $10.63 while under Alternative #3, the bill is $ Bills with volume between 3 and 4 ccf will be 6 Class 1 customer bills represent approximately 44.5% of total sewer bills SLCDPU Rate Advisory Committee 19
78 assessed Alternative #3 volume rate rather than the existing minimum charge. Bills with volume greater than 4 ccf will be assessed the Alternative #3 volume rate of $2.79 per ccf, an increase of $0.14 per ccf over the existing rate. Table 15 Sewer City Customer Bill Impacts Alt. #3: Reduced Minimum Charge All City Sewer Customers $ Change in Monthly Bill Percent of Bills % Change in Monthly Bill Percent of Bills < -$10 0.6% < -10% 27.1% -$10 to -$5 0.1% -10% to -5% 11.1% -$5 to $0 37.8% -5% to -0% 0.3% $0 to $ % 0% to 5% 0.6% $2.50 to $5 5.6% 5% to 10% 50.0% $5 to $10 2.2% 10% to 15% 0.0% $10 to $15 0.6% 15% to 20% 0.0% > $15 1.7% >20% 10.8% 2018 SLCDPU Rate Advisory Committee 20
79 Salt Lake City Department of Public Utilities 2018 Water and Sewer Rate Study Recommendations APPENDIX A Rate Advisory Committee Roster


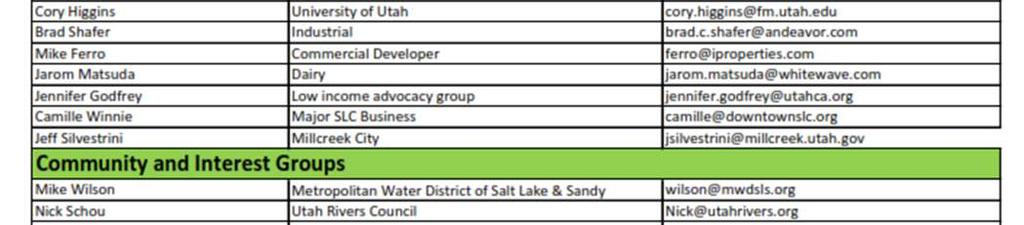
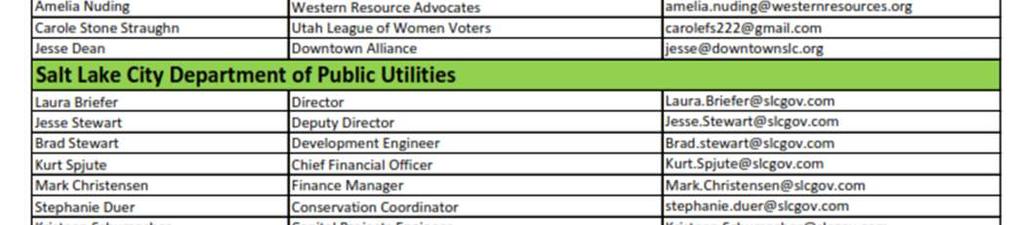
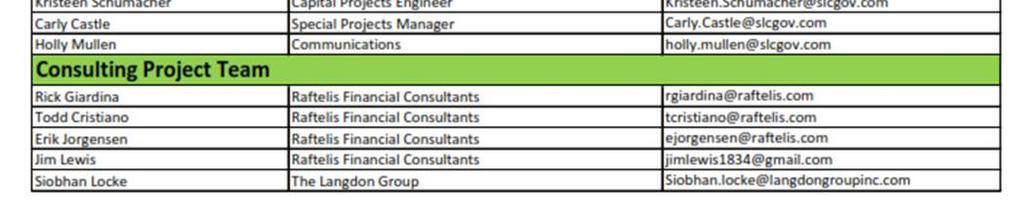
80 2018 SLCDPU Rate Advisory Committee A-1
81 Salt Lake City Department of Public Utilities 2018 Water and Sewer Rate Study Recommendations APPENDIX B RAC Member s Feedback


82 2018 SLCDPU Rate Advisory Committee B-1


83 2018 SLCDPU Rate Advisory Committee B-2