Valuing nature s benefits for humans
|
|
|
- Edwin Chambers
- 5 years ago
- Views:
Transcription


1 Valuing nature s benefits for humans Vision
 Nature s Value Earth s Benefits Nature s Benefits Environmental Value Environmental Wealth")
2 Nature s Value and Nature s Benefits receive the highest average scores. (Ranked by 7 very appealing; On a scale from 1-7 where 1 is not at all appealing and 7 is very appealing ) Nature s Value Earth s Benefits Nature s Benefits Environmental Value Environmental Wealth Natural Life-Support Nature s Health and Safety Systems The Planet s Assets 61% 55% 53% 49% 45% 44% 46% 45% Average Score Here are some phrases people might use to describe the idea of calculating the dollar value of the benefits provided by conserving natural resources, including land and water, in their natural state. After you hear each phrase, please rate how appealing it sounds to you on a scale of one to seven, where one means NOT AT ALL APPEALING and seven means VERY APPEALING. A rating of 4 is NEUTRAL. Split Sample

3 Continued Environmental Goods Ecological Wealth Nature s Social Safety Net Natural Infrastructure The Planet s Products and Services Ecosystem Services Earth s Capital Natural Capital 44% 42% 34% 32% 34% 31% 29% 30% Average Score Here are some phrases people might use to describe the idea of calculating the dollar value of the benefits provided by conserving natural resources, including land and water, in their natural state. After you hear each phrase, please rate how appealing it sounds to you on a scale of one to seven, where one means NOT AT ALL APPEALING and seven means VERY APPEALING. A rating of 4 is NEUTRAL. Split Sample
4 NatCap approach to mainstreaming ecosystem service information in management and policy Case examples: Designing water funds in Colombia Assessing impacts of mining concessions Defining ecological function conservation areas in China Informing marine spatial planning in British Columbia Next steps

5 Filling the Gap

6 Filling the Gap Most Policy Windows Medium spatial scale Short timeline Standard approach

7 Integrated Valuation of Ecosystem Services and Tradeoffs (InVEST) Applicable anywhere on the globe With minimal data Flexible scale Scenario based Relevant to many kinds of decisions Biophysical and socioeconomic outputs Biodiversity and multiservices

8 Applying InVEST to inform decision-making Coastal & Marine Terrestrial WCVI, B.C. Hawai i California Puget Sound Chesapeake Bay Galveston Bay Belize Colombia Ecuador Amazon Basin Eastern Arc Mtns China Indonesia
9 Testing many kinds of decision contexts Decision Context Spatial Planning Coastal Zone Management Ecosystem-based management (terrestrial-marine links) Climate adaptation (ecosystem-based adaptation) Return on restoration investments Impact assessment, permitting, licensing Geography Tanzania, Indonesia, British Columbia, Hawaii, China Belize Puget Sound, Galveston Bay, Chesapeake Bay Galveston Bay, Monterey Bay Colombia water funds, Gulf of Mexico, Indonesia Colombia mining concessions, agricultural practices in US


10 NatCap approach to mainstreaming ecosystem service information in management and policy Case examples: Designing water funds in Colombia Assessing impacts of mining concessions Defining ecological function conservation areas in China Informing marine spatial planning in British Columbia Next steps
11 Stakeholder Engagement Identify Objectives Develop Scenarios Compile Data


12 Water For Life and Sustainability Water Fund
 Maintain consistent water flows necessary for drinking water, biodiversity and agriculture through a coordinated")
13 Water For Life and Sustainability Water Fund Committee: Watershed Associations Sugar Cane Associations The Nature Conservancy Vallenpaz (local NGO) Maintain consistent water flows necessary for drinking water, biodiversity and agriculture through a coordinated strategy.

14 Scenario Development Spatially explicit land uses, agricultural/silvicultural practices Landscape ranking Efficient investment for 5 target budgets TNC and CIAT compiled data
15 Stakeholder Engagement InVEST Identify Objectives Develop Scenarios Compile Data Biophysical Models Economic Models


16 Spatial Data Inputs on Natural Capital Land Use Soil type Topography


17 Spatial Data Inputs on Built Capital Roads Cities Infrastructure

18 InVEST Outputs Supply Service Value Ecological functions Ecosystem elements Supply + Location and activity of beneficiaries Service + Social preference

19 Multi-Service Approach InVEST Beta can map Biodiversity Water yield for hydropower production Avoided reservoir sedimentation Water purification: nutrient retention Carbon seq & storage Managed timber production Crop pollination

20 T1 Economic Valuation Methods Market valuation Carbon Timber Non-timber forest products Avoided damage costs Water purification Flood mitigation Avoided reservoir sedimentation Production Economics Water for irrigation Pollination of agricultural crops

21 InVEST Outputs
22 Return on Investment Results Amaime River Watershed
23 Return on Investment Results Amaime Nima Bolo Tulua Fraile Guabas Desbaratado Palo Sabaletas
24 Investment Portfolios Tulua River Watershed Mapped Output: Where should protection, restoration activities occur for a given investment?


25 Stakeholder Feedback Tulua River Watershed Not Feasible: Guerilla Activity
26 Stakeholder Engagement InVEST Identify Objectives Develop Scenarios Compile Data Biophysical Models Economic Models Post-Analyses

27 Returning Services to the Same People Servicesheds for beneficiaries of mining mitigation Erosion Impacts Nutrient Pollution Impacts

28 Sumatra Land Use Planning Scenario 1 Scenario 2


29 Spatial Pattern of Service Change
 -20-40 Plantation area (km2) / 1000 Avoided erosion (tons / yr) / 100000 Carbon stock over 50 yrs (Mt) /")
30 Multi-Service Tradeoffs Summed habitat quality score / Natural habitat (km2) / Water yield runoff depth (mm/yr) Plantation area (km2) / 1000 Avoided erosion (tons / yr) / Carbon stock over 50 yrs (Mt) / 100


31 Baoxing EFCA Mapping with InVEST PRODUCTION: -Water Retention - Soil Retention - Carbon Storage - Biodiversity DEMAND: Hydropower Flood Mitigation Irrigation Agriculture, Mining Draft EFCA Map


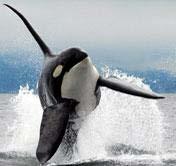

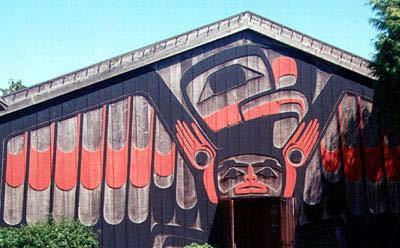
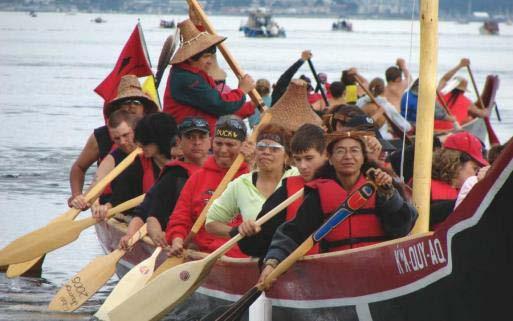
32 Marine spatial planning in British Columbia 40,000 people 11% Nuu-chah-nulth First Nations Logging, fishing, aquaculture, tourism

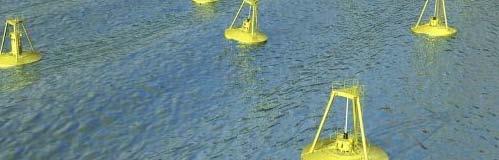


33 Marine InVEST Recreation Aquaculture Fisheries Coastal Protection Nursery Transformation & sequestration Energy generation


34 Commercial Salmon Trawl Commercial Salmon Net Commercial Crab Recreational Groundfish Recreational Salmon WEC-1 WEC-1 : Generated the greatest energy : Caused the least changes in the aesthetic view of nearby parks : Produced the least conflicts with fishery activities WEC-2 WEC-3

35 Next steps: links to livelihoods, poverty alleviation, human health
36

37 Model Testing: USA Annual Avg Yield SWAT R² = Annual Avg Yield InVEST
38 Model Testing: Colombia Comparison of SWAT and InVEST Average annual water yield (mm) TULUA SWAT InVEST % difference Baseline % No conservation % Conservation % FRAILE SWAT InVEST % difference Baseline % No conservation % Conservation %
39 Model Testing: Hainan Island, China