North Texas Alternative Futures. Transportation. September 15, 2009
|
|
|
- Stanley Gray
- 5 years ago
- Views:
Transcription

1 September 15, 2009
2 Page i Table of Contents Page System... 1 Methodology... 1 Findings... 2 Bicycle and Pedestrian... 7 Action Tools Assumptions and Limitations Vision North Texas Research Contributors... 16

3 Page 1 System Traffic congestion is one of the most important indicators of the performance of the transportation network in the region. The Business As Usual Scenario and the four alternative scenarios modeled by the NCTCOG Department show that changes in development patterns can make a significant difference to reducing travel time, commuting patterns, and infrastructure needs. Methodology The alternative demographics were created by the NCTCOG Research & Information Services (RIS) Department by adjusting the NCTCOG s 2030 Forecast demographic data to fit the alternative scenarios identified by the VNT workshop participants. The household and population estimates were manually redistributed among the Traffic Survey Zones (TSZ) within the 12-County region, to match the alternative demographic growth distribution identified by the workshop participants. The NCTCOG Department utilized these alternative demographic data and the Dallas-Fort Worth Regional Travel Model to produce alternative scenario transportation model outputs. The travel demand models were run for the transportation network within the Metropolitan Planning Area (MPA) boundary, which includes five full counties and portions of four other counties. The roadway and transit networks used for the transportation model represent Mobility 2030: The Metropolitan Plan for the Dallas-Fort Worth Area, 2009 Amendment, which includes, among other projects, the Regional Outer Loop and the Rail North Texas network. Mobility Amendment is the defining vision for transportation systems and services in the Dallas-Fort Worth Metropolitan Area. The maps below show the road and rail networks included in the network used for the model runs. Air quality benefits were calculated based on projected automobile and transit usage of the transportation network. The remainder of the region outside the MPA boundary could not be modeled, but general observations are made in this area based on the trends observed in the modeled area. Note: The roadway shown in dotted green is not included in the road network used for the travel model.

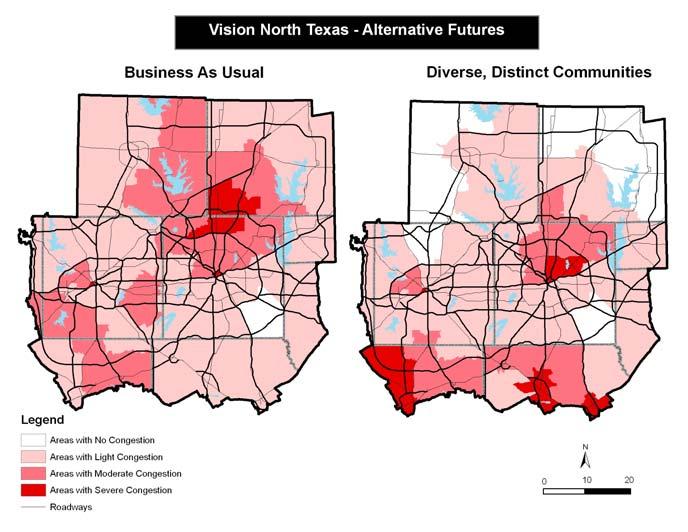
4 Page 2 Findings The table, on the following page, summarizes the results of transportation modeling for these scenarios. All the alternative scenarios reduce the average trip length by over 10 percent. The Return on Investment Scenario and the Diverse, Distinct Communities Scenario have the lowest average trip length, 13 percent lower than the Business As Usual Scenario due to the nature of concentrated growth in areas that are already developed. As expected, the Connected Centers Scenario has the highest increase in rail transit boardings, 19 percent higher than the Business As Usual Scenario, which is due to the transit connections between the developed centers. Among the four scenarios, the Diverse, Distinct Communities Scenario shows the largest reduction in miles traveled, by 11 percent, and the largest drop in travel time, by 13 percent. This scenario also increases the bus boardings by 20 percent. This result would be attributed to population and employment being centralized within smaller communities.
5 Page 3 Business As Usual Connected Centers Return on Investment Diverse, Distinct Communities Green Region % Change from Business As % Change from Business As % Change from Business As % Change from Business As Scenario Number Usual Number Usual Number Usual Number Usual 2030 Data for All Scenarios (Metropolitan Planning Area) Average Trip Length % % % % Rail Transit Boardings 224, , % 235, % 235, % 227, % Non-Rail Transit Boardings 365, , % 437, % 438, % 418, % Vehicle Miles Traveled 241 M 222 M -7.9% 222 M -7.9% 215 M -10.8% 221 M -8.3% Vehicle Hours Traveled 6.2 M 5.6 M -9.7% 5.7 M -8.1% 5.4 M -12.9% 5.5 M -11.3% The table, on the following page, shows that the region can benefit by the alternative scenarios through possible reduced: congestion, traffic delays, and need for additional transportation infrastructure, yielding improved air quality. The Green Region and the Diverse, Distinct Communities Scenarios reduce the hours residents spend in traffic by 19 percent. The Return on Investment and Diverse, Distinct Communities Scenarios need 8 percent fewer lane miles and over 7 square miles less road pavement than the Business As Usual scenario. The above scenarios save roadway paving equivalent to an area almost as large as the cities of Joshua or White Settlement. These reductions in infrastructure needs have large impacts on transportation funding. The Return on Investment scenario showed approximately $6.9 billion in cost savings for required infrastructure needs. The Environmental Protection Agency (EPA) has designated the North Central Texas region as a non-attainment area for the pollutant ozone. The non-attainment status means that the region does not meet the national primary or secondary ambient air quality standard established by the EPA for designated pollutants, such as carbon monoxide and ozone. Vehicle emissions are a major contributor to ozone formation due to the presence of two key ingredients to ozone formation in automobile emissions: nitrous oxides (NOx) and volatile organic compounds (VOCs). The Regional Council (RTC) selects millions of dollars
6 Page 4 worth of projects and programs every year to implement policies that aim to reduce vehicle emissions and improve the air quality in the region. The air quality analysis indicates that the Diverse, Distinct Communities scenario provides the maximum air quality benefits at 11 percent reduction in VOC and CO emissions, 10 percent reduction in CO2 emissions and 9 percent reduction in NOx emissions. Again, this scenario keeps population and employment contained within the same areas. For example, those living in Lewisville could choose to work in Lewisville and those living in Waxahachie could choose to work in Waxahachie, etc., so that there are fewer commute trips. System Benefits Percentage Change from Business As Usual Scenario (Based on difference in level of Service 'A,B,C' Roadways Compared to 2030 Forecast) Diverse, Connected Centers Return on Investment Distinct Communities Green Region Vehicle Hours of Delay -15.7% -14.7% -18.7% -19.4% Lane Mile Needs -6.1% -8.0% -7.9% -6.5% Roadway Pavement Needs (Square Miles) Financial Needs ($ Billions) -$4.9 -$6.9 -$6.5 -$5.4 VOC Emissions (Volatile Organic Compounds) -8.4% -8.3% -11.3% -8.4% Nox Emissions (Nitrogen Oxides) -6.6% -6.5% -9.2% -6.3% CO Emissions (Carbon Monoxide) -8.4% -8.6% -11.6% -8.2% CO2 Emissions (Carbon Dioxide) -7.3% -7.3% -10.2% -6.9% Based on the data provided by NCTCOG s regional travel model, traffic congestion levels for the Business As Usual scenario and alternative scenarios in 2030 are graphically shown on the following maps. The dark red areas indicate severe congestion and the lighter colors represent lower levels of congestion. All the alternative scenarios show a general decrease in traffic congestion levels with almost no congestion near the MPA boundaries in Collin, Denton, and Kaufman counties.
7 Page 5
8 Page 6

9 Page 7 These scenarios all accommodate the same amount of growth. The alternatives reflect the different household and employment growth patterns desired by the diverse stakeholders who participated in the workshops. The transportation modeling shows that these alternative growth patterns could help reduce traffic congestion, delays, and the funding required to meet transportation needs. However, the level of transportation investment over time would influence and be influenced by the trends and location of population and employment growth. As cities promote infill development and modify minimum densities, the region would begin the slow shift towards one of the alternative scenarios. The travel demand model only takes into account the shift in the population and employment, not the transportation infrastructure change that would certainly accompany the relocation of people and jobs. The dollars spent on roads and rail to the outer limits of the planning area would likely be more efficiently spent closer to the middle of the region to accommodate the increased number of trips occurring there. Likewise, some scenarios provide for assumptions that may be hard to replicate. For example, the Diverse, Distinct Communities Scenario assumes population and employment are linked, but thousands of employees will continue to commute to downtowns Dallas and Fort Worth, the Las Colinas Urban Center, and other large centers of employment as other, predominately residential, communities are already at or near their build-out potential. Bicycle and Pedestrian The Regional Veloweb The Regional Veloweb is a 644-mile interconnected network of offstreet trails designed to provide safe, efficient mobility to pedestrians and cyclists throughout the North Texas Region. Many of the Access to Rail Study Recommendations are included as part of the Regional Veloweb, as well as many additional segments that are in areas without existing transit stations. Individual routes were determined by a number of factors including: those that provided air quality benefits, linkages to transit stations, and access to employment locations, transit stations, schools, and other commuter and recreational destinations. The Regional Veloweb map that is included in Mobility 2030: The Metropolitan Plan for the Dallas- Fort Worth Area, 2009 Amendment can be viewed to the right.
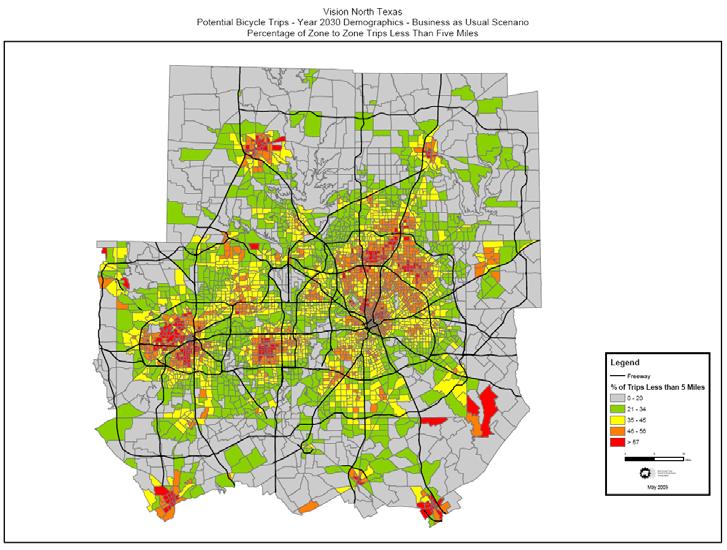
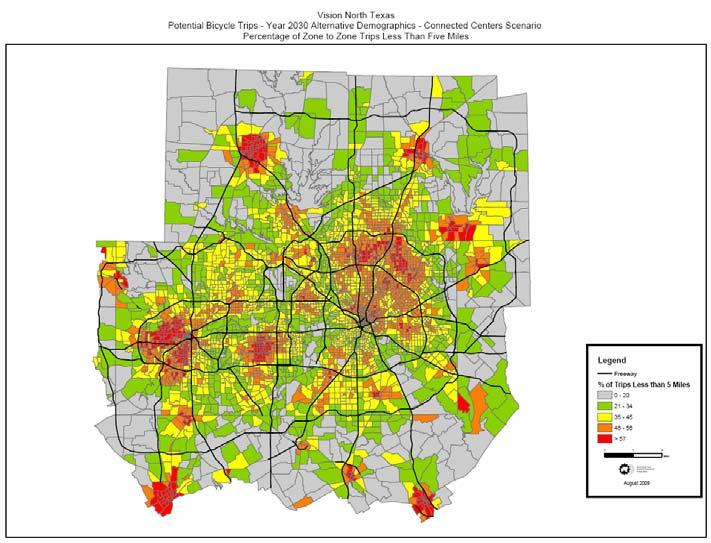
10 Page 8 Potential Bike Trips Trips that are less than five miles in length have a higher potential to be made by bicycle or by foot rather than by automobile, which provides for a reduction in vehicle miles traveled. The table below provides the number and percentage of forecasted trips less than five miles in length for each alternative scenario. The Return on Investment showed a 24.3 percent increase in trips less than five miles and the Diverse, Distinct Communities Scenario showed a 23.4 percent increase, compared to the Business As Usual Scenario. Business as Usual Connected Centers Return on Investment Diverse, Distinct Communities Green Region Trips Less than 5 Miles 10,868,587 12,509,416 13,513,712 13,412,677 12,686,653 Total Trips 32,745,053 30,280,822 31,218,592 29,975,172 30,183,243 Percentage of Total Trips 33.2% 41.3% 43.3% 44.7% 42.0% Difference from Business As Usual (for Trips Less than 5 Miles) - 1,640,829 2,645,125 2,544,090 1,818,066 Percentage Difference from Business As Usual (for Trips Less than 5 Miles) 15.1% 24.3% 23.4% 16.7% The following maps illustrate the percentage of trips between traffic survey zones (TSZ) that are less than five miles in length. These maps were created using daily zonal productions and attractions data generated from the Dallas-Fort Worth Regional Travel Model. The roadway and transit networks for all scenarios are consistent with Mobility 2030: The Metropolitan Plan for the Dallas-Fort Worth Area, 2009 Amendment. The five maps depict the baseline as well as each of the alternative scenarios presented in the Alternative Futures for North Texas section of this document.
11 Page 9
12 Page 10
13 Page 11 Access to Rail Study The Bicycle and Pedestrian Program released a Rail Station Access study in February 2003, identifying numerous ways in which regional cities could improve bicycle and pedestrian access to the 60 stations servicing light rail and commuter rail scheduled at that time to be operational by the year The stations studied in relation to bicycle and pedestrian access included nine operational commuter rail stations, 34 operational light rail stations (as of 2003), and 17 planned light rail stations. As of August 2009, there are 9 operational commuter rail stations, 35 operational light rail stations, and 29 planned light rail stations scheduled to come on-line by December of Recommendations resulting from the NCTCOG Rail Station Access study included Implementing local improvements, such as sidewalk repair or trail construction, to provide increased alternative transportation routes near stations Promoting safety, convenient access, and incorporating complementary land uses near stations to encourage rail ridership and the success of transportation by rail in the Dallas-Fort Worth area Expanding the rail system to provide a more comprehensive alternative mode of transportation for the growing population in the region The Study s relevance to date is paramount, and investments in bicycle and pedestrian infrastructure and facilities should be focused according to the recommendations in each study area in order to provide an interconnected network that promotes alternative modes of transportation. More information on the Access to Rail Study can be found on the NCTCOG Bicycle and Pedestrian homepage including maps of each study area and implementation strategies.
14 Page 12 Benefits of Bicycle and Pedestrian Access to Rail Mixing land uses increases the number of trip types accessible by rail, Increasing densities increases the frequency of pedestrian, bicycle, or rail trips, Improving sidewalks and other facilities extends the area available to rail patrons, Increasing access through land-use and facility changes increases bike/pedestrian trips, safety, and mode share, and Increasing rates of walking, bicycling, and rail usage decreases roadway congestion and improves air quality. Action Tools Mobility 2030: The Metropolitan Plan for the Dallas-Fort Worth Area, 2009 Amendment is the defining vision for transportation systems and services in the Dallas-Fort Worth Metropolitan Area. The Mobility Plan includes various strategies, action tools, and specific programs related to the transportation component of the alternative scenarios. Various action tools employed by the NCTCOG include funding transportation infrastructure to connect infill and mixed use developments which promote walkable and transit oriented communities; expansion of bicycle and pedestrian trail systems (Veloweb); implementation of other congestion management strategies (traffic signal improvements, employee trip reduction programs, vanpools, etc.) in the Dallas-Fort Worth region; expansion and enhancement of road and transit networks which includes development of the Regional Outer Loop and the Rail North Texas network. The following description provides some of the action tools that NCTCOG is implementing to promote sustainable development, reduce traffic congestion, and improve air quality in the region. Sustainable development is a specific objective of the Mobility Plan because of the direct link between land use, transportation, and air quality. The Regional Council (RTC) has taken a proactive approach to improving regional traffic congestion and air quality through its Sustainable Development Policy adopted in Focusing on the responsibilities of the Metropolitan Planning Organization, the RTC has established the following basic policy directions which serve as strategies to meet financial constraints, diversify mobility, and improve air quality. Overall, the objectives of these practices are to: Respond to local initiatives for town centers, mixed-use growth centers, transit-oriented developments, infill/brownfield developments, and pedestrianoriented projects. Complement rail investments with coordinated investments in park-and-ride, bicycle, and pedestrian facilities. Reduce the growth in VMT per person. The RTC has awarded over $80 million for the sustainable development projects in the region since The Land-Use/ Joint Venture Call for Projects was the first opportunity from NCTCOG for local governments and the private sector to partner together in an effort to secure funding for sustainable development projects. The projects focused on sustainable infrastructure projects throughout the Metropolitan Planning Area. Over $40 million in Federal
15 Page 13 Congestion Mitigation Air Quality (CMAQ) and Surface Program-Metropolitan Mobility (STP-MM) funds were awarded to 19 land-use projects that will have positive impacts on transportation choices in the region. The second Sustainable Development Call for Projects was issued in 2005 in an effort to program funding for sustainable development projects that were located in rail-oriented or infill areas. All the projects funded under the 2005 SDCFP were located Sustainable Development Areas of Interest which identified eligible projects as those located within walking distance to current or potential future station locations; in areas with a concentration of unemployed persons, high emitting vehicles, or low income households; and/or in historic downtowns with multiple contiguous street block frontage of pedestrian-oriented developments. There was $40.16 million in RTC local funds available for infrastructure, land banking, and planning projects. The goal of providing equal opportunities for access to sustainable development projects for both environmental justice and non-environmental justice communities was incorporated into the selection process through both the eligibility and scoring criteria. By taking into account project characteristics related to access to transit, access to jobs, access to housing, provision of workforce housing, provision of jobs in areas of high unemployment, the match between employment and household income, pedestrian connectivity, and overall high unemployment rates, this goal was met. Funding was awarded to 40 projects funded in three categories: 28 infrastructure projects, 8 planning projects, and 4 land banking projects. Funding was also programmed for NCTCOG planning assistance to 52 transit-oriented development projects and support for the Center of Development Excellence. Funding allocated to the TOD Implementation Group is intended to support a regional effort to analyze, market, and implement TOD. The majority of the 2005 sustainable development projects will be completed by May The NCTCOG partnered with the University of Texas at Arlington on two research projects related to sustainable development impact and TOD guide. The sustainable development impact research project focuses on developing a standardized methodology to analyze the impacts of sustainable development projects funded by NCTCOG. The impacts of sustainable development projects on land use and property values will be addressed by the model developed by the research team. The TOD guide research project will develop a how to Transit-Oriented Development guide that assists cities in developing TODs at Dallas-Fort Worth Metropolitan Area. The TOD Guide will include general steps and stages for the development of TODs for small, medium, and large cities related to market analyses, land acquisition, development constraints, zoning changes, site planning, parking needs, design criteria, density recommendations, design, and construction considerations. The NCTCOG is currently implementing various Travel Demand Management (TDM) strategies that help in decreasing traffic congestion and improving air quality in the region. The NCTCOG conducts its work on TDM as part of its Congestion Management Process (CMP) Program, which also includes System Management (TSM) and Intelligent Systems (ITS). The Employer Trip Reduction (ETR) Program is a cooperative program between NCTCOG, Dallas Area Rapid Transit (DART), the Fort Worth Authority (The T), Denton County Authority (DCTA), and other public and private-sector organizations that market alternatives to driving alone on a commute to employers with 100 or more employees. The implementation of rideshare programs (such as carpooling and vanpooling), telecommuting, flexible work hour programs, transit pass subsidies, and bicycle facilities are examples of TDM programs that are encouraged through this marketing effort. At least 596 major employers in the region offer some sort of ETR Program or alternative commute incentive. Ridesharing programs are key elements of any region's TDM effort. The Vanpool Program is one type of ridesharing alternative that is popular among commuters. The expected operating cost for the Vanpool Program at full implementation is projected to be $11.9 million per year (2006
16 Page 14 dollars). At full implementation, with the possible participation of 4,254 employers and over 1.3 million commuters, the program is anticipated to reduce travel by over 39,160 vehicle trips per day. Park-and-ride facilities serve as collection areas for persons transferring to higher occupancy vehicles. They are often located and designed to serve bus or rail transit, but many are used by carpoolers and vanpoolers as well. Considering the magnitude of investment in High-Occupancy-Vehicle (HOV)/managed lanes, rail, and managed tollway facility construction by the year 2030, and the changes in travel behavior that should result, it is estimated that 48 park-and-ride facilities, serving over 10,000 users, will need to be constructed in addition to existing park-and-ride facilities. As part of the 2006 Local Air Quality Call for Projects, the RTC approved the funding of park-and-ride facilities in the Rowlett/Rockwall County area, Grand Prairie/Dallas County area, and the expansion of the Parker Road Station in the Plano/Collin County area. Management Associations (TMAs), also known as Management Organizations or TMOs, are private and public/private organizations that implement congestion mitigation strategies and work together on local transportation issues. Many are incorporated, non-profit organizations; they tend to be membership organizations, made up of employers, developers, building owners, and local government representatives. Most TMAs are located in areas of dense employment and focus on the TDM programs of public and private employers. The estimated cost of providing start-up funds for these TMAs is expected to be approximately $1.2 million per year (2006 dollars) at full program implementation. Passenger rail offers an alternative that adds capacity by reducing the number of vehicles on the roadways. NCTCOG will continue to study and examine the implementation of an expanded passenger rail system to help alleviate traffic congestion by enabling seamless service throughout the region without the need for a personal automobile. The Rail System Recommendations in the Mobility Plan Amendment identified approximately 500 miles of rail lines. Of that, 83 miles are existing service, 128 miles are programmed projects and projects currently under development, an additional 38 miles consist of projects identified in transit authority planning studies, and the remaining 251 miles are projects utilizing funding identified through the Rail North Texas efforts. Existing rail corridors were evaluated for potential passenger rail service. Other potential corridors were added and evaluated to forecast rail ridership along utility corridors and major thoroughfares in the region to identify needed connections. The rail recommendations can be divided into two distinct sets. The first set of recommendations includes rail lines that have identified funding, are currently under study, or are in a long-range plan developed by one of the three local transit agencies. The second set of recommendations adds to the first set by including rail lines that were identified by the Regional Rail Corridor Study (RRCS), Rail North Texas (RNT), and through an alternatives analysis, and are included in this transportation plan. Also, a mature bus system is assumed throughout the transit agency s service areas. The simulation of such a system includes feeder and/or express buses designed to utilize the high-occupancy vehicle (HOV)/managed lanes and rail stations, park-and-ride locations, and transfer centers which are ultimately included in transit recommendations. The rail recommendations were developed to maximize rail corridor interactions and to capitalize on the combinations of routes that produce the most effective ridership results. A map illustrating the recommended rail system is provided under the Methodology section. The process to evaluate potential improvements and identify specific recommendations on controlled-access facilities in the Mobility Plan Amendment were developed in such a way that the most beneficial air quality projects and programs were evaluated first, and the more traditional major capital intensive projects, if they could be afforded both from a financial and air quality standpoint, were evaluated next. To begin evaluating projects for inclusion in the plan, the recommendations from previous metropolitan transportation plans were reviewed. Discussions with the Texas Department of (TxDOT) and the
17 Page 15 North Texas Tollway Authority (NTTA) were conducted to ensure that the proposed recommendations reflect the latest results from all ongoing corridor studies, environmental assessments, environmental impact statements, and advanced planning studies. All proposed congestion management system strategies, rail and bus transit recommendations, and HOV and/or managed facility recommendations are included in the plan prior to analyzing additional capacity needs. This approach assumes that the travel demand is first met through those projects and strategies that have the most air quality benefits and are generally lower in cost before adding single occupant vehicle capacity. Future partnerships between various federal agencies including the Department of (DOT), Housing and Urban Development (HUD), and Environmental Protection Agency (EPA) may improve access to affordable housing, provide more transportation options, lower transportation costs, and create sustainable communities; more innovative transportation policies may emerge in future that will promote regional coordination on creating livable communities through sustainable surface transportation programs. Analysis still needs to be conducted on reviewing and evaluating the effects of various incentive strategies to modify growth and behavior patterns. Local governments across the country employ a variety of tools to effect development such as tax abatements, transfer of development rights, permit discounts and others. Assumptions and Limitations Following are some of the assumptions and limitations identified in the results of the alternative demographics and the transportation model runs: The control totals were the same for the 12 counties. However, the totals for areas inside the MPA differed. The scenario concepts were applied to the 12 counties, not just the MPA. Therefore, the allocation process did not differentiate between areas inside and outside the MPA. This was not intentional, but a function of the allocation process. The differing MPA populations are not erroneous since they accurately reflect the demographic distribution found in the various development concepts. The percentage change in households between the base scenario and the alternative scenarios was lower than the percentage change in population which indicates an increase in household size. However, this does not signify an anticipated increase in household sizes region wide. Household sizes vary by TSZ. Different sets of TSZs received different levels of growth under the various scenarios. This, coupled with the issue from the above item, accounts for the differences in household sizes when looking at the totals. Based on the Population/Employment ratios for the alternative scenarios from the model outputs, more population was added than employment. The Population/Employment control totals and ratios were same for the 12 counties. The allocation of employment and population are independent processes under each of the scenarios. There was nothing in the process, aside from the control totals, to hold the relationship between population and employment to a particular ratio. Also, there is no differentiation in the VNT scenarios between total population and household population.
18 Page 16 For a more accurate measure of population and employment relocation, the transportation network should be equilibrated. This effort would shift the current transportation projects and associated funding to areas that would be experiencing higher than acceptable levels of congestion. This exercise would impact the performance measures results. The reduction in traffic congestion shown by the travel model in the alternative scenarios does not include the congestion caused by traffic incidents or accidents. The cost savings figures are calculated based on $4.2 million per lane mile saved for freeways and $1.25 million per lane mile saved for all other types of roads. This analysis assumes that the current Mobility Amendment transportation system is the background for this analysis. Additional analysis is required to equilibrate for supply and demand for the redistribution of demographics. Local governments should work with the Council of Governments and the Center of Development Excellence to balance the -Land Use interface. The Dallas-Fort Worth Regional Travel Model does not currently forecast bicycle trips. The travel model forecasts pedestrian trips when those commuters are walking to transit. The analysis shown in Potential Bike Trips Section calculates the number of trips that are within five miles or less. It may be assumed that a small percentage of these trips could be made by bike or by foot. Vision North Texas Research Contributors This important discussion about the best futures for North Texas would not be possible without the expertise and involvement of the individuals who serve on the Alternatives Research Team and of the organizations they represent. These contributors are listed below. Behruz Paschai-Awwal, NCTCOG Madhusudhan Venugopal, EIT, NCTCOG Berrien Barks, NCTCOG Michael Burbank, AICP, NCTCOG Chad Edwards, NCTCOG Mitzi Ward, NCTCOG Chad McKeown, NCTCOG Natalie Bettger, NCTCOG Dan Lamers, PE., NCTCOG Patrick Mandapaka, AICP, NCTCOG Deborah Humphreys, NCTCOG Ruth Boward, NCTCOG Donna Coggeshall, NCTCOG Sonya Jackson, NCTCOG Elizabeth Whitaker, NCTCOG Wes Beckham, PE, NCTCOG Karla Weaver, AICP, NCTCOG