Econ 366 Energy Economics. Fall 2012 Transportation Energy Demand
|
|
|
- Julius Washington
- 5 years ago
- Views:
Transcription
1 Econ 366 Energy Economics Fall 2012 Transportation Energy Demand
2 Transportation Energy Demand Two major components: passenger (fuel consumption per passenger mile x passenger miles) and freight (fuel consumption per Many modes: car, truck, rail, air Several fuels: diesel, gasoline, electricity Levels of activity and energy demand are affected by both household and firm decisions.
3 Demand Responses: Short-run: change the number of miles driven (and amount of freight carried) using current vehicle / fleet Long-run: also change vehicle(s) and possibly location of firms / households Unlike residential demand (based on maximizing utility) and industrial demand (based on profitmaximization or cost minimization), transport demand doesn t fit neatly into standard consumer or firm theories large variety of ad hoc models used
4 Examples of Types of Models Used Example 1: (a) Total Transportation Fuel Demand depends on (i) price, (ii) real per capital GDP, and (iii) previous demand (habit effects); (b) Market shares of individual fuels depend on own and substitute prices, real per capita GDP, market share from previous year (path dependence, gradual change of vehicle stock)
5 Changes in the Vehicle Stock: Switching Fuels In addition to standard fuels, purchasers may consider: Electric or hybrid cars LNG as an alternative to diesel for trucking Distribution system needed for each fuel Already in place for gas, diesel chicken-and-egg conundrum for new fuels /09/26/sby-electric-car-charger-stations.html
6 Chicken and Egg Conundrum Low adoption rates of advanced technology vehicles: alternative fuels (ethanol, natural gas); hybrid and battery electric; fuel cells Battery electric cars: high purchase costs small number sold difficult to achieve economies of scale (average costs go down as quantity produced falls) difficult to increase adoption rate... Alternative fuels: lack of refuelling stations less attractive to potential buyers low customer base for potential refuelling station owners low return from investing in setting up stations...
7 Examples of Types of Models Used Example 2: (a) Fuel demand (litres) will be a function of the (i) number of cars, (ii) usage (km/year) of these cars, (iii) fuel consumption of cars (km/litre); (b) Each of these is in turn affected by economic factors: -car ownership, for example, is expected to depend on income and other factors; - usage depends on fuel prices and other factors; -fuel consumption depends on type of vehicle purchased (weight, engine size) and driving habits
8 Examples of Types of Models Used Example 3: Demand for fuel for freight delivery depends on: - volume of goods to be transported (which in turn depends on the strength of the economy) - location of firms and end-users of products - infrastructure and geography (determines wich modes are available) - characteristics of fleet (vehicles, ages, fuel efficiency)
9 Road Transport Component: Example 3 For each vehicle type within a fleet: TED i = Q i x D i x SP i TED = total energy demand Q = quantity of vehicles of type i D = distance travelled SP = Specific consumption of vehicle
10 Road Transport Component: Example 3 Add up over all vehicles: TED = Σ(Q i x D i x SP i ) Let S i = (Q i / Q) where Q is the total fleet size i.e., S i is the share of vehicle type i in the fleet TED = Q Σ(S i x D i x SP i )
11 Road Transport Component: Example 3 TED = Q Σ(S i x D i x SP i ) 4 effects: (i) fleet effect (ii) structural effect (composition of fleet) (iii) mileage effect (iv) technical efficiency effect First 2 primarily influenced by changes in the economy, last 2 affected by policy and technical change
12 Elasticities and Rebound Effects in the Transport Sector: VTI Study Litman, Todd (2012), Changing Vehicle Travel Price Sensitivities: The Rebounding Rebound Effect, Victoria Transport Policy Institute Working Paper Paradox: lower transportation prices lead to higher transportation costs
13 Rebounding Rebound VTI Study transportation prices are the direct payments made by consumers to purchase goods: fuel, parking, road tolls, distance-based insurance premia transportation costs consist of the resources used to provide goods (including social costs or externalities*): increased activity congestion, pollution, accidents externality: effects of one agent s decision on agents who are not voluntary parties to the decision
14 Rebounding Rebound VTI Study changes in prices changes in activity levels changes in fuel demand, pollution, congestion success of price-based policies depend on how strong the link between changes in prices and changes in activity levels and/or fuel demand is
15 Rebounding Rebound VTI Study if vehicle travel is inelastic, responses to price changes will be small factors that affect elasticities in the transport sector: importance of fuel price in the household s transport budget (many other costs of driving, fuel may be a relatively minor cost); expected duration of price change (temporary?); income (low-income consumers more price responsive); local alternatives (public transit a viable option?) time period considered (short-run vs long-run)
16 Fuel Consumption and Fuel Price
17 Elasticity Evidence: VTI Study cross-country evidence from OECD countries indicate a strong negative relationship between per capita transportation energy consumption and fuel prices many studies of fuel price elasticities: Epsey (1996): SR -0.26, LR (for the US); Lipow (2008): SR -0.17, LR -0.4; Glaister and Graham (2002): SR -0.2 to -0.3, LR -0.6 to -0.8; values depend on time period and location considered North American fuel price elasticities declined during the last quarter of the 20 th century vehicle travel doesn t fall as much as fuel consumption as more fuel efficient cars are purchased

18 Elasticity Evidence: VTI Study Canadian Evidence: Boilard (2010)
19 Changing Canadian Elasticities possible reasons for movements in elasticities: higher per capita vehicle ownership; increased female labour force participation; peak of Baby Boom driving years; real incomes that have grown while real fuel prices have declined (fuel prices a lower share of budgets) highway expansion; urban sprawl
20 Elasticity Evidence: VTI Study Other Empirical Findings Li et al (2011) fuel tax increases (long-lasting) have a bigger impact than oil price fluctuations (temporary); scope for price-based policies to be effective (?) In general, elasticities measured recently (past decade) have been higher than those from previous studies
21 VTI Study: Fuel Prices and Travel Cross-Sectional Evidence
22 VTI Study: Fuel Prices and Travel Time Series Evidence
23 Travel Elasticity Evidence: VTI Study long term elasticity averages around -3 many studies of travel elasticities: Small and van Dender (2007): values decline with income and over time 1966 to 2001, SR , LR -0.22; for more recent years, SR , LR -0.12; Gillingham (2010) based on California odometer readings medium run elasticities of to -0.2 depends on vehicle type and location multi-vehicle families may respond to price increases by shifting their driving towards their more fuel-efficient cars rural drivers and those using pick-up trucks for work have lower elasticities (fewer alternatives available)
24 Rebound Effects: VTI Study increase in vehicle travel in response to driving a car with better fuel economy and/or availability of less expensive alternative fuels (biofuels, electricity). lower costs per mile can drive more on a given travel budget this adds benefits for consumers (as they get utility from the driving) this imposes external costs (as the extra driving increases congestion, pollution, risk of accidents
25 Factors that could change elasticities and rebounds aging population: lower commuting needs, lower incomes slower growth of real incomes and rising fuel costs may make fuel a more important portion of the household budget improved urban travel options (bike paths, public transit) changing preferences (possibly related to health and environmental concerns)
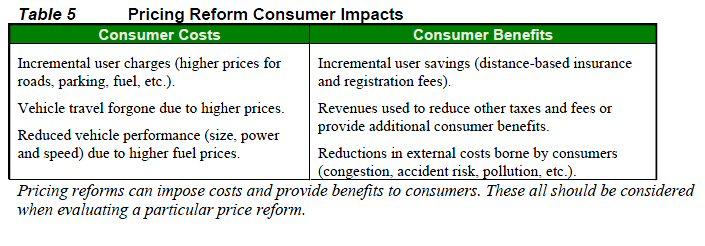
26 Policy Implications: VTI
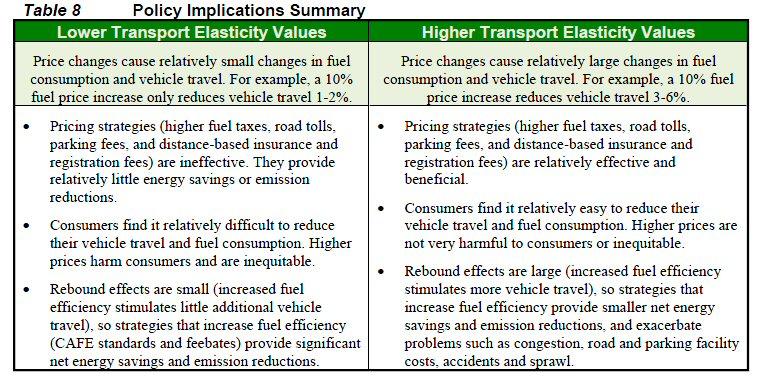
27 Policy Implications: VTI