G8 Summit Symposium (June, 24) Drastic Change in the Earth System
|
|
|
- Theodore Warren
- 5 years ago
- Views:
Transcription
1 G8 Summit Symposium (June, 24) Drastic Change in the Earth System during Global Warming Call for questions 1. Clarify causes and magnitude of sea level lrise (J. Church, M. Ikeda) 2D 2. Decay of glaciers and dgreenland and dantarctic ice sheets (A. Ohmura, R. Greve) 3. When will summer Arctic sea ice disappear? (W. Maslowski, M. Ikeda) 4C 4. Carbon uptake or emission i by terrestrial ilecosystem (T. Maximov, A. Itoh, T. Hara) 5M 5. Marine ecosystem change resulting li in carbon emission i (M. Kawamiya, Y. Watanabe)
2 Agenda Global warming is a real and crucial phenomenon. (Nobel Peace Prize awarded to IPCC and Al Gore) Do we well know about global warming? Uncertainty larger than 50 % on the warming rate Scientific clarification required on some issues and mechanisms which yield positive feedback in the earth system. Call for question in prior to the symposium Extensive discussion i on the selected dissues Summarize the outcome for non-scientists
3 0. General Introduction
4 Global warming in the 21st Century could be 1 to 6 Uncertainty in mechanism Fig.0-1 IPCC Report
5 Warming predicted by models (IPCC) Fig.0-2
6 More rain or less rain? (IPCC Report) Fig.0-3
7 1. Sea Level Rise
8 Clarify causes and magnitude of sea level rise Most future scenarios provide only 300mm rise in the 21st century, and the highest predicted rise is 500mm. The thermosteric component related to oceanic thermal expansion is large in , but much smaller in Mountain glaciers contribute to rise comparable with the thermal expansion. A possible cause of the difference may be explained by inaccurate deep ocean data and also could be consequence of underestimation of ice sheet melting in Greenland and Antarctica.
9 Future sea level rise Thermal expansion is a major cause. Fig.1-1
10 Sea level rise in last 13 years Thermal expansion Fig.1-2


11 Sea level rise in last 50 years Thermal expansion Mountain glaciers Fig.1-3 Is the difference related to glaciers? But, it is not so large. What about inaccurate deep ocean data? If it comes from melting of Greenland and dantarctic ice sheet, a future impact will be crucial. National Snow and Ice Data Center
12 1500 Mountain glacier mass balance (Ohmura)/melting is consistent. Global area-weighted mass balan 1000 winter y = x annual y = x mmm WE/a summer y = x / / / / / / / / / / / / / / / / / / / / / / / / / / / / / / / / / / / / / / / /05 Fig.1-4
13 2. Ice Sheet and Glaciers
14 Background Sea level rise in the 21 st century is predicted to be mainly caused by thermal expansion of sea water and the melting of glaciers and small ice caps. ~ 0.5 m sea-level equivalent However, surprisingly rapid decay of the large ice sheets (Greenland, Antarctica) has been detected recently, in conjunction with a general speed-up of ice streams and outlet glaciers (ice dynamics!). ~ 7.2 m sea-level equivalent ~ 61 m sea-level equivalent


 New results from satellite")

15 Recent changes of the Greenland ice sheet Interior ice sheet: on average in balance, some regions of local thickening or thinning. Marginal areas: thinning predominant. Fig.2-1 Source: Witze (2008) Overall mass balance negative: 50 to 90 km 3 /a, corresponding to a sea-level contribution of 0.15 to 0.25 mm/a. (Ohmura, 2004) New results from satellite gravity mea- surements indicate 239 ± 23 km 3 /a for the period (sea-level contribution 0.66 ± 0.06 mm/a). (Chen et al., 2006)
 West Antarctic Ice Sheet East Antarctic Ice Sheet New results from satellite gravity measurements indicate 152 ± 80 km 3 /a for the period 2002 2005 (sea-level contribution 0.42 ± 0.22 mm/a).")
16 Recent changes of the Antarctic ice sheet The Third Assessment Report (TAR) of the IPCC lists an overall mass balance of 376 ± 384 km 3 /a (sea-level contribution 1.04 ± 1.06 mm/a). (Church et al., 2001) West Antarctic Ice Sheet East Antarctic Ice Sheet New results from satellite gravity measurements indicate 152 ± 80 km 3 /a for the period (sea-level contribution 0.42 ± 0.22 mm/a). (Velicogna and Wahr, 2006) Main contribution seems to be from West Antarctica. Fig.2-2
17 Simulation results for Greenland Model time: t = 1990 CE (present) CE. Climatic forcing: WRE1000 scenario (future stabilization of atmospheric CO 2 at 1000 ppm). Year CE Ice flow: Set-up #1 slow basal sliding + internal deformation. Set-up #2 basal sliding accelerated by surface meltwater + internal deformation. Fig.2-3 (Greve and Otsu, 2007)


18 Simulation results for Greenland Surface velocity differs greatly for the two set-ups! 2100 CE, set-up #1: 2100 CE, set-up #2: Fig.2-4
19 Simulation results for Greenland Contribution to sea-level rise 2100 CE 2200 CE 2300 CE Set-up # m 0.55 m 1.21 m Set-up # m 1.51 m 2.71 m And there is also Antarctica Large uncertainties due to ice dynamics IPCC AR4 (Fourth Assessment Report) sea-level ( p ) predictions for the 21 st century may be significantly too small!
20 3. Arctic Sea Ice
21 When will summer Arctic sea ice disappear? IPCC Report presents the future prediction that the ice cover in summer will become minimal near the end of the 21st century. The anomalously small ice cover in 2007 summer strikingly hit some specialists so that they may believe disappearance by On the basis of significant year-to-year variability, such an early disappearance might htbe exaggeration. The anomalously high winds off Siberia occurred in If this continues, a rapid ice retreat will occur. A reliable coupled atmosphere-ice-ocean model is required.


22 Observed ice cover concentration Ice reduction is significant in last 30 years , Sep , Sep Fig.3-1


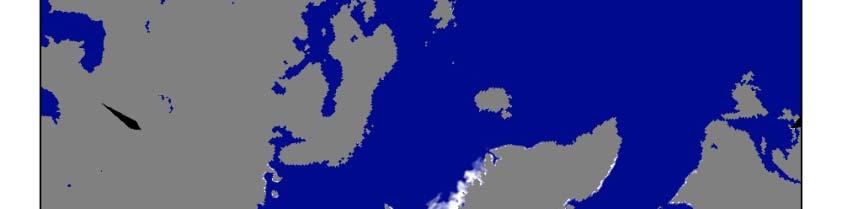


23 This HP gives a misled impression, under the fact of significant interannual variability If this decrease rate continues, the ice cover in this summer will possibly reach the IPCC prediction for Fig
24 2nd EOF of sea level pressure Wind pushes sea ice from Bering to Greenland Sea. Wu et al. (2005) If this EOF mode continues to be positive in future, p, sea ice would be pushed out and low in the Pacific sector. Fig.3-3
25 Observed Arctic sea ice melt faster than forecasts! IPCC AR4 simulations of Arctic ice extent decline are too conservative! SSM/I period Fig.3-4 Stroeve et al., 2007
26 79-04 time series of Ice Extent, Area, Volume, Thickness from NPS model Between : - annual mean sea ice extent and concentration has decreased d by ~17% - mean ice thickness has decreased by ~36% Fig ice volume decreased by 40%, which is >2x the rate of ice area decrease If this trend persists the Arctic Ocean will become ice-free by 2015 (±2yrs) 2yrs)!
27 4. Terrestrial Ecosystem
28 Carbon uptake or emission by terrestrial ecosystem Terrestrial ecosystem will absorb more carbon until mid-21st century. The uptake will reduce then, but it is so variable among the future prediction models. More careful studies are needed to estimate responses of boreal forests to temperature rise. The uncertain components are responses to drought and carbon emission i from soil such as peat tland.
29 N t E t P d ti i i di ti d l Net Ecosystem Production in various prediction models Fig.4-1
30 Uncertainties about carbon uptake or emission are caused by the following unknown ecophysiological mechanisms or processes leaf phenology: flush development fall foliage profile: coniferous vs. broad-leaved trees root biomass and respiration: the hidden half role of understorey vegetation in a forest flowering and seed production: forest regeneration mortality of juvenile trees: forest regeneration etc.
31 Leaf Phenology: flush development fall many models so far have used empirical functions of air temperature to describe leaf phenology only air temperature OK? photo-oxidative stress, which is intensified by high light, low temperature and drought stresses, withers leaves we assume that photo-oxidative stress governs leaf phenology not only temperature but also solar radiation and precipitation should be considered! d!
32 forest leaf area Global Warming and Leaf Phenology Jan. flush fall Dec. Present Climate forest leaf area Jan. flush? weak photo-stress in spring? Dec. Global Warming fall? weak photo-stress in autumn? under global warming, leaf area duration and hence carbon uptake increase? if precipitation decreases (drought stress) strong photo-oxidative stress can occur if precipitation decreases (drought stress), strong photo oxidative stress can occur even under global warming, and leaf area duration and carbon uptake may not increase uncertainty Fig.4-2
33 Larix Deciduous Forest: simulation study Toda et al. (2007) 2 X CO 2, T air + 1~5 carbon uptake increases 2 X CO 2, T air + 6~10 carbon uptake decreases what about the effects of precipitation and solar radiation? uncertainty Fig.4-3
34 5. Marine Ecosystem
35 Marine ecosystem change resulting in carbon emission In future prediction models, oceanic uptake is so stable with minor feedback from the climate change. Although warming effects may be minor on solubility, the subpolar regions with high primary production will shrink significantly. In addition, replacement of dominant plankton species will change the ocean from sink to source. Uncertain mechanisms have to be clarified and quantified as soon as possible.
36 What factors determines the Earth s natural and anthropogenic changes? How exactly can we reconstruct/predict these changes? The future prediction is more successfull with anthropogenic impacts IPCC Climate Change 2007 Fig.5-1
37 Sensitivity for carbon uptake or emission by ocean/terrestrial ecosystem Ocean responses are so stable. Without climate-ecosystem feedback With climate-ecosystem ecosystem feedback Fig.5-2 C4MIP Report


38 Two examples of marine ecosystem respond to this climate change? confirmed Phytoplankton reduction caused by global warming Northwest Pacific Ocean bio-geochemical-physical model North Pacific Ocean observations in 1990 s under investigation Plankton species change reduces alkalinity and CO2 is emitted Fig.5-3

39 What kinds of feedback effects should we consider? e.g., the following changes responded to global warming, but are not fully considered ed yet: aerosol input, marine ecosystem, DMS, N2O, ph and N/P ratio, etc. Fig.5-4 IPCC Climate Change 2007