Baltic Marine Environment Protection Commission
|
|
|
- Tamsin Austin
- 6 years ago
- Views:
Transcription

1 Baltic Marine Environment Protection Commission Heads of Delegation Brussels, Belgium, June 2017 HOD Document title Draft HELCOM Maritime Assessment Code 2-15 Category INF Agenda Item 2 - Next HELCOM Ministerial Meeting Submission date Submitted by Executive Secretary Reference Background The HELCOM Contracting Parties agreed as part of the 2013 HELCOM Ministerial Declaration to comprehensively assess the status, environmental risks and opportunities of maritime activities in the Baltic Sea region within HELCOM by A draft of the HELCOM Maritime Assessment publication is attached to this document. The draft chapters 1-12 as well as were submitted on 3 May 2017 to the Heads of Delegation and Maritime, Response and Fish working groups as well as their sub-groups. The comments received have been incorporated in the attached file. The draft chapters as well as will be submitted to the Heads of Delegation, Maritime, Response and Fish working groups as well as their sub-groups on 15 June 2017 with a commenting deadline by 28 June 2017 (maritime.response@helcom.fi). The aim is that the comments received by the deadline, as well as the missing summary, will be incorporated in a final version in terms of substance by the beginning of July This version will be circulated to the Heads of Delegation for publishing approval by correspondence. The approved file will be still proofread as well as will undergo layout before final release aimed for the beginning of September Action requested The Meeting is invited to take note of the information and agree on the proposed approval procedure for the Maritime assessment. Page 1 of 1
2 2017 HELCOM ASSESSMENT ON MARITIME ACTIVITIES IN THE BALTIC SEA [DRAFT ] Table of contents: SUMMARY... 3 INTRODUCTION SHIP TRAFFIC IN THE BALTIC SEA SHIPS EMISSIONS TO AIR IN THE BALTIC SEA SHIPS SEWAGE IN THE BALTIC SEA OPERATIONAL OIL DISCHARGES FROM SHIPS OPERATIONAL DISCHARGES OF CHEMICALS SHIPS BALLAST WATER IN THE BALTIC SEA MARINE LITTER FROM SHIP BASED SOURCES UNDERWATER NOISE FROM SHIP BASED SOURCES ANTI FOULING SYSTEMS MARITIME ACCIDENTS IN THE BALTIC SEA MEASURES TO IMPROVE SAFETY OF NAVIGATION IN THE BALTIC SEA PREPAREDNESS AND RESPONSE CAPACITY IN THE BALTIC SEA FISHING ACTIVITY IN THE BALTIC SEA
3 14. AQUACULTURE IN THE BALTIC SEA OFFSHORE WINDFARMS IN THE BALTIC SEA REGION UNDERWATER CABLES AND PIPELINES OFFSHORE OIL AND GAS IN THE BALTIC SEA SUBMERGED HAZARDOUS OBJECTS IN THE BALTIC SEA LEISURE BOATING IN THE BALTIC SEA FUTURE TRENDS IN MARITIME TRAFFIC ANNEX 1 DRAFT METHODOLOGY TO CREATE STATISTICS AND DENSITY MAPS FROM AIS DATA ANNEX 2 MAPPING FISHING ACTIVITIES IN THE BALTIC SEA USING AIS DATA ANNEX 3: CHAIRS OF MAIN HELCOM MARITIME, RESPONSE AND FISH GROUPS TIMELINE OF HELCOM WORK IN THE FIELDS OF MARITIME, RESPONSE AND FISH 210 2
4 Summary [to be added] 3
5 Introduction This HELCOM Maritime Assessment 2017 presents to the reader an overview of the main maritime activities in the Baltic Sea as well as the main environmental issues related to these activities. Besides being a compilation of the available region-wide knowledge on the covered activities the publication aims to enable the HELCOM Contracting Parties (Denmark, Estonia, European Union, Finland, Germany, Latvia, Lithuania, Poland, Russian Federation and Sweden) to demonstrate achieved results of past cooperation around maritime activities and the Baltic Sea marine environment. It is hopefully also useful as material when planning future HELCOM work which continues to evolve and re-invent itself. Maritime activities in the Baltic Sea is a wide topic and includes subjects such as maritime transportation, both in terms of environmental regulation and safety of navigation, but also fishing, aquaculture, oil & gas exploitation, offshore wind, cables and pipelines, leisure boating as well as submerged hazards such as dumped munitions and polluting wrecks. Due to the large number of topics covered it is clear that the format has to be concise and for this reason involved subjective decisions on what to present and what not. A large part of the publication focuses on maritime transportation and ship movements in general. This is partly a result of the fact that this is arguably the most common maritime activity in the Baltic Sea region. In order to provide a starting point the Chapter 1 describes the general patterns of ship traffic in the Baltic Sea during the period Preventing and mitigating operational ship based pollution described in Chapters 2-10 has been the task of the HELCOM maritime working group since the 1970s. Even if focus is on developments during the last ten years, these chapters document also the significant progress made within the region in this field during the last few decades. Significant developments in environmentally friendly shipping have been achieved by an innovative form of regional maritime cooperation, closely linked with the global discussions at IMO. In these processes industry and civil society participants have had an increasingly important role, in addition to the coastal states and the EU. Particularly in addressing operational ship pollution of oil, exhaust gas emissions and sewage the Baltic Sea coastal countries have truly been at the global forefront. With these topics the regional HELCOM cooperation has truly demonstrated its capacity to keep focus and achieve results requiring decades of persistent efforts. New issues are added to the work programmes as they are detected. Also in the fields of response capacity to spills (Chapter 12) and preventing such spills by measures in the field of safety of navigation (Chapters 10 and 11) the Baltic Sea reached a high level early on and has continued to be a global pioneer. This can be demonstrated by the regional developments in fields such as response on the shore, oiled wildlife response as well as risk assessments, re-surveys, routeing measures but also the emerging field of e-navigation. The environmental effects of fishing and aquaculture presented in Chapters 13 & 14 are two examples of maritime activities where HELCOM work has intensified with the implementation of the ecosystem based approach, in line with global calls for a more holistic approach to regional seas governance. The remaining described activities are due to various reasons less at the focus of regional discussions. Offshore wind power developments (Chapter 14) and underwater pipelines and cables (Chapter 15) are examples of topics which have caught the attention of the Contracting Parties fairly recently, in the wake of intensifying development interests in these fields. In the remaining covered issues, offshore oil and gas 4
6 (Chapter 17), submerged hazardous objects (Chapter 18) and leisure boating (Chapter 19) there is a long track record of regional work which continues to take new forms. The last Chapter 20 presents for completeness a number of future scenarios around maritime traffic in the Baltic Sea. Data sources The main source and inspiration of the presented material is the regular regional cooperation within working groups. National data submissions to HELCOM are used as a key source but as regular data collection is not carried out for many of the topics presented also other available sources have been used. A central feature of this publication, particularly visible in the case of the maritime traffic related chapters, is the extensive use of the regional HELCOM AIS ship movement data. This unique long term dataset covering the period since has been generated by the regional AIS network, overseen by the HELCOM AIS Expert Working Group. This dataset has been central in many of the policy processes described in the chapters 1-11 but is also potentially useful in many other issues. Methodologies used for the AIS based maps presented in different chapters are provided as Annexes 1 (ship movements) & 2 (fishing). Annex 3 provides a list of the Chairs of the HELCOM Maritime, Response and Fish. 5
 ships in the Baltic Sea (cf. Figure. 1.")
7 01. SHIP TRAFFIC IN THE BALTIC SEA Introduction Based on HELCOM AIS data from 2006 to 2016, this chapter provides an overview of ship traffic in the Baltic Sea with focus on the main types Cargo, tanker, passenger and container ships which account for 80% of the traffic of the larger (IMO) ships in the Baltic Sea (cf. Figure. 1.1). Figure. 1.1 In this publication we use the ship categories in Table 1.1. The following pages include short descriptions of the main categories including illustrations of typical ships of the category sailing the Baltic Sea in 2016 with average length and Gross Tonnage. Table 1.1: 6

8 Ship categories CARGO Cargo ships move cargo, goods or material from one port to another. Cargo ships can be divided into three sub-categories: general, bulk and other cargo. Cargo ships are the most numerous ships at sea. LENGTH: average 134 meters (min 22 m max 292 m) GROSS TONNAGE: average 6990 GT (min 104 GT max GT) TANKER Tanker ships are transporting liquid or gases in bulk. There are different sub-categories such as chemical tanker (carrying hazardous substances), crude oil tanker, gas tanker, oil product tanker and other types of tanker. These ships usually have a double hull to protect the cargo in case of collision or groundings. LENGTH: average 164 meters (min 25 max 333 m) GROSS TONNAGE: average GT (min 107 max GT) PASSENGER A passenger ship is the one transporting more than 12 passengers. Passenger ships can be ferries that operate day to day or overnight short-sea trips moving passengers and vehicles, RoPax (roll-on/roll-off passenger) that transport freight vehicle transport along with passengers, and cruise ships that are operating from May to October and most of them coming from outside the Baltic Sea Region. LENGTH: average 110 meters (min 20 max 330 m) GROSS TONNAGE: average GT (min 101 max GT) FISHING Fishing vessels are smaller than the other categories but the interior volume is always more than 100 GT. The largest ones are trawlers. LENGTH: average 33 meters 7
9 (min X max X m) GROSS TONNAGE: average 993 GT (min 102 max GT) SERVICE Service ships are mostly supporting diving activities, research or the maintenance of structures at sea such as windfarms, underwater cables and oil rigs. LENGHT: average 59 meters (min X max X m) GROSS TONNAGE: average GT (min 100 max GT) CONTAINER Container ships carry their entire load in truck-size intermodal containers. They are known to be the biggest ships operating in the Baltic Sea Region. LENGHT: average 190 meters (min 95 max 399 m) GROSS TONNAGE: average GT (min max GT) RO-RO CARGO Ro-ro cargo (roll-on/roll-off) are ships designed to transport wheeled cargo such as cars, trucks, semi-trailer trucks, trailers, and railroad cars, that are driven on and off the ship on their own wheels or using a platform vehicle. Ro-ro cargo can be divided into vehicle carrier, specialized to carry vehicles, or general roro cargo. LENGHT: average 173 meters (min 63 max 262 m) GROSS TONNAGE: average GT (min 957 max GT) OTHER This category includes smaller vessels such as dredgers, tugs (ships supporting other vessels), yachts and other less common types of vessels. The largest sailing ships (usually sail training vessels) are IMO ships and are included in this category, but not the small leisure sailing boats. LENGHT: average 47 meters (min 13 max 269 m) GROSS TONNAGE: average GT (min 35 max GT) [SCALE] All the ships on the page are shown in the same scale. A pine tree, an 8 story high flat building and a city bus look quite small when placed right beside of the front of a passenger ship. Overview of ship traffic in the Baltic Sea Port visits There were almost 1 million visits to the ports of the Baltic Sea Region in 2016, defined as entering and exiting a port with at least 10 minutes spent inside in the port (cf. Figure 1.2). 8
 where visits done by passenger ships, largely due to the regular ferry connections between cities in the region such as Helsingborg and Helsingör, Tallinn and Helsinki, Helsinki")
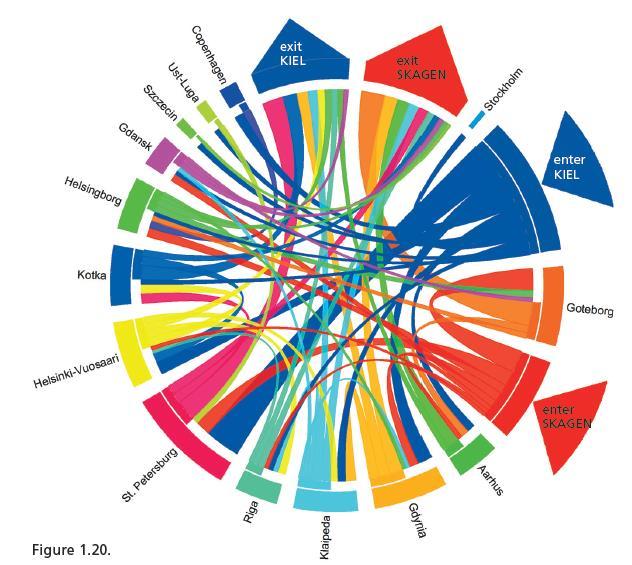
10 Figure 1.2 Almost half (46%) where visits done by passenger ships, largely due to the regular ferry connections between cities in the region such as Helsingborg and Helsingör, Tallinn and Helsinki, Helsinki and Stockholm. Many visits are also a result of traffic in the category Other -which includes smaller vessels which do short operations and return to port. A pilot boat or a tug, ships that manoeuvres bigger vessels by pushing or towing them, is an example of boat included in this category. Only one third of the port visits were done by ships transporting goods -either cargo, container or tanker ships. The traffic patterns between different ports can be illustrated with a chord diagram (Figure 1.3). It shows the 50 biggest ports with most (more than 1000) visits in the Baltic. This includes also the following pathways for entering and exiting the Baltic Sea: Skagen area (Kattegat). Kiel Canal, a 100 km waterway which links the North Sea with the Baltic that is used to save time and to avoid storm-prone seas. Mouth of Neva River: river in north western Russia flowing from Lake Ladoga. Lappeenranta: Finnish city close to the Saimaa canal which connects the Saimaa Lake to the Gulf of Finland. In the diagram the width of the segment is proportional to the number of visits, or entering and exiting the Baltic Sea in
 go mainly to St. Petersburg, Gothenburg and to the Ust-Luga port.")
11 Figure 1.3: Interaction between ports, arrivals and departures in the Baltic Sea. All ship types traffic in 2016: 50 biggest ports, minimum of trips between the locations. Ships that enter the Baltic Sea through the Skagen area (between Sweden and Denmark) go mainly to St. Petersburg, Gothenburg and to the Ust-Luga port. 1 Distance The distance sailed in km seems to be rather stable in all ship types since Most of the kilometres sailed in the Baltic Sea are done by ships in the cargo category. Both container and tanker ships have slightly decreased the number of km sailed over the recent years (Figure 1.4). 1 A small amount of ships that enter the Baltic Sea through Skagen seem to exit without stopping. The possible reason is that those ships stop at an anchoring site and are therefore not yet registered in the figures presented here. 10

12 Figure 1.4: distance sailed per shiptype Some seasonal variation is visible. Approximately from January to March the sea freezes in some parts of the Baltic Sea which presents challenges to marine traffic. In some case ships have to deviate routes as there can be solid ice that cannot be tackled by icebreakers. Passenger ships are most affected by ice but cargo is also clearly affected. Fishing vessels, on the contrary, seem to increase their activity during winter. Number of ships Roughly half of the IMO ships travelling the Baltic Sea (47%) are ships in the category cargo - general cargo ships (Figure 1.5). 11

13 Fig. 1.5: Number of IMO ships traveling in the Baltic Sea in 2016 The number of ships seem to be increasing in all ship types from However, this can be due to the fact that more ships carry AIS transmitters. The technology has become more affordable and due to its usefulness in collision avoidance attractive also for those ships that are not obliged by IMO to carry an AIS device. The number of tugs and other smaller vessels, included in the category Other, not obliged to carry AIS, has particularly increased during the last years (Figure 1.6). 12
14 Fig. 1.6: Number of IMO ships in the Baltic Sea since 2006 Size The biggest ships in the Baltic Sea are clearly getting bigger. In 2006 there were 115 ships that were over GT whereas in 2016 there were 203 this represents an 76,5% increase over 10 years (Figure 1.7) Tankers and containers are the ships that are getting significantly bigger since Passenger ships have also increased their size but not as dramatically as the previous ones. The size of general cargo ships and Service vessels have remained stable (Figure 1.8). 13
15 Figure 1.8: Number of ships with Gross Tonnage over GT operating in the Baltic Sea. Flags Only 25% of the ships in the Baltic Sea in 2016 fly a flag belonging to Baltic Sea countries. This is a normal practice called flag of convenience: registering a merchant ship in a sovereign state different from that of the ship s owners and flying that state civil ensign on the ship. Ships are registered under flag of convenience to reduce taxes, operating costs or to avoid regulations on the owner s country (Figure 1.9). 14
16 Figure 1.9: the top 30 IMO ship flags since between 2006 and 2016 In fact, the first one third of the total number of ships (more than 2.000) fly a flag different form a Baltic Sea country: Netherlands, Marshall Islands, Liberia and Antigua and Barbuda. Ship types This is a detail overview of the four ship types that sail the most the Baltic Sea: cargo, passenger, tanker and container Cargo Cargo ships are the most numerous ships in the Baltic Sea almost every second IMO ship is a cargo ship. They spend 3 million hours and sail nearly 42 million kilometers on the surface of the Baltic Sea every year. That is over one third of the time and distance IMO ships sail in total (Figure 1.10). 15


17 Figure 1.10 The figure 1.11 shows the traffic of cargo ships between the 50 biggest ports with more than 1000 visits in the Baltic, including entrances and exit routes. Cargo ship visits decreased in most of the ports between 2006 and (Figure 1.12). 16

18 Figure 1.12 A large share of general cargo traffic between the larger Baltic Sea ports is to or from a port outside the Baltic. This is why the number of port visits in this category is only 14% of all port visits, despite the large number of cargo ships. Most of the cargo ships enter through Skagen and go to St. Petersburg, Klaipeda, Riga and other ports. Lots of cargo ships enter also through Kiel Canal and go to Szczecin, Rostock, Gdansk and other ports. The ports mentioned are the biggest ports in the Baltic Sea for general cargo ship. (Figure 1.11) 17

19 However, if all the traffic is considered (also smaller ports, not shown in the figure) 72% of trips are inside the Baltic Sea and 28% is to or from outside the Baltic. Tanker Tanker ships are transporting liquid or gases in bulk and a relatively common type as every fifth IMO ship in the Baltic Sea is a tanker. They spend almost 1,5 million hours and sail over 20 million kilometers in the Baltic Sea every year. That is nearly one fifth of the time and distance IMO ships sail in total. (Fig. 1.4) The figure 1.14 shows the traffic of tanker ships between the 50 biggest ports with more than 100 visits in the Baltic, including entrances and exit routes. Tanker traffic between the larger ports in the Baltic Sea are to or from a port outside the region, between Skagen and Gothenburg, Ust-Luga, Primorski, Kilpilahti and other larger ports. However, if smaller ports are also considered (not shown in the figure 1.14) 77% of trips are inside the Baltic Sea and 23% is to or from outside the Baltic. 18
 but due to the fact that ferries do many trips, sometimes several trips a day they spend almost 1,4 million hours and sail over 20 million kilometers in the Baltic Sea every year.")
20 Figure 1.15 Passenger Only 5% of the IMO ships in the Baltic Sea are passenger ships (figure 1.16) but due to the fact that ferries do many trips, sometimes several trips a day they spend almost 1,4 million hours and sail over 20 million kilometers in the Baltic Sea every year. That is nearly one fifth of the time and distance IMO ships sail in total. (Fig. 1.4) 19


21 Figure 1.16 As most of the passenger traffic is the result of ferries they are inside the Baltic Sea. During summertime cruise ships increase passenger traffic. 20

22 Figure 1.18 Container The eleven biggest container ports (over 300 port visits) are Helsinki-Vuosaari, Kotka, Hamina, St. Petersburg, Riga, Klaipeda, Gdansk, Gdynia, Helsingborg, Gothengurg and Aarhus. As with other types of ships transporting goods, the larger ports have a big share of traffic to or from outside the Baltic. Smaller ports have in proportion a lot more intra Baltic container traffic. 21

23 Figure

24 Figure
25 02. SHIPS EMISSIONS TO AIR IN THE BALTIC SEA Introduction Emissions to air, including exhaust gases and particulate matter is a central form of pollution from ships in the Baltic Sea region as elsewhere. Exhaust gases from ships have increasingly become also an issue of public interest as they have been documented to have both environmental and human health effects (Brandt et al., 2013; Corbett et al., 2007; Jonson et al., 2015; Liu et al., 2016; Raudsepp et al., 2013), and as sources on land have been increasingly regulated. Use of fossil fuels also contributes to the increase of greenhouse gases in the atmosphere. Even if exhaust gases is the main form of aerial pollution from ships, also other airborne pollution exists such as waste incineration smoke, volatile organic compounds (VOC) from liquid cargo handling and ozone depleting substances from cooling devices. Since 1970s, ships equipped with an internal combustion engine burning diesel or fuel oil as their prime mover have dominated the world fleet including ships operating in the Baltic Sea. Even if other fuel alternatives such as Liquid Natural Gas (LNG) are emerging, the overwhelming majority of ships today use diesel oil or heavy fuel oil as fuel due to operating simplicity, robustness and fuel economy. Exhaust emissions from these marine diesel engines comprise, beside harmless nitrogen (N 2, ca.3/4), oxygen (O 2, ca. 1/10) and water vapour (ca. 1/20) but also carbon dioxide (CO 2, ca. 1/20) and smaller amounts of carbon monoxide (CO), sulphur oxides (SOx), nitrogen oxides (NOx), hydrocarbons, and smoke including particulates which are related to various environmental and human health concerns. The main focus of the work in the Baltic Sea region so far has been to reduce exhaust gas emissions of SOx, causing human health effects and acidification of environment on land, and during 2000s also NOx, contributing to the nutrient pollution of the Baltic Sea and similar fertilization effects on land, as well as human health effects. Even if exhaust gas emissions from ships contributes to global warming (e.g. CO2 and particulate black carbon ) mitigation of this issue is negotiated globally and have not been considered regionally so far. As a response to the public and scientific concern, relatively drastic regulatory decisions have been taken in recent decades to reduce airborne emissions from ships in the region. Fuel sulphur content has been reduced three times and the Baltic Sea was the first SOx Emission Control Area starting from May Stepwise reduction of maximum allowable sulphur content has led to dramatic decreases of SOx emissions from ships. Reduction of exhaust gas pollution can be achieved by exhaust gas cleaning, cleaner fuels (e.g. higher grade oil distillates, biofuel, LNG, methane. Emissions can also be reduced by new propulsion technologies such as fuel cells, where hydrogen can be used as fuel, or auxiliary wind devices and to a lesser extent operational efficiency including slow steaming -or a combination of such measures. When in port properly equipped ships can also use onshore power supply ( cold ironing ) to avoid using engines and thus comply with the requirements. As existing ships have to comply with the requirements to reduce SOx emissions, shipowners have usually chosen to either comply by using fuel oil with very low sulphur content or to retrofit an exhaust gas cleaning system ( scrubber ) targeting to the required SOx reduction level. Reducing NOx emissions is perhaps a more complicated matter from the shipowner point of view, because using higher grade fuel alone does not reduce NOx emissions. NOx reductions to the required ( Tier III ) 24

26 level may require equipment like installation of a catalysator, exhaust gas recirculation system or the use of completely new engine types and/or fuels. Even if ships can reduce both SOx and NOx emissions by introducing completely new fuel types, such as LNG, bio-fuels or comparable, technology is very costly to install on existing vessels. Such technologies are more frequently taken into use on new builds. Due to this international regulation of the NOx emissions from shipping covers new ships built after the entry into force date of the regulation. Due to this need of fleet renewal there is a practical time lag of years in mainstreaming green ship technologies, which is also the delay before the full benefits of emission reduction actions can be expected. Estimations of pollution load from ships exhaust gases The Finnish Meteorological institute has, by models using AIS data and ship data (Jalkanen et al., 2009, 2012; Johansson et al., 2013), estimated monthly emissions of exhaust gases from ships operating in the Baltic Sea for certain pollutants (REF) (see Figure 2.1). Besides illustrating the developments over time, these available time series of NOx, SOx, CO 2 and PM2.5 (particulate matter) emissions can be used to estimate the contribution of exhaust gases from Baltic Sea shipping to the pollution ending up in the Baltic Sea mainly via direct deposition to the sea surface. Figure 2.1 Transport work and emissions from Baltic Sea shipping during , HELCOM Baltic Sea Environment Fact Sheet 2016, Published in September Besides emissions from the Baltic Sea shipping also a large share of the emissions from the North Sea and the North East Atlantic shipping ends up in the Baltic Sea due to the prevailing westerly winds. Less information is available of the emissions of other ship sources including incineration. 25
27 SOx Ship traffic is currently the only transport sector with a significant level of SOx emissions in the Baltic Sea region (REF UNECE CLRTAP) (Figure 2.2). Due to the implementation of new regulations these emissions of SOx from Baltic Sea shipping have dropped drastically during the period SOx emissions from exhaust gases of Baltic Sea shipping are currently in the order of 10 kt annually, while in 2005 only ten years earlier they were fourteen times higher, in the order of 140 kt. In other words SOx emissions from Baltic Sea shipping have reduced by 130 kt over the last ten years, or over 70% from 2005 emission levels. Figure 2.2 NOx the annual emissions of NOx to air from ships in the Baltic Sea has been relatively stable, around kt per year (Figure 2.2). Out of these emissions in the order of 19 kt of NOx ends up today in the Baltic Sea annually as direct deposition to the sea surface ( Jonson et al., 2015) which can be compared with the 115 kt total atmospheric deposition of nitrogen to the sea from all sources. An additional 40 kt of NOx ends up not on the sea but on land in the drainage area of the Baltic Sea. As the NOx related processes on land are very complex it is difficult to estimate if any of the 40 kt deposited to land end up in the Baltic Sea. The remaining 300 kt emitted is carried outside the drainage area by winds. The Baltic Sea was designated as a NOx emission control area (NECA) in parallel to a similar designation for the North Sea in 2016 and will enter into force for new ships on 1 January According to recent estimates by the European Monitoring and Evaluation Programme (EMEP), compared to a non-neca scenario, the reduction in annual total nitrogen deposition to the Baltic Sea region achieved by these 26
28 regulations will be in the order of 22 kt by 2030s as a combined effect of the Baltic and North Seas NECAs (Jonson et al., 2015). Out of this total anticipated reduction in nitrogen deposition, 7 kt is estimated to be reduced from direct deposition to the Baltic Sea surface and the remaining 15 kt is estimated to be decrease from deposition to the terrestrial areas draining to Baltic Sea. However, as the NECA regulations target only new ships, a lengthy two-decade long period of fleet renewal is needed before the regulation will show this effect. PM2.5 Particulate matter (PM) is a generic term for a broad class of chemically and physically diverse substances. It can be principally characterized as discrete particles that exist in the condensed (liquid or solid) phase spanning several orders of magnitude in size. PM2.5 refers to one size class of relatively fine particles, less than or equal to 2.5 micrometers (μm) in aerodynamic diameter, which also indicates the level of other PM size classes. Sulphur in fuel contributes to particle formation because sulphuric acid is one of the key constituents to PM mass. The SOx regulations have reduced the annual emissions of PM2.5 from ships in the Baltic Sea by 50% over the last ten years to 10 kt. Nitrogen will also contribute to PM formation, even if nitrate is not a direct combustion product but formed in the atmospheric processes. The foreseen measures for NOx emission reduction will decrease the atmospheric concentrations of particulate matter. Particulate matter including PM2.5 is not directly an environmental issue and more related to human health as it causes damage to the respiratory system and has been characterized as carcinogenic by WHO. However, on snow and ice black cabon, which is a part of particulate matter, reduces backscatter of light energy to the atmosphere and thus increases global warming. CO2 During the last ten years CO 2 emissions from Baltic Sea shipping have remained relatively stable at kt annually while maritime transport of goods has increased 23% during the same period. Indirectly it can thus be argued that shipping has become more climate friendly per transported unit. The Baltic Sea fleet is responsible for about 2% of the global shipping GHG emissions. Ships exhaust gases compared to other sources of airborne pollution Based on emission figures from all transport modes reported by member countries to the CLRTAP convention, the developments in exhaust gas emissions from ships can be compared with other forms of transport and sources. Even if these figures include ship activity on the North Sea side for Denmark and Germany, and are thus not directly comparable with the emission estimates from FMI they still provide a way to study the relative developments between transport modes over longer time periods. SOx The main source of SOx emissions in Europe is energy production (burning coal and oil), responsible for 75% of total emissions. However, due to EU regulations requiring sulphur free fuels in land based transportation modes, maritime transport has since 2005 been the only form of transport with a significant level of SOx emissions. 27
29 NOx The most important source sectors for atmospheric NOx emission is the fossil fuel combustion in road transport, energy production and shipping. Agriculture is the most significant source for ammonia (NHy) emissions. In 2014 around 7% of NOx emissions in Europe came from non-land transport, mainly shipping (REF UNECE CLRTAP). Even if land transportation mainly personal cars and trucks is responsible for a much larger share, 40% in 2014, the introduction of catalytic converters during the 1990s have reduced land transport emissions to less than half during the period During the same period ship emissions have remained relatively stable (stable at kt during ), while NOx emissions from air transportation are small but have nearly doubled since Regulation of emissions to air from ships in the Baltic Sea 1992 Helsinki Convention and HELCOM Recommendations The 1992 Helsinki Convention Annex IV does not currently list MARPOL Annex VI among the IMO regulations it is urging its Contracting Parties to comply with. However, airborne emissions from ships have been considered over three decades within the HELCOM MARITIME group which was used to develop and negotiate regional submissions of proposals to IMO for both the SOx (submitted 1995, supplemented 1997) and NOx (submitted 2016) emission control areas in the Baltic Sea. In addition to MARPOL requirements the 1992 Helsinki Convention prohibits incineration of wastes deriving from the normal operation of the ship in the territorial seas of the Baltic Sea States (Annex IV, Regulation 7). MARPOL Annex VI General provisions Annex VI of the MARPOL Convention sets the general framework for exhaust gas emissions and other airborne pollution from all ships, fixed or floating platforms (drilling rigs) as well as Floating craft and submersibles. It covers besides NOx and SOx also reception facilities of relevant wastes (e.g. SOx scrubber waste), shipboard incineration, ozone depleting substances (ODS), volatile organic compounds (VOC) and fuel oil quality and availability. With regards to NOx, Annex VI is based on three emission reduction levels of NOx emissions (Tier I, II and III) each which also become stricter over time. The compliance of ship with MARPOL Annex VI tiers is documented in the International Air Pollution Prevention (IAPP) Certificate carried by each ship. NOx regulation applies to new ships only. Tier I and II apply worldwide. The strictest tier, Tier III, is to be applied within specific Emission Control Areas, i.e. NECAs. Currently such areas cover the North American and the United States Caribbean waters while the Baltic Sea and the North Sea will be covered from 1 January 2021 (Figure 2.3). 28

30 Figure 2.3 The Annex was the result of lengthy negotiations during the 1990s, adopted in 1997 and entered into force 19 May 2005 after the necessary ratifications. A revision of the Annex was initiated in 2006 and adopted in Its provisions do not apply when suffering damage to ship or equipment, when saving life at sea or when securing safety of the ship. If a certified incineration plant is available, Annex VI allows burning wastes generated from normal ship operation. However, as an exception it prohibits burning of certain products including contaminated packaging materials and polychlorinated biphenyls. MARPOL Annex VI SECA Baltic Sea The Baltic Sea was designated as a MARPOL Annex VI SOx Emission Control Area ( SECA ) in 1997 (entered into force 19 May 2005, in effect a year later from 19 May 2006) and the emission limits were tightened by an amendment in October 2008 which entered into force 1 July The last revision included a schedule with further tightening of the emission limits, for SECAs in 2015 and globally in 2020 (Figure X). [Figure X: Global SOx regulation Sulphur limits] The valid requirement in the Baltic Sea SECA, from January 2015, is that all ships navigating in its waters use fuel oil with a sulphur content not exceeding 0.10% m/m. In order to prove compliancy a bunker delivery note accompanied by a representative sample of the delivered fuel oil shall be kept on board the ship for port state control inspection. Alternatively, the ship may in the Baltic Sea area, and other SECAs, use an exhaust gas cleaning system/ any other technical abatement method reducing the total emission of sulphur oxides from ships ensuring the same level of efficiency as with fuel containing 0.10% m/m of Sulphur. 29
31 New exhaust gas cleaning systems must be approved in accordance with resolution MEPC.259(68), 2015 Guidelines for Exhaust Gas Cleaning Systems. Discharge of scrubber wash waters is not allowed in German rivers and ports. In most of the other countries ports can set their own rules but have not yet done so (by 2015). Most ports can receive residues from exhaust gas cleaning systems by using waste handling services trucks. MARPOL Annex VI NECA Baltic Sea Nitrogen Oxide (NOx) Emission Control Area (NECA) regulations, including measures to limit NOx emissions via exhaust gases of ships sailing in the Baltic or North Seas to Tier III level, were submitted to International Maritime Organization (IMO) in July 2016 and approved by the IMO MEPC in October 2016, and are expected to be finally adopted in June These foreseen NECA regulations target new ships built in or after 2021 and do not address existing ships at all. New ships, built 2021 or later, and sailing in the Baltic and the North Sea NECAs, have to meet the stricter Tier III standards of MARPOL Annex VI, in comparison to the Tier II standard applied globally outside NECA's. This corresponds to approximately 80% reduction in NOx emissions compared to current levels and can be achieved by technologies such as selective catalytic reduction (SCR), exhaust gas re-circulation (EGR) or using liquefied natural gas (LNG) as a fuel. NOx reducing technology for ships Currently the main technologies meet the Tier III NOx emission standards are Selective Catalytic Reduction (SCR), use of alternative fuels such as liquefied natural gas, and Exhaust Gas Recirculation (EGR). In addition, internal engine modifications and various wet methods, which use evaporation of water to reduce NOx emissions by local cooling inside the combustion chamber resulting in less NO x formation are available but do not meet Tier III and are not discussed further here. Selective Catalytic Reduction (SCR) SCR is currently the leading exhaust gas after-treatment technology and has a NOx abatement capability of more than 80%. The SCR concept involves injecting urea-water solution into the exhaust gas stream in combination with a catalyst unit in the exhaust channel. The SCR unit consumes urea-water solution (40%) which has to be stored on-board. Urea tank size depends on the engine size, how often the engine is used, and how often the ship can take on board urea. Modern vessels (offshore vessels, RoPax, fishing vessels) typically have a urea tank capacity of m 3 distributed between 1 2 tanks. SCR has long history in on-land applications as well as some 15 years on board ships. It is thus a well-known exhaust treatment system which may be integrated with the engine or installed as an "add-on" system which does not interfere with the basic engine design. The process requires a certain minimum engine exhaust gas temperature level, making the use of SCR under low engine load conditions, like port manoeuvres, challenging. For the same reason NOx, reduction may not be as effective at low load as at higher loads. 30
32 Exhaust Gas Recirculation (EGR) Exhaust Gas Re-circulation (EGR) relies on a part of the exhaust gases being filtered, cooled and rerouted back to the engine charge air. Since the specific heat capacities of the principal exhaust components are higher than air, the process results in a reduced combustion temperature and thereby less NOx formation. Also, as a secondary effect, a reduction of oxygen in the chamber means that there is less material available to combine with nitrogen to form NOx. The system results in bleed-off water which has to be managed. Bleed-off water can be stored in a tank or released to the sea after cleaning. SOx reducing technology for ships Fuel oil with low level of sulphur One of the reasons to the high level of SOx emissions from ships is that heavy fuel oil (also called residual oil) used on board ships is essentially waste product of refineries where cleaner fuels have been produced, i.a. by removing sulphur and other unwanted components. The most commonly used method to comply with SOx provisions of Annex VI of MARPOL is simply switch to using low sulphur fuel oil. From higher to lower residual oil content marine fuels are traditionally classified as Heavy (HFO), Marine (MFO) and Intermediate (IFO) fuel oils as well as Marine Diesel Oil (MDO) and the pure distillate Marine gas oil (MGO). The currently valid ISO standard for marine fuels specifies instead four different distillate grades (DM, i.e. DMA, DMB, DBX and DMZ) and a number of residual grades (RM). Even if distillates such as low sulphur MGO can be used to comply with SECA, new types of residuals called ultra-low-sulphur fuel oils (ULSFO) are also starting to be available response to the 0.1% S SECA limit. Exhaust Gas SOs Scrubber Technology In general scrubbers refer to a diverse group of pollution control devices that use a liquid to wash unwanted pollutants from a gas stream including exhaust gases. These can be used on board ships to clean exchaust gases from SOx by washing it with a liquid shower in a dedicated chamber before release to air. Water blended with caustic soda (NaOH) as reagent is a commonly used as scrubbing liquid in closed loop systems which reduces the SOx to 95%. The scrubbing water, including the Sulphur from SOx, is then sent to water treatment to clean the discharge water and to store the waste as a condensed liquid lotion or solid paste. The system has to be continuously supplied with new reagent. The waste product has to be stored on board and disposed of at port. Closed loop systems produce a bleed-off stream which may be stored in a tank or released to the sea after cleaning. Even if marine scrubber systems cover a large diversity of different technological solutions to main types are closed loop and open loop scrubbers. Closed loop scrubbers re-circulate most of the washwater inside the system while open loop release the water to the sea after the cleaning process. The release of scrubber water from open loop systems to coastal waters has been a controversial issue in some Baltic Sea countries due to concerns for the effect of the scrubber wash water on the marine environment. Exhaust gas cleaning systems using a dry cleaning medium have been tested but are not widely applied. 31
33 Alternative fuels LNG fuelled ships Use of alternative fuels, such as liquefied natural gas (LNG) in lean-burn diesel engines, offers another means to reduce SOx and NOx emissions. LNG is mostly cryogenic methane gas which is liquefied to reduce the volume of fuel onboard ships. It can be produced both from fossil and renewable sources, which makes it well-suited energy source for marine traffic. Existing marine engines can be modified to use LNG and for many years, LNG carriers have been using boil-off gas in their steam power plants. LNG does not contain Sulphur and lean-burn diesel engines have shown capable of 80 to 90% NOx reduction using fuel oil, and therefore comply with Tier III. Dual fuel marine diesel marine engines have become available which can operate on fuel oil, LNG, or a combination of both. The NOx reduction potential using LNG in dual fuel engines depends on the amount of pilot fuel injected to start the combustion process (Diesel process) and the cycle mode (2-stroke/4-stroke). When operating on natural gas, peak cylinder temperatures are reduced, relative to diesel operation, through the use of a lean-burn Otto-cycle combustion process. These lower peak cylinder temperatures restrict the formation of NOx. Further, use of LNG may lead to release of unburnt methane to the atmosphere (methane slip), which counteracts some of the climate benefits of LNG as marine fuel, because methane is approximately 25 times stronger greenhouse gas than CO2. Use of reformulated gas-to-liquid-fuels, however rare so far, produces substantially less NOx emissions in a manner comparable to Dimethyl Ether (DME) with no need for a pressurized fuel system. Availability of LNG for ships is also important to enable the use and development of LNG propulsion technology on board ships. According to the EU directive 2014/94/EU on the deployment of alternative fuels infrastructure, a core network of refuelling points for LNG at maritime TEN-T ports should be available at least by the end of Refuelling points for LNG include, inter alia, LNG terminals, tanks, mobile containers, bunker vessels and barges. Currently LNG terminals are operational in the port of Stockholm in Sweden, and in the port of Świnoujście in Poland. Also location of a LNG bunkering station in Port of Szczecin-Świnoujście in Poland is under consideration. In Finland, LNG bunkering is already possible in Pori (Gasum 2016) and there are plans to build LNG bunkering stations in three additional ports: Tornio Röyttä (2018), Rauma and Hamina. Major suppliers have ordered bunker vessels. If there will be demand for LNG fuel supply to ships, LNG terminals could be constructed also in Russian Baltic Sea ports. Methanol fuelled ships Methanol is an alcohol which is today usually produced in large scale with the Fischer-Tropsch process from natural gas (70 %) or coal (30%). However, Methanol can be produced from almost any biological material. As it is a liquid in standard atmospheric conditions, methanol has a big practical advantage over LNG -which has to be carried in pressurized containers. Marine engines models running on Methanol, either only or as an alternative fuel to fuel oil in dual fuel engines, are available. As distribution infrastructure for methanol as a marine fuel has the same challenges as for LNG, operation on methanol has become an attractive especially for specialized methanol carriers which operate in SECA areas as they already carry their fuel on board. 32
34 Electric motors Electric motors, using large storage batteries which are charged from power grid in port, are used in Norway for main propulsion since 2015 (Siemens 2015). Depending on how the energy was produced this may reduce the environmental footprint of shipping. Other more pioneering approaches generate the electricity on board from the fusion of hydrogen and oxygen to water, i.e. using a fuel cell. Wind -assisted propulsion for ships Wind is a potential source of energy for ship propulsion which results in no pollution and is completely free. Several attempts have been made over the last decades to re-introduce wind power as a serious source of ship propulsion for commercial traffic using innovative devices which enable automation, including kites, fixed sails or so called Flettner rotors. Even if the Baltic Sea is generally considered as too small, and with too irregular wind patterns, to harvest the full potential of wind propulsion some of these devices have also been tried out in Baltic. None of the experiments have resulted in full mainstreaming so far but these experiments have demonstrated that wind devices can be used to reduce emissions and fuel costs. The currently most promising approach is to install wind rotor/flettner devices on board existing ships. These devices use spinning/rotating cylinder shaped devices on the deck which tap to the physical phenomenon called the Magnus effect for propulsion. Some electric power is needed to rotate the cylinder but the propulsion energy gain exceeds greatly this sink. Cold ironing Cold ironing is increasing in popularity but further mainstreaming needs coordinated action between ports and ships calling them regularly. There should be good potential as using on-shore power has benefits to ship-owners and is a business case for ports. A relevant milestone for the implementation of this technology has been the approval of the ad-hoc international standard IEC/ISO/IEEE Future perspectives Enforcement challenges of air pollution from ships As compliance with the stricter emission standards of MARPOL Annex VI emission control areas implies relatively high costs, enforcement has to ensure that non-compliant operators do not get an economic advantage over law abiding ones. The economic gains of using a non-compliant fuel during a single voyage from the North Atlantic across the North Sea and Baltic emission control areas and back can be in the order of euro. Enforcement of the sulphur content of fuel oil is traditionally done by bunker delivery notes, documenting the quality of oil provided by the seller supplier, as well as spot checks of fuel used as part of port state control or dedicated sulphur control. However these approaches have their weaknesses, because high sulphur fuel can be purchased for use outside SECA or for use in combination with exhaust gas cleaning technologies. Existence of high sulphur fuel inside fuel tanks cannot be used as grounds for violation of sulphur rules. For this reason monitoring of the SO2 concentration of exhaust gases by remote sensing from airplanes or fixed devices has also been tested in the Baltic Sea, to investigate whether the emission levels of sulphur requirements are actually met during voyage. Monitoring Tier III NOx compliance will have to develop further and may remain more of indicative nature as it is more complicated. 33
35 Even if the challenges with compliance monitoring have been solved the fines for infringements have to have the intended deterring effect compared to the potential economic gains. In order to harmonise administrative fines for non-compliance of environmental regulations concerning ships HELCOM adopted the Recommendation 19/14 in Currently this minimum fines Recommendation is under revision and the inclusion of Annex VI infringements are being considered. Incentives to implement green ship technology and alternative fuels Various economic incentives can be used in order to adapt green ship technology voluntarily in advance of regulatory requirements. This includes traditional public sector financial support to green investments as well as innovative tools such as the combination of a NOx tax and a related fund in Norway. However mainstreaming of green technologies is besides an economic issue also to a high degree depending on the interest and knowledge level of the persons involved, within industry and national administrations. In order to promote the adaptation of green technologies and alternative fuels HELCOM has launched a public-private partnership which, in cooperation with the diverse field of other similar initiatives in the region and beyond, aims to help the emerging green shift within Baltic Sea shipping. References Bartnicki, J., Semeena, V. S. and Fagerli, H.: Atmospheric deposition of nitrogen to the Baltic Sea in the period , Atmos. Chem. Phys., 11(19), , doi: /acp , Brandt, J., Silver, J. D., Christensen, J. H., Andersen, M. S., Bønløkke, J. H., Sigsgaard, T., Geels, C., Gross, A., Hansen, A. B., Hansen, K. M., Hedegaard, G. B., Kaas, E. and Frohn, L. M.: Assessment of past, present and future health-cost externalities of air pollution in Europe and the contribution from international ship traffic using the EVA model system, Atmos. Chem. Phys., 13(15), , doi: /acp , Corbett, J. J., Winebrake, J. J., Green, E. H., Kasibhatla, P., Eyring, V. and Lauer, A.: Mortality from ship emissions: A global assessment, Environ. Sci. Technol., 41(24), , doi: /es071686z, Jalkanen, J.-P., Brink, A., Kalli, J., Pettersson, H., Kukkonen, J. and Stipa, T.: A modelling system for the exhaust emissions of marine traffic and its application in the Baltic Sea area, Atmos. Chem. Phys., 9(23), Jalkanen, J.-P., Johansson, L., Kukkonen, J., Brink, A., Kalli, J. and Stipa, T.: Extension of an assessment model of ship traffic exhaust emissions for particulate matter and carbon monoxide, Atmos. Chem. Phys., 12(5), doi: /acp , Johansson, L., Jalkanen, J.-P., Kalli, J. and Kukkonen, J.: The evolution of shipping emissions and the costs of regulation changes in the northern EU area, Atmos. Chem. Phys., 13(22), doi: /acp , Jonson, J. E., Jalkanen, J. P., Johansson, L., Gauss, M. and Van Der Gon, H. A. C. D.: Model calculations of the effects of present and future emissions of air pollutants from shipping in the Baltic Sea and the North Sea, Atmos. Chem. Phys., 15(2), doi: /acp , Liu, H., Fu, M., Jin, X., Shang, Y., Shindell, D., Faluvegi, G., Shindell, C. and He, K.: Health and climate impacts of ocean-going vessels in East Asia, Nat. Clim. Chang., (July), 6 11, doi: /nclimate3083,
36 Raudsepp, U., Laanemets, J., Maljutenko, I., Hongisto, M. and Jalkanen, J.-P.: Impact of ship-borne nitrogen deposition on the Gulf of Finland ecosystem: An evaluation, Oceanologia, 55(4), doi: /oc , GASUM 2016 Press Release LNG-bunkering-operation-completed-at-Pori-terminal-in-Finland/ Siemens 2015 Press release 35
37 03. SHIPS SEWAGE IN THE BALTIC SEA Introduction As most commercial ships tend to have small crews, sewage from ships is a topic which is particularly linked to passenger ship traffic. Passenger ship traffic in the Baltic Sea (see Chapter 1) includes ferries, particularly international ferries on fixed routes, as well as the recently booming activity of international cruise ships. In addition, a multitude of smaller national ferry lines operate within national waters of the Baltic Sea coastal states. Passenger traffic at sea is important to the whole region for connecting cities and their increasingly travel-interested citizens. Due to the small crews of cargo and tanker ships, the environmental impact of sewage discharges to the marine ecosystem have traditionally been considered as negligible -and for this reason sewage discharges have until recently been allowed in international waters around the world. In national waters discharges are usually allowed with certain minimum level of treatment. However, as modern passenger ships operating in the Baltic Sea tend to be fairly large with a large number of persons on board, cruise ships having a median capacity of [1,865] people including staff and passengers, sewage handling and discharges from these passenger ships have been identified as an environmental issue of regional concern. Even if sanitary concerns has been the traditional focus of sewage management, from the point of view of the marine environment sewage from passenger ships is, first and foremost, a source of nutrients (mainly Phosphorus and Nitrogen). Nutrients are important as they aggravate further the over-fertilization, or eutrophication, of the Baltic Sea. Eutrophication, with massive algal blooms as one of the most visible signs, is currently recognised by the Coastal States as one of the main marine environmental issues in the region. Even if it is recognised that sewage from passenger ships is not the biggest source of nutrients in the Baltic Sea, it is not insignificant either. With over [7.15 million] person days spent annually on cruise ships in the Baltic Sea and approximately more than 40 million ferry passengers annually on international journeys (HELCOM 2015), proper sewage disposal is an important and fortunately manageable, part in the overall effort to protect the health of the Baltic Sea marine environment. Estimated pollution load from ships sewage dischages Human toilet sewage is the main source of nutrients in ship sewage, even if also other sources of nutrients in waste water exist on board passenger ships such as comminuted food waste, which could be covered to further reduce the nutrient load. A study on nutrient load from ships commissioned by Finland for the purposes of the HELCOM Maritime in 2009 (Hänninen & Sassi 2009) [Hänninen S & Sassi J Estimated nutrient load from waste waters originating from ships in the Baltic Sea area Updated VTT-R ] assumed nutrient content of human toilet waste to be 15 g/person/day nitrogen content and 5 g/person/day phosphorus content. Hänninen and Sassi (2009) refer to another study from the same period, commissioned by the cruise industry, which used figures of 12 g nitrogen/person/day and 3 g phosphorus/person/day (Hänninen & Sassi (2009)). 36
 is comparable to a town with approximately 20,000 around the year inhabitants.")
38 Using AIS data and ship details regarding number of passengers and crew the annual number of person days spent on cruise ships in the Baltic Sea can be estimated. The 7.15 Million person days in 2014 (HELCOM 2015) is comparable to a town with approximately 20,000 around the year inhabitants. Using the nutrient content of daily human toilet sewage (thus excluding other potential sources of nutrients) and estimations of person days on board cruise ships operating in the Baltic Sea, the total nutrient content of toilet sewage produced in cruise ships can be estimated to be in the order of 30 to 36 tons Phosphorus and ton Nitrogen annually, depending on the figures used for nutrient content of daily toilet sewage of one person. In addition, sewage is also produced by the 40 million passengers on board international ferries, as well as un-estimated number of voyages by smaller ferries and leisure boats. Many international ferries have their own fixed berths and sewage port reception facilities and discharge most, or all, of their sewage on land. There is a clean variation of the number of passenger ships operating through the seasons. The figure 3.0 below show the amount of passenger ships traveling at sea since 2016 (monthly values) based on AIS data. Figure 3.0 In comparison, the wastewater treatment facility of the greater urban area around the capital of Finland, Helsinki, which treats the sewage from around 0,75 million people reaches 89% reduction in nitrogen (discharge 1.7 g/person/day), with a total N load of 479 tonnes/year, and 97% reduction in phosphorus (discharge concentration 0.1 g/person/day) with a total P load of 24 tonnes/year (Hänninen & Sassi 2009). Sewage discharges to the Baltic Sea are allowed for existing passenger ships until As existing sewage treatment on board cruise ships is not targeting nutrients it can be assumed that even if treated discharged sewage contains most of the original nutrient content. 37
39 However, some sewage is already now delivered to ports on a voluntary basis, but there is currently no available estimations of the total amount of sewage delivered to ports in the Baltic Sea area. It is for this reason difficult to estimate the share of the above total potential nutrient load which is not discharged to the sea. Characteristics of passenger ship sewage According to the MARPOL definition the term sewage covers all waste water from toilets and urinals, including drainage from medical premises via wash basins, wash tubs and scuppers located in such premises and from spaces containing living animals or other waste water when mixed with sewage. This means that in contrast to household sewage on land sewage from ships does not only cover so called black water (fecal and urinal waste) and mixtures of black water, grey water (generated from activities such as laundry, dishwashing, and bathing) and food stuffs, but may in theory also include mixtures with cooking oil and other substances like chlorine. Sewage sludge and other bio-residues from on board treatment falls under the MARPOL definition of ship-generated waste, not sewage. The specific composition of sewage varies due to several factors, e.g. ship type, number of passengers, length of the voyage and use of on board wastewater treatment systems. Nevertheless, recent studies have shown [REFERENCES] that despite the concerns waste water from passenger ships consists usually of pure black water, sometimes mixed with grey water and thus does not usually differ from normal household sewage. Mixing black water with grey water, which greatly increases the volume of sewage generated, is commonly carried out on board new ships as this mixing is needed to ensure the functioning of advanced treatment systems. Regulation of sewage discharges from passenger vessels in the Baltic Sea Sewage from ships has been a standing topic in regional cooperation in the Baltic Sea, likely due to its nature as a source of pollution which is easily understandable for everyone Helsinki Convention and HELCOM Recommendations The Helsinki Convention addresses the issue of sewage from passenger ships in its Annex IV on sea based pollution mainly by requesting the contracting parties to implement existing MARPOL requirements (MARPOL Annex IV). Based on the Convention HELCOM has also given recommendations on the sewage treatment systems and the capacity calculation of sewage treatment systems on-board passenger ships (Rec. 11/10), as well as recommended to apply a no special fee system related to port reception of ship generated wastes, including sewage (Rec. 26/1), which means that the usage fee of facilities should be borne regardless of use. MARPOL Annex IV Sewage is defined by MARPOL Annex IV as: - drainage and other wastes from any form of toilets and urinals; - drainage from medical premises (dispensary, sick bay, etc.) via wash basins, wash tubs, and scuppers located in such premises; - drainage from spaces containing living animals; or - other waste waters when mixed with drainages. 38


40 According to Regulation 9 of MARPOL Annex IV, every ship certified to carry more than 15 persons or of size above 400 GT shall be equipped with one of the following: a sewage treatment plant a sewage comminuting and disinfecting system for the temporary storage of sewage when the ship is less than 3 nautical miles from the nearest land a holding tank of sufficient capacity for the retention of all sewage, having regard to the operation of the ship, the number of persons on-board and other relevant factors According to the provisions of MARPOL Annex IV the discharge of sewage from ships is prohibited closer than 12 nautical miles off the nearest land unless the ship has in operation an approved sewage treatment plant or sewage has been comminuted and disinfected using an approved system and the distance from the nearest land is longer than 3 nautical miles. When discharging from a sewage holding tank, the discharge must be at a moderate rate and the ship must be proceeding en-route at a minimum speed of 4 knots. The Baltic Sea as a special area under MARPOL Annex IV In general, global rules on ship sewage, such as the IMO MARPOL Convention Annex IV targeting sewage, have typically addressed sanitary concerns of sewage but not nutrient content of sewage. At the same time, the Baltic coastal countries have applied increasingly stringent nutrient limits to sewage discharges from land. The considerable investments on sewage treatment on land have turned the public opinion against the international maritime rules allowing sewage discharges from ships at sea. As a recent major development in over four decades of work in addressing sewage from passenger ships as a pollution source, IMO declared the Baltic Sea a special area for sewage in 2011 (Figure 3.1). Figure 3.1 This decision was based on a joint application by the Baltic Sea countries and the dates for entry into effect were decided by IMO in [April] The Baltic Sea was the first sea in the world to receive status as a special area for sewage and have this status enforced by the International Maritime Organization (IMO). The special area regulations will be applied on or after 1 June 2021 for existing IMO-registered passenger ships. For new passenger ships, the regulations come into effect on or after 1 June For direct passages between St. Petersburg and the North Sea, there is an extension until 1 June When the special area regulations are in effect passenger ships certified for more than 15 passengers, or over 400 GT, will be limited to discharging sewage into port reception facilities or alternatively at sea only after treatment with advanced on-board sewage treatment plants able to reduce nutrient input into the sea. Sewage delivery to port Port reception facilities in the Baltic Sea region Ensuring availability of Port Reception Facilities, including those for sewage, is a big task for the Baltic Sea coastal countries and their ports and the development to the current level is the result of persistent work 39
41 over several decades. As an example for the long term nature of this work, the first HELCOM recommendation (1/1) adopted in 1980 called to ensure the use of the port reception facilities, including for sewage, in the Baltic Sea ports. During the 1990s the HELCOM s Baltic Sea Strategy on Port Reception Facilities ( Baltic Strategy ) introduced a round of concrete improvements of sewage reception facilities in Baltic Sea ports, especially in Estonia, Latvia, Lithuania, Poland and Russia. The preparation and implementation of MARPOL Annex IV Special Area after 2007 introduced a second round of investments in sewage PRFs in the Baltic Sea. By 2016 IMO received notice from coastal countries that adequate port reception facilities were available or will be available by the entry into effect of the Baltic Sea Special Area regulations. 40

42 Figure 3.2 [will be updated with PRF information from 2017] Sewage Port Reception facilities can be divided into two main types: Fixed facilities serving the vessel with a sewage discharge hose connected to a sewer pipe leading to an on-land treatment facility. These facilities may have very high level of reception capacity up to several hundred cubic metres per hour. 41
43 Mobile facilities which is a sewage tank on a truck or barge. These have the advantage of mobility but tend to have small total capacity in the order to tens (trucks) or hundreds of cubic metres (barges) which has to be emptied to a sewage collecting point before it can be filled again from the ship. Use of Port reception facilities for sewage Even if bigger passenger ships seem relatively similar, cruise vessels and international ferries are different from each other in terms of sewage handling needs in ports. While ferry companies have usually their own port facilities or other arrangements, including better control over possibilities to discharge sewage on land, cruise ship routes have irregular routes and must rely on the facilities provided by the frequented ports. Likely due to image concerns and as a result of their better possibilities to solve sewage handling problems themselves, many ferry companies operating fixed routes in the Baltic Sea have informed that they deliver all sewage to port reception facilities or discharge after treating with sewage treatment facilities meeting the stringent Baltic Sea special area requirements (IMO MEPC resolution ) (WWF 2015). However, deviations from this general rule may exist as information on sewage treatment practices of all ferry lines operating in the Baltic Sea is not available (WWF, 2015). Cruise ships are fully depending on the facilities provided by the frequented ports. High reception capacity in terms of volume per time unit is needed as ships carry on many passengers and crew, on average 1500 but every tenth vessel more than 4000, and as a typical port stopover lasts only for 8-10 hours. Figure 3.3 Two-thirds of cruise ship port calls are made in either St. Petersburg, Copenhagen, Tallinn, Helsinki, or Stockholm, which have very advanced fixed sewage PRFs (hose connection), but smaller ports are also commonly visited which may have difficulties to cope with the discharge needs. 42

44 On board treatment Sewage can be treated to a high degree by special on board treatments plants (Figure 3.5). The capacity of such facilities is very much depending on the device and on how it is operated. Figure 3.5 When the special area under MARPOL Annex IV takes effect any discharge of sewage from passenger ships in the Baltic Sea will be allowed only for sewage processed through an especially advanced on-board sewage treatment plant which reduces also nitrogen and phosphorous concentrations to specified levelsfor Nitrogen 20 mg/l or 70% reduction and for Phosphorus 1 mg/l or 80% reduction. 43

45 For comparison with treatment requirements on land, the HELCOM Recommendation 28E/5 sets reduction targets of Nitrogen 30% & Phosphorus 80% for cities with 2,000-10,000 inhabitants which are situated in the Baltic Sea coastline or catchment area. Treatment plants complying with the special area regulations of MARPOL Annex IV are approved by national administrations taking into account the standards and test methods developed by IMO, see resolution MEPC.227 (64). There has been a rapid increase of approved systems since By April 2017 the IMO GISIS system listed 52 different AWTS models from 5 manufacturers (Aco Marine,Evac, MARTIN Membrane Systems, Rochem Technical Services & Scanship) which are approved to fulfil the requirements of Passenger Ships & Ferries operating in MARPOL Annex IV special areas (including the Baltic Sea). Tables 3.1 and 3.2 Future perspectives The coastal countries and the industry are currently preparing for the entry into force of the MARPOL Annex IV Special Area. As part of this work the coastal countries, as well as ports and passenger shipping 44
46 interest organizations and NGOs, continue their collective efforts to further improve availability of adequate sewage port reception facilities across the Baltic Sea area. In order to optimise the sewage PRFs facilities to serve the vessels typically using them, as well as to ensure a justifiable level of investment, there is still some work to do to consider both supply and demand of PRFs. In addition the enforcement of the special area provides its own challenges. This section takes up some issues which have emerged during regional discussions on sewage PRFs. The possibilities of advanced route planning to optimise port reception capacity Port reception facilities are typically costly and as this cost has to be borne by ports, so far without any direct benefit, upgrades have been typically slow to implement except in the biggest cruise ports. Eight of the nine coastal countries are EU members and the currently ongoing updates of the PRF Directive might speed up the developments by regulatory requirements. Estimating the appropriate level of investment and capacity of a given sewage port reception facility in a Baltic Sea port is a complicated task. It relies on several variables including the number and size of ships usually visiting, distance from and facilities at the previous port, length of stopover as well as vessel design (e.g. whether vacuum or gravity toilets are used, whether grey water from showers and black water from toilets have separate systems or not), play a decisive role. Even if larger ports can be expected to be able to receive very high volumes of sewage over short periods of time the picture becomes much less clear with smaller ports, especially very small ports with only a handful of visits annually. The smallest ports should be able to justify a lower level of investment to, and capacity of, their Sewage PRFs. As the distances between Baltic Sea ports are usually reasonable, the sewage discharge needs at a given port are drastically reduced if the facilities provided at the previous port of call enabled full or partial discharge. Planning in sewage discharges to route planning of vessels has thus great potential to reduce unforeseen sewage discharge burden when visiting small ports with low number of annual visits. Separation between grey water and blackwater to reduce sewage volumes In terms of volume the bulk of sewage volume produced on board a passenger ship is not black water from toilets but originates from showers and similar washing facilities with low level of nutrient content. However, if mixed with black water all of this grey water volume has to be dealt with in the same way as unmixed black water. This is naturally translated to a high capacity demand to port reception facilities. The effect of this mixing to the estimations of sewage volumes can be clearly seen by comparing the black water sewage volumes in vessels with and without a vacuum toilet system. In vessels with a vacuum toilet system the sewage volume generated by a single person on-board has been estimated to be 100 L/person/day. However, cruise vessels produce usually significantly higher volumes, 175 L/person/day or more. It is clear that, even with a certain degree of mixing, the volume of sewage produced and the discharge capacity required from sewage PRFs, could be drastically reduced by separating the piping and retention tanks for blackwater and at least certain types of low-nutrient greywater. However, naturally this kind of solutions are difficult if not impossible to retrofit and have to be engineered and constructed only to new vessels. 45
47 Performance of installed on-board treatment The current provisions of MARPOL Annex IV regarding on-board treatment are based on the notion of type approval, and not actual performance or operation. In other words there are no sanctions for a suboptimally operating facility if it has been type approved and operated according to the instructions. Closer follow up of operation of on-board facilities have been suggested as a way to ensure that treated sewage actually meets the standards set by type approval. Alaska is currently the only area of the world where such performance level requirement of on board sewage treatment exists. In the MARPOL system there is no adequate enforcement on proper working and maintenance of the sewage treatment plants (IMO 2017). Surveillance and enforcement Even if untreated discharges of sewage to the sea will not be allowed after 1 June 2021 (except for direct passages between St. Petersburg and the North Sea, for which there is an extension until 1 June 2023) the enforcement of this regulation is challenging as sewage discharges are difficult to see from satellites of airplanes. New technology, or alternatively a requirement to keep a sewage record book, would be needed to limit deliberate infringements. References: Hänninen S. & Sassi J Estimated nutrient load from wastewaters originating from ships in the Baltic Sea area Updated VTT-R WWF 2015 IMO 2017 Updated information and analysis based on tests on the effluent of sewage treatment plants (MEPC 71/INF.22). 46
48 04. OPERATIONAL OIL DISCHARGES FROM SHIPS Introduction Operational oil spills refer to various smaller oil spills, which are not the result of ship accidents -but rather resulting from discharges of small amounts of oil, or more usually unfiltered oily water. Such spills are usually the result of activities like cleaning of tanks or machine room at sea. These spills may be accidental in the sense that they result from unintentional but still wrong procedures, or they can be in fully deliberate. Even small amounts of oil can have a negative impact on the marine environment; seabirds for instance are very sensitive to oil. The Baltic Sea was among the first sea areas in the world (adopted 1973 in force 1983 alongside Mediterranean, Black Sea, Red Sea and the Gulfs Area) to be declared as a special area for oil according to the MARPOL Convention Annex I. This status means that oil and other petroleum products can be legally discharged to the sea only at very low concentrations, not visible to the naked eye (less than 15 ppm). This is achieved by passing all water discharged from machine rooms, cargo holds and other comparable spaces through a bilge separator/oil filter system. Thus, a non-accidental visible slick implies always an illegal spill in the Baltic Sea. This long history means firstly that port reception of oil is, according to the no-special fee approach, covered by the obligatory environmental fee in practically every port in the Baltic Sea. Due to this it is difficult to find a single reason for the remaining truly deliberate operational oil spills as there is really no direct economic gain in discharging the oil at sea (except perhaps time pressure). Likely these spills are thus at least partly the result of action by uninformed mariners from other sea areas who are simply not aware of the rules and practices in the Baltic Sea. Another consequence of the long history of work against operational oil spills is that there is a low tolerance of port states to even smaller spills. Combined with the very effective satellite and airplane surveillance in the Baltic Sea these factors have together led to the very small number of operational oil spills in the region compared some other European sea areas (Kachel 2008). 24/7 Satellite image coverage has further removed the concerns that a high number of undetected spills would take place during times and in areas not under aircraft surveillance. However, even with modern surveillance equipment and high degree of satellite coverage, the prosecuting operators of polluting vessels is still challenging. The situating has started to improve only recently as several information sources can be used by the public prosecutors to build convincing cases. The dramatic reduction in operational oil spills in the Baltic Sea, which can be observed in the official HELCOM aerial surveillance data time series covering the period is one of the often forgotten success stories of clean shipping in the Baltic Sea. Operational oil discharges in the Baltic Sea Cooperation on aerial surveillance in the Baltic Sea was established already in the 1980 s, which has enabled an unusually long time series of operational oil spills. The data shows especially clear decreasing trend in the number of illegal discharges of oil during the last ten years with same level of surveillance in flight hours and even supported by intensified satellite observations since
49 The total estimated annual volume of oil spills observed in has been in the order of 20 m 3 while during the 1990s the volumes were a magnitude higher and annual total estimated volume was below 200 m 3 only during two years. The operational spills have thus decreased with more than 90% since the early 1990s. Also the number of spills has dropped dramatically during the same period, from the around observed spills during the early 1990s to the 80 spills in 2015 (see figures 4.1, 4.2 and 4.3). Figure 4.1 and

50 Figure
51 Regulation related to operational oil discharges in the Baltic Sea MARPOL Annex I targeting oil pollution defines oil as meaning means petroleum in any form including crude oil, fuel oil, sludge, oil refuse and refined products. Subject to the provisions below any discharge of oil or oily mixtures into the Baltic Sea area is prohibited based on MARPOL and its Annex I as well as the 1992 Helsinki Convention Helsinki Convention and HELCOM Based on the Helsinki Convention and HELCOM Recommendation 19/10 the MARPOL Annex I special area requirements for oil separator arrangements, described below, apply also to ships of less than 400 tons gross tonnage, flying the flag of a Baltic Sea State. In addition, national regulations are in place in the Baltic Sea region. Finland has prohibited the use of bilge water separators in her inland waterways and in the territorial waters, within the area 4 nautical miles from the nearest land, and Denmark has a total ban on the discharge of oil in territorial waters. MARPOL The Baltic Sea was designated as a MARPOL Annex I special area in 1973 (in effect from 2 October 1983). Based on this a discharge can be permitted only if the oil content in the effluent does not exceed 15 parts per million (ppm). In summary MARPOL Annex I requires that ships of 400 tons gross tonnage and above the oil filtering equipment must be provided with arrangements that ensure that any discharge of oil or oily mixtures is automatically stopped when the oil content in the effluent exceeds 15 parts per million. The permitted concentration 15 ppm is so low that it is not possible to see it with bare eyes. The regulations apply not only to discharges from the cargo tanks of oil tankers but equally to discharges from the machinery spaces of any ship. Port reception of oil waste All ports in the Baltic Sea are provided with reception facilities for other residues and oily mixtures from all ships. As a general rule a no-special-fee system is applied in Baltic Sea ports to oily wastes from machinery spaces, in order to avoid incentives for illegal disposal, see HELCOM Recommendation 28E/10. Oil loading terminals and repair ports are provided with reception facilities to receive and treat all the dirty ballast and tank washing water from oil tankers. The consignor in the loading port is responsible for reception arrangements for cargo-related wastes covered by MARPOL Annex I (oil residues from cargo tanks). Aerial Surveillance to detect operational oil discharges Co-operation on surveillance within the Helsinki Convention is carried out in accordance with Annex VII (Regulations 1, 3, 4, 10) to the Helsinki Convention and HELCOM Recommendation34E/4 and was established already during the 1980s. The purpose of aerial surveillance is to detect spills of oil and other harmful substances, which can threaten the marine environment of the Baltic Sea area. These spills caused by accident or made in contravention of 50
52 international Conventions will be registered and, if possible, sampled from both the sea surface and on board the suspected offender. The aerial surveillance is complemented by satellite surveillance to enable bigger area coverage and optimisation of flights effectiveness. Within the framework of the Helsinki Convention a very close co-operation on airborne surveillance has been established. The cooperation aims at a high level of surveillance achieved by regular National Flights, special coordinated surveillance flights such as Coordinated Extended Pollution Control Operation (CEPCO) Flights, standardization of reporting formats and exchange of information to Contracting Parties as well as working together in improving existing systems and procedures. All coastal States are committed to fly - as a minimum - twice per week over regular traffic zones including approaches to major sea ports as well as in regions with regular offshore activities. Other regions with sporadic traffic and fishing activities should be covered once per week. Experienced observers and pilots are involved contributing to reliable detections, classifications and quantification of observed pollution, their frequencies and geographical distributions. The following equipment can be considered as standard for surveillance aircraft operating in the Baltic Sea and are used regularly: video/photo cameras, SLAR radar, IR-UV sensor, EO/IR sensor, AIS receiver, Maritime VHF with DSC, satellite positioning system (GPS or similar). This standard equipment has overcome the limitations in identifying offenders visually during flights in darkness or poor visibility. Flights are for this reason regularly flown in darkness (according to the aviation definition) and the share of such flights is according to the HELCOM Response Manual recommended to be 15-25% on average. The following equipment can be considered voluntary but is available on board some surveillance aircraft in the region: Microwave, laser fluorosensor, voice recording, satellite telecommunication, HF radio with DSC. The HELCOM Informal Working Group on Aerial Surveillance (IWGAS) works to implement the aerial surveillance cooperation and commitments. HELCOM Secretariat compiles annually data on illegal discharges observed in the Baltic Sea area during national and joint co-ordinated aerial surveillance activities. Satellite surveillance to detect operational oil discharges Satellite observations support regularly the efforts of the Baltic Sea states in their surveillance work. Satellite surveillance in the Baltic Sea has intensified since 2007 thanks to the CleanSeaNet satellite surveillance service provided by the European Maritime Safety Agency (EMSA). The coastal countries receive in near real time early warnings of potential oil spills based on satellite data from EMSA. This allows the countries to do spot checks by aircraft very soon after detection, which increases the likelihood of catching polluters red-handed. In around 60% of cases aircraft can reach slicks in time to be checked. Typical false positive detections are caused by natural phenomenon like waves. Enforcement and prosecution of operational oil discharges The purpose of regional aerial surveillance is to detect spills of oil and other harmful substances and thus prevent violations of the existing regulations on prevention of pollution from ships. 51
53 The surveillance activities aim thus always to establish the identity of a polluter. The Coastal countries also make efforts to sample spills from both the sea surface and on board suspected offenders to enable prosecution. However, even today a majority of cases of detected discharges polluters remain unknown. The identification of ships suspected of illegally discharging oil into the sea is further facilitated by tools such as the HELCOM SeatrackWeb (STW) oil drift forecasting system as well as EMSA tools linked to the CleanseaNet service. This tool, in combination with Automatic Identification System (AIS) data, is used for backtracking and forecasting simulation of detected oil spills, and matching the ship tracks with oil spill backtracking trajectory. STW/AIS has also been integrated with satellite information to increase the likelihood that polluters will be identified. Future perspectives [text to be added] References Kachel, M.J The Marine Environment: Oceans under Threat. Particularly sensitive sea areas: the IMO's role in protecting vulnerable marine areas, Springer-Verlag New York, pp [more references to be added] 52

54 05. OPERATIONAL DISCHARGES OF CHEMICALS Introduction Our highly technological societies use large numbers of different potentially hazardous substances other than oil and oil products. Many of these are transported by sea in the Baltic Sea, some in high, but mostly in smaller quantities. The vessels carrying these chemicals are rarely specialised in a single substances but transport instead a large number of different chemicals based on customer needs (Hänninen & Rytkönen 2006; Posti and Häkkinen 2012). The figure 5.1 shows the port visited by these chemical tankers as well as the traffic density in the Baltic Sea (based on AIS data). Figure 5.1 As the carried chemical is not necessarily identical, tanks have to be washed between such operations to ensure purity of the next cargo (McGeorge 1995). Due to this fact tank washing, and a series of flushing 53
55 rounds to empty even traces of the contents, is an essential feature of chemical tanker operations (Kunichkin 2006). As chemicals are commonly relatively expensive per volume unit, operators have usually their own economic self-interest in emptying the tanks to the highest degree practically possible before washing. However, some of the substance will remain in the tanks even after a prewash procedure and only a high number of repeated washing/flushing will reduce all traces of the carried chemicals (McGeorge 1995, Kunichkin 2006). As time in port and the use of port reception facilities has economic consequences to the terminal or the operators, there are practical and economic limits to the level of washing which is required to be carried out in port. The flushing commonly continues at sea and for this reason some effluents of this tank washing, or more commonly water from secondary flushing after washing, is usually discharged to the sea. This water usually includes at least some traces of the carried chemical (Honkanen et al 2012). The toxicity or harmfulness of the carried substance determines the level of tank cleaning required before such operational discharges to the sea from tanker vessels carrying chemicals. As there exists thousands of chemical substances carried by sea, substances have for this purpose been grouped according to harmfulness, and thus the level of required tank cleaning before any discharges to the sea. Even if the level of such operational discharges of chemicals are based on grouping, essentially a form of risk assessment based on the properties of the substance, it is clear that due to the number of substances involved some possible environmental effects might have been overlooked in the classification. However this is usually a challenging issue to study further as the discharges are done offshore while the ship is moving and as the volumes released are usually relatively small (Honkanen et al. 2012). One example of a class of substances which seem to warrant a review of the existing tank washing requirements include a number of high-viscosity, solidifying and persistent floating products in the least toxic category Z, including for example paraffin wax. Even these substances are not toxic in the traditional sense of the word they have very low solubility in water, float on the surface after discharge and eventually end up on shore (Dahlmann et al. 1994, Camphuysen et al. 1999). Over the last ten years relatively large amounts of paraffin wax and similar products, which most likely originate from tank washing/flushing, have been found on the beaches of Baltic and North Sea countries and need to be cleaned. This has triggered an ongoing process to review the classification, and tighten the discharge requirements, of these substances at IMO level. As a related step the increase in observations of spills of other substances than oil in the HELCOM aerial surveillance operations [REF???] has recently led to the inclusion of these substances to the regional data collection activities. 54
56 Figure 5.2 Discharges of HNS cargo residuals in the Baltic Sea The amount of a chemical that may legally be released into the sea per cargo tank is liters depending on the ship s construction year (Appendix 4 to MARPOL Annex II). When chemical remnants are washed away with water, the total quantity of slop generated per tank in the main washing procedure may vary from 10 m3 to hundreds of cubic meters per tank (HELCOM 1993). Ship has typically cargo tanks (Hänninen & Rytkönen 2006). During recent decade the aerial surveillance contacts of the Baltic Sea coastal countries have reported orally at HELCOM meetings an increase in the number of confirmed detections of other substance or unknowns in the Baltic Sea. This indicates observations of substances other than oil, or other targets which are not natural phenomena, but which could not be identified more precisely with the available sensors or the naked eye (Figure 5.2). As such other substances have not been a cause of concern previously they have not been systematically covered in the aerial surveillance data collection in the Baltic Sea before Nevertheless, such observations have been included since 2007 in the EMSA satellite detections sent to those coastal countries which are also EU countries in near real time and who have mad efforts to check them within three hours of satellite detection. Even if the absolute number of detections vary a lot between years, after 2010 there has been a higher number of confirmed observations including other substances or unknowns (Figure 5.1). Even if the aerial observations data does not give a clear picture, there has been an increasing number of incidents where floating paraffin wax and similar chemical products have been observed on beaches in 55

57 Germany and Denmark, both on the coast of the Baltic Sea and the North Sea, as well as in Lithuania and Poland. According to MARPOL Annex II, most paraffin is classified as a code Z substance, and thus of minor hazard to the environment, for which pre-washing at a port reception facility is not required. According to data from Germany, a number of these pollution incidents have involved large quantities of paraffin products which are according to official reports most likely from cargo residue discharged at sea by tankers (Table 5.1 below). In this kind of cases beaches must be closed to the public and expensive cleaning operation must be carried out. Table 5.1 Even if in the Baltic Sea the damages have so far been economical costs of clean-up, on the coast of Southwest England, incidents with a polyisobutylene (or polyisobutene, PIB) killed large numbers of seabirds in 2013 (REF GUARDIAN) [Aldred, Jessica 2013 Seabirds affected by second wave of sticky pollution 'could number thousands' Wednesday. The Guardian 17 April BST]. PIB is an oil additive often used to improve the performance of lubricating oil and in products ranging from adhesives to sealants and chewing gum. This specific product was rapidly reclassified by the IMO during the course of 2013, and any discharging without prewashing the tanks is now prohibited. Regulation related to HNS 1992 Helsinki Convention [to be developed] MARPOL & IBC Code MARPOL Annex II originally went into force on April 6, 1987 to protect the environment by controlling operational pollution and reducing accidental pollution resulting from groundings and collisions from vessels carrying Hazardous and Noxious Substances (HNS) in bulk. Annex II substances can be any bulk liquid that does not meet the definition for oil as defined in MARPOL Annex I. These substances might include, inter alia: petrochemicals, solvents, waxes, lube oil additives, vegetable oils and animal fats. In 2004 the MARPOL Annex II and the related IBC Code, were thoroughly revised (in effect January ). These revisions changed significantly carriage requirements for HNS in bulk. The aim was to make the regulations easier to use via a new categorization, and to take into account new knowledge about the effects of some chemical products on the marine environment. 56
58 In the revised MARPOL Annex II, the Baltic Sea is not a special area under MARPOL Annex II (Noxious liquid substances in bulk) and the same MARPOL Annex II rules apply as elsewhere. MARPOL Annex II and the IMO International Bulk Chemical (IBC) Code divide substances to Categories X (major hazard/very harmful), Y (hazard/harmful), Z (minor hazard/minor harm) and OS (considered not harmful, not subject to any requirements of MARPOL Annex II). Examples of OS products are clay slurry, molasses, and apple juice. The carriage and discharge into the sea of noxious liquid substances, which have not been categorized to these categories, provisionally assessed or evaluated, is prohibited. This prohibition applies also to noncategorized substances contained in ballast water, tank washings, or other residues or mixtures. According to MARPOL Annex II every ship certified to carry substances of Category X, Y or Z shall have on board a Procedures and Arrangements (P&A) Manual approved by the Flag State administration. Tanks having contained IBC Code Category X substances must be pre-washed and the resultant tank washings must be delivered to a reception facility before a ship leaves the port of unloading. The concentration of the substance in the effluent to the facility must be at or below 0.1% by weight and after this the tank must be fully emptied to the facility. Tanks having contained IBC Code Category Y or Z substances must be pre-washed if unloading of cargo has not been carried out in accordance with the P&A Manual and the resultant tank washings must be delivered to a reception facility before a ship leaves the port of unloading. The exception is high-viscosity or solidifying substances in IBC Code Category Y for which specific pre-wash procedures (Appendix 6 of MARPOL Annex II) must be applied and the residue must be discharged to a reception facility at the port of unloading until the tank is empty. The eventual discharge of any residues of substances in Categories X, Y or Z into the sea, remaining after the tank washing and discharge specified above, must be done below the waterline while proceeding en route at a sufficient speed (7kn for self-propulsion) at minimum 12 nm distance from the nearest land and in water depth of at least 25 m (Table 5.2). 57
 Prewashing -an efficient measure for chemicals carried in liquid bulk Based on modelling, when prewashing has been carried out properly, the subsequent tank washings")
59 Table 5.2: Summary of the stripping and discharge requirements for noxious liquid substances carried in bulk laid in revised MARPOL Annex II and IBC code. (Modified from INTERTANKO, 2006) Prewashing -an efficient measure for chemicals carried in liquid bulk Based on modelling, when prewashing has been carried out properly, the subsequent tank washings released to the sea seem to represent only a very minor and local risk for the marine environment even when involving substances of the most toxic cargo category X (Honkanen et al 2012). It can be thus considered an effective measure even if this should be verified by measurements in the sea around a real discharge. Future perspectives Amendments to MARPOL Annex II related to the discharge of cargo residues and tank washings of high-viscosity, solidifying and persistent floating products Even if technically allowed under the 2007 revisions of MARPOL Annex II, the frequency and volumes of incidents of high-viscosity, solidifying and persistent floating products washing up on the coasts of Baltic Sea countries runs intuitively against the meaning and purpose of MARPOL. Even if some commentators have raised the idea to re-introduce special areas under MARPOL Annex II, currently tightened discharge and prewash requirements for all high-viscosity, solidifying and persistent floating products (regardless whether classified as category X,Y or Z substance) have been the focus of global discussions. This includes proposals to change the temperature at which high viscosity is determined to e.g. 20 deg C compared to current at discharge temperature as well as to change the en route definition to ban the practice of going out from port to discharge at sea, and return to same port for loading. As in many other MARPOL regulations port reception facilities are a critical link as proper prewash implementation is completely depending on the availability of adequate reception facilities. 58
60 As around 150 products in the IBC Code are classified as floaters alone, and as some of these are carried in high volumes, this would in itself be a major commitment and will likely take a long time to negotiate with the industry. As an indication of the challenges involved the last meeting of the IMO PPR group in January recommended MEPC 71 (July 2017) to postpone the timelines for the related Annex II revisions to Aerial surveillance and new sensors for HNS substances Observations of hazardous noxious substances (HNS) discharges are a challenge today as the number of different substances is large and as adequate sensor systems are not available which have been heavily focusing on oil. Due to the number of different substances carried by chemical tankers, a single sensor approach, covering all possible substances, is naturally not possible. Instead any future instruments will target some main characteristics of some substance groups of interest. For this purpose X, Y and Z substances should be studied in depth to identify which of those substances are floaters (and so can be measured by a sensor from an aircraft) and the likelihood of their release. Also the practices of MARPOL Annex II discharges, as well as routes and typical cargoes should be studied more to develop HNS aerial surveillance as well as the related technology further. Airborne hyperspectral cameras have been studied as a possible future tool to enable detection of HNS discharges. In addition, Microwave Radio Meter and Laser-Fluorosensors have also been identified as promising technologies for aerial surveillance of HNS. References Camphuysen, K. C. J., Barreveldà, H., Dahlmann, G. & Van Franeker, J. A. (1999). Seabirds in the North Sea Demobilized and Killed by Polyisobutylene (C4H8)n (PIB). Marine Pollution Bulletin 38: Dahlmann, G., Timm, D., Averbeckt, C. H. R., Camphuysen, C., Skov, H. & Durinck, J Oiled Seabirds- Comparative Investigations on Oiled Seabirds and Oiled Beaches in the Netherlands Denmark and Germany ( ). Marine Pollution Bulletin 28: HELCOM (1993). Seminar on Reception Facilities in Ports. Turku, Finland, November Balt. Sea. Environ. Proc. No. 50. Available at: Honkanen M, Häkkinen J & Posti A Tank cleaning in the Baltic Sea Assessment of the ecotoxicity of tank cleaning effluents. Publications from the Centre for Maritime Studies University of Turku, A 63. Honkanen M, Häkkinen J & Posti A Assessment of the chemical concentrations and the environmental risk of tank cleaning effluents in the Baltic Sea. WMU Journal of Maritime Affairs: Volume 12, Issue 2, pp Hänninen, S. and Rytkönen, J. (2006). Transportation of liquid bulk chemicals by tankers in the Baltic Sea.VTT Technical Research Centre of Finland. VTT Publications p. INTERTANKO (2006). The Revisions to MARPOL Annex II - A Practical Guide. 42 p. Available at: The International Convention for the Prevention of Pollution from Ships, 1973, as modified by the Protocol of 1978 relating thereto (MARPOL 73/78). Kunichkin, V. (2006). Chemical Tanker Notes. 234 p. Seamanship International Ltd. Lanarkshire, UK. 59
61 McGeorge, H. D. (1995). Marine Auxiliary Machinery 7th Ed. 525 p. Butterworth-Heinemann, Elsevier Ltd. Great Britain. Posti, A. and Häkkinen, J. (2012). Survey of transportation of liquid bulk chemicals in the Baltic Sea. Publications from the Centre for Maritime Studies University of Turku, A p 60
62 06. SHIPS BALLAST WATER IN THE BALTIC SEA Introduction All ships are designed for a certain cargo load range. For this reason weight (ballast) need to be taken on board after unloading of cargo in order to reduce stress on the hull, provide stability as well as to optimise propulsion and manoeuvrability. While stones or other heavy items were used for this purpose during the age of sail ships, modern vessels use water pumped in to dedicated ballast water tanks. Most of ballast water is taken at the place of cargo unloading, which in most cases means a port. As ports are often situated in estuaries, and as ship movements stir sediment to the water column, this water commonly contains a relatively high concentration of suspended matter as well as organisms, whether as eggs/cysts, larvae or full-grown individuals, from bacteria to small fish. As the ship may travel a long distance before it loads new cargo, and consequently discharges its ballast water, it may happen that the organisms contained in the ballast water tanks are released alive to a new environment where they may thrive but where they are non-indigenous. Even if ballast water would be exchanged along the voyage, the complex internal structure of a ballast tank allows many locations for sediments and organisms to become trapped and accumulate over several voyages. Due to the large volumes of ballast water transported around the world, species introductions are common. As some of the introduced species become invasive in their new environments, species introduction and spread may pose substantial threats to marine biodiversity but also economy and health. Consequently the introduction of invasive species via ships ballast water has been identified as one of the four greatest threats to the world s oceans and to biodiversity globally (REF). The characteristics of the Baltic Sea as a relatively young brackish water Sea with intense maritime traffic makes it prone to entrance and settlement of non-native species present in ships ballast water By 2016, 80 non-native species, 59% of the total more than 130 observations, have been documented to settle permanently in the Baltic as a result of ship-vector introductions (ballast water but also hull fouling) (Ojaveer et al. 2017). Over time, the central introduction pathways of non-indigenous species, both in terms of primary introductions and secondary spread from nearby areas, have been shipping (38.6%), then stocking (27.5%) and natural spread (24.8%) (Ojaveer et al.2017). Ballast water and invasive species introductions in the Baltic Sea Ballast water is assumed to be one of the main pathways of non-indigenous species introductions to the Baltic Sea marine environment (REF). Ballast water exchange in the Baltic Sea Bulk cargo ships and tankers are the ship types which carry the largest amount of ballast water. Even if no quantitative estimations are available on the volumes one can use the movement patterns of these ship types as a kind of proxy to illustrate the movement of ballast water to, from and within the Baltic Sea (Figure XX). 61


63 Figure 5.0: Movements of ships (cargo and tankers, based on AIS data) from outside the Baltic Sea and between the 50 biggest Baltic Sea ports in term of trips (on the left). The figure is only showing when there are more than 50 trips from outside the Baltic Sea to a certain port or between two ports. The figure on the right shows the traffic only between the ports of the Baltic Sea (50 biggest ports, more than 50 trips betweent these locations) Alien species introductions to the Baltic Sea via ships In order to have an overview of species introductions over time, a comprehensive list of non-indigenous, cryptogenic and harmful native species introductions in the Baltic Sea has been compiled and updated by HELCOM since Lately updates have been carried out as part of the work to develop a HELCOM core indicator for non-indigenous species (HELCOM 2017). Based on this data the development of alien species introductions over time is presented in Figure 5.2 and 5.4 below. 62

64 Figure
65 Figure 5.4 Regulation related to Ballast water and invasive species in the Baltic Sea The 1992 Helsinki Convention Invasive species are not explicitly mentioned in the 1992 Convention but the issue falls under the provisions on biodiversity (Art. 15) and those on pollution from ships (Art. 8). In order to address this threat to the biodiversity of the Baltic Sea, the coastal countries have early on cooperated within HELCOM for a harmonized implementation of the 2004 Ballast Water Management Convention (BWMC) of the International Maritime Organisation (IMO) in the Baltic Sea area. This kind of regional work is foreseen in article 13 of the IMO BWMC. Besides monitoring of new introductions these actions have included regional measures such as recommendations regarding ballast water exchange, definitions of target species and regional procedures for estimating the risk of introductions of ship voyages. As a first milestone the Contracting Parties to HELCOM agreed in 2007 upon a Road Map in order to structure the joint efforts towards ratification of the BWMC. A new roadmap was adopted in 2016 after most of the actions in the original document had been completed. The 2004 IMO Ballast Water Management Convention (BWMC) In order to prevent, minimize and ultimately eliminate the transfer of harmful aquatic organisms and pathogens (HAOPs) through the control and management of ships ballast water and sediments, the BWMC was adopted by the IMO in 2004, providing the international regulation framework to face this global marine pollution threat. It aims to reach its goal through the control and management of ships Ballast Water and Sediments. The detailed provisions require ships in international traffic to manage their ballast water and sediments (Regulation B-3) to certain standards specified in the Convention (Regulation D-2), documented in an international ballast water management certificate. Further the ships are required to keep a ballast water record book which documents uptake and release of ballast water. The IMO BWMC will enter into force on 8 September However, there is a phase-in period after the entry into force to enable ships to implement their ballast water and sediment management plan. During this period there is also the option to exchange ballast water in the open sea under certain premises of depth and distance from the shore (Regulation D-1). However, as no such areas have been identified in the Baltic Sea, ballast water exchange is not required (or even recommended) within the region. [Table with final BWMC implementation schedule NOT YET AVAILABLE] The BWMC has been organized in five sections (General Provisions, Management and control requirements for ships, Special requirements in certain areas, Standards for ballast water management and Survey and certification requirements for ballast water management) with technical standards and requirements for the control and management of ship s ballast water and sediments. Due to the challenges in implementing this complex Convention which involves aspects of marine biodiversity, engineering and socio-economic trade-offs, the IMO, through its Marine Environmental Protection Committee (MEPC), has developed a permanently updated set of fifteen technical Guidelines with the aim of helping stake holders on the implementation of the Convention. 64
66 Even if IMO Guidelines reflect consensus at IMO level, and are thus highly authoritative, they sometimes lack all the details needed for harmonised implementation in a specific region like the Baltic Sea. Such detail can, and has been, provided through HELCOM regional cooperation. Ballast water treatment According to the BWMC, ballast water has to be managed in order to fulfil the D-2 Standard that allows it to be discharged into the sea. In most cases, a treatment of the ballast water will be needed to reach the standard. The Convention does not provide specific requirements regarding treatment methods. However, treatment systems have to be type approved following the IMO guidelines (G8), and moreover, technologies that make use of active substances should be also approved by the MEPC of IMO (according to guidelines G9). For that purpose, there are different methods of treatment and hundreds of IMO type -approved and available commercial solutions for installation on board. Most systems commercially available comprise two stages of treatment with a physical solids-liquid separation, followed by disinfection. Regional ballast water exchange recommendations The IMO Guidelines G6 provide specific depth and distance from the shore requirements for ballast water exchange (BWE). Ballast water can only be discharged at least 200 nautical miles from the nearest land and in water at least 200 meters in depth, and if it is not possible as far as from the nearest land but at least 50 nautical miles from the nearest land and in water at least 200 meters in depth (Regulation B-4). These depth and distance from the shore requirements cannot be met anywhere in the Baltic Sea. For such cases, according to the Convention, special areas for BWE could be designated following IMO Guidelines (G14). However, HELCOM has concluded that most of the alien species in the Baltic Sea have a wide tolerance in salinity, so therefore, it was agreed that BWE was not a suitable option within the Baltic Sea. Instead, there has been an effective cooperation on ballast water exchange between HELCOM in the Baltic Sea, the OSPAR Commission for the North-east Atlantic and the Barcelona Convention in the Mediterranean Sea. Three voluntary interim guidelines have been agreed indicating where ballast water is to be exchanged in the combined sea area covering the Baltic Sea, North-East Atlantic and the Mediterranean Sea, depending on the route of the ship (Figure X not available). These regional Ballast Water Exchange Guidelines can be summarised as follows: General Guidance on the Voluntary Interim Application of the D-1 Ballast Water Exchange Standard in the North-East Atlantic (named G1 in Figure 5): jointly adopted by HELCOM and OSPAR countries and applicable from 1 April According to them, vessels transiting the Atlantic or entering the North-East Atlantic from routes passing the West African Coast are requested to conduct, until entry into force on a voluntary basis, BWE before arriving at the OSPAR area or passing through the OSPAR area and heading to the Baltic Sea. Similarly, HELCOM and OSPAR countries agreed that vessels leaving the Baltic and transiting through the OSPAR maritime area to other destinations will be requested, starting from January 2010, to discharge their ballast water until the vessel is 200 nm off the coast of North West Europe in waters deeper than 200 m, with the aim of avoiding BWE within HELCOM and OSPAR areas (named G2 in Figure 5). This agreement adopted the form of General Guidance of voluntary application. Additionally, a Joint Notice to Shipping Industry and the Instructions to Surveyors on both Guidelines was developed for their use by HELCOM and OSPAR countries19. 65
67 General Guidance on the Interim Application of the D-1 Ballast Water Exchange Standard by Vessels operating between the Mediterranean Sea and the North East Atlantic and/or the Baltic Sea 20 (named G3 in Figure 5), applicable since 1 October 2012, it recommends that vessels should exchange all their ballast tanks at least 200 nm from the nearest land in water at least 200m deep, as soon as they enter or leave the North-East Atlantic, depending on the direction of their route, but outside the Mediterranean Sea. All these Guidances have an interim character and they will no longer apply when a ship is in a position to apply the D-2 Standard of the BWMC, or latest when the Convention comes into force and a ship has to apply the D-2 Standard. [Figure: Regional ballast water exchange requirements not yet available] Effective exemptions as a way to avoid regional spread Under certain low risk conditions the BWMC Regulation A-4 enables parties to grant exemptions to any requirements to apply regulation B-3, on ballast water management for ships, or regulation C-1, on measures additional to those in Section B of the convention. The IMO Guidelines for risk assessment under regulation A-4 of the BWM convention (G7) specify general features of these applications. It is clear that uncoordinated implementation of such exemptions is a risk to reach the aim of the convention eliminating introduction and spread of alien species via ballast water. In order to ensure a transparent and harmonised implementation of exemptions, the HELCOM and OSPAR commissions agreed together on more comprehensive and detailed joint harmonised procedures on A-4 exemptions in October The agreed procedure is fully in line with IMO guidelines and specifies further the applicable features of BWMC A-4 exemptions in the combined HELCOM and OSPAR marine area. As a first step, and core, of A-4 applications in the region port surveys of alien species and physical parameters in the ports concerned should be carried out. This should be carried out following the port survey protocol described, or get access to the results of such surveys done by others. This information should cover each stopover port on the route for which the exemption is applied. Through operational tests the agreed methodology has been optimised to ensure reliable and comparable results with minimal costs. As a feature introduced to further ease the burden and costs involved the port surveys carried out according to the joint guidelines are regarded as valid for re-use during a period of maximum of five years. As a second step the applicant should submit the port survey data to a joint regional HELCOM-OSPAR database ( established with the joint guidelines, and run an online risk assessment on the data. The risk assessment is based on matching the lists of species found in the stopover ports, a risk assessment algorithm and list of target species included in the joint guidelines and the tolerances of target species to environmental parameters. The adopted approach is thus a combination of the target species and environmental profiling approach mentioned in IMO G7. Finally the applicant should attach the results of the risk assessment to an application fulfilling other national requirements and submit for the consideration of port states. As the BWMC opens additionally for exempting ballast water management altogether for voyages involving ballast water uptake and release in the same location, but does not provide an exact definition of the 66
68 extent of such locations, this issue has also been considered in regional discussions but without any regionally harmonized conclusions. Future perspectives DNA barcoding to cut costs of alien species monitoring Monitoring the presence of alien species is a challenging task. Besides sampling it needs taxonomic expert knowledge for reliable species identification. Modern DNA barcoding technologies have enabled the identification of species from larvae and other traces found in the water. This offers the opportunity for the identification of the presence of species from e.g. water samples. However, this approach is based on DNA libraries -which are not always available for rare species. For future routine applications there is still considerable research need. Cooperation of HELCOM member states will increase the opportunity for the future implementation of the methods. Reception facilities for ballast water sediments in ports The provision of adequate reception facilities for sediments in ports and terminals where cleaning and repair of ballast tanks occurs based on IMO Guidelines G1 is included in the previously mentioned HELCOM s Road Map. Ballast water free ship designs Ballast water free designs are emerging with various technical solutions to avoid intake of ballast water altogether by innovative ship design. References Ojaveer H., Olenin S.,Narščius A., Florin A.-B., Ezhova E., Gollasch S., Jensen K.R., Lehtiniemi M., Minchin D., Normant- Saremba M., Strāke S., Dynamics of biological invasions and pathways over time: case study of a temperate coastal sea. Biological Invasions 19 (3),
69 07. MARINE LITTER FROM SHIP BASED SOURCES Introduction Marine litter is defined as any persistent, manufactured or processed solid material discarded, disposed of or abandoned in the marine and coastal environment (UNEP, 2009). Also in the Baltic Sea marine litter is increasingly identified as an important type of marine pollution. While marine litter is found in all the seas of the world, questions on amounts and pathways are still uncertain (Veiga et al., 2016). Even it is commonly concluded that land based sources predominate in the region (e.g. Arcadis 2013), accidental or deliberate discharge of galley or cargo waste from commercial ships, fishing vessels and gear as well as recreational boating remain one source of marine litter. Deliberate disposal of such waste to the sea, whether from normal operation from a ship or sources on land, is called dumping and has been illegal in the Baltic already since 1980s (London Convention, MARPOL Annex V) and the rules have been further tightened during the last decade. In order to minimise incentives for dumping, port reception facilities for Annex V waste in Baltic Sea ports were among the early focus areas of HELCOM work. Even if regulations are thus in place determining any trends in the level of compliance is a challenge for this type of waste. Much of the dumped material sinks and as the floating fraction is usually relatively small in size -and thus difficult to spot at sea. The floating fraction becomes visible only when accumulating on the shore or on the seabed, but at that point practically impossible to link to the source. Eventual infringements are thus largely depending on first hand reports from crew even if port state control inspections may also, in some cases, observe deviations in protocols. Over half of the marine litter in the Baltic Sea is believed to consist of plastic materials in line with the worldwide predominance of plastics amongst the marine litter (from 60% to 80%). (Gregory & Ryan, 1997). Ultimately this is based on the rapid increase in the use of plastic for consumer goods and packaging since the early 20 th century. The global plastic production continues to increase, increasing from 230 to 322 million tonnes during the period Plastic litter provides a particular challenge as most types of plastics are not bio-degradable in the traditional sense of the word. Instead they weather over time due to exposure to UV-light, oxygen, elevated temperatures and mechanical stress to smaller and smaller pieces, eventually reaching microscopic dimensions (UNEP, 2015). Due to its omnipresence this resulting micro plastic waste has been observed to accumulate in food webs as it is ingested by various microscopic and larger organisms (Hollman et al., 2013). Also larger pieces of marine litter deteriorate habitat quality and can cause direct harm to animals when they become entangled or ingest the litter. Marine litter from ship sources in the Baltic Sea Once litter is introduced in the marine environment it can be transported long distances by water currents, and sink and accumulate on the seafloor far away from its original source. Recent reviews indicate that the density of macro-scale (>2 cm) litter items is higher on the seafloor than floating on the sea surface (Galgani et al., 2015), suggesting that a large part of the total amount of litter in the marine environment is deposited on the seafloor. Among litter deposited on the seafloor, abandoned, lost or otherwise discarded fishing gear (ALDFG) is of special relevance in the Baltic Sea. To give a figure: the catching efficiency of lost gillnets amounts to approximately 20% of the initial catch rates after three months, and around 6% after 27 months (WWF Poland, 2011). 68
70 As reliable aerial or satellite surveillance of litter at sea is still in its infancy, beach litter monitoring is currently the main potential source of information to follow the amounts of marine litter in the Baltic Sea. Updated data for the Baltic Sea region is currently available covering with the time period either or for eight countries, and gives a snapshot on the spatial distribution of marine beach litter along the coastline in the basins of the Baltic Sea (cf. Figure 1). Figure 1: The distribution of marine litter items on the beach in different basins of the Baltic Sea, using available data from Denmark, Estonia, Finland, Germany, Latvia, Lithuania, Poland and Sweden for the years 2012 to Because the period for litter monitoring and the number of the monitoring sites varies between countries, all data have been recalculated and presented as the average number of litter items per 100 m of the beach. The litter is divided into eight regionally agreed litter categories Plastic is clearly the most common litter material, followed by paper, processed wood, metal and ceramics (cf. Figure 2). The amounts of litter items on the beach are highest during spring for most types of litter materials for the Baltic Sea, although there are differences between countries. Most of the litter items are found in the western Baltic Sea and in the Northern Baltic Proper, while wooden litter items are recorded mostly in the Central and Northern Baltic Sea. The spatial differences are influenced by local human activities but also by the level of beach cleaning. In addition, the shape of the coastline and the direction of water currents appear to play an important role in determining where litter is accumulated. Figure 2: Proportions of litter items in the eight regionally agreed litter categories, based on the average number of litter items per 100 meter beach in the Baltic Sea. 69

71 The available data is not yet sufficient to evaluate the trend in beach litter over time for all basins. It is anticipated that the longest available data series will be used for further analysis and baseline determination. if, with the aim of establishing a comparison with other seas areas, compare previous data as contained in Tables 1 with the OSPAR area, it can be observed that even if beach litter is in general much lower than in that area, this does not necessarily automatically indicate less littering or, for sea based sources, better compliance with MARPOL Annex V, London Convention and other regulations in the Baltic Sea. The near absence of currents in the Baltic Sea may leave more litter deposited on the seabed instead. The amount of sea bed litter in the Baltic Sea has been observed to be much higher. However, it has been argued that the Baltic No Special Fee system has likely been effective and reduced incentives to dump waste with a similar effect as can be documented for oily wastes (Chapter X). Table 1 - Amounts of litter in the Baltic Sea and in the North East Atlantic 70
, with the understanding that")
72 Additionally, and through the on-going development of the indicator on litter on the seafloor, data on litter on the seafloor is being collected. This occurs systematically only since 2015 as part of the Baltic International Trawl Survey, coordinated by the international council for exploration of the sea (ICES), with the understanding that seafloor litter can be measured alongside fish, using trawling surveys. Unfortunately, trawl survey covers areas from the Northern Baltic proper and south, but there is no Balticwide trawl survey and shallow water areas are not covered. Regulations 1992 Helsinki Convention and Recommendations Besides generally urging to comply with MARPOL Annex V, the 1992 Helsinki Convention Annex V includes Regulation 6 on Mandatory discharge of all wastes to a port reception facility. It requires that before leaving port ships shall discharge all ship-generated wastes, which are not allowed to be discharged into the sea in the Baltic Sea Area in accordance with MARPOL and the 1992 Helsinki Convention, to a port reception facility. In addition the same Regulation requires that all cargo residues shall be discharged to a port reception facility in accordance with MARPOL. The HELCOM No Special Fee Recommendation (HELCOM Rec. 28E/10) applies to garbage as well as litter caught in fishing nets in addition to oily wastes from machinery spaces, sewage disposal. According to the no-special-fee system, a fee covering the cost of reception, handling and final disposal of ship-generated wastes is levied on the ship irrespective of whether or not ship-generated wastes are actually delivered. The fee is included in the harbour fee or otherwise automatically charged from the ship. Even if this is in many cases implemented with limits in terms of waste amounts in the Baltic Sea ports, some Annex V waste is practically always included in the obligatory waste fee. The Helsinki Convention prohibits also all incineration of ship generated waste within the territorial seas of the Baltic Sea coastal countries. 71
73 In 2015 HELCOM adopted revised Guidelines for Management of Dredged Material at Sea for the purpose of regulating disposal of dredged materials at sea, which is allowed provided specific provisions are complied with. Finally, HELCOM Recommendation 36/1 on the Regional Action Plan for Marine Litter contemplates regional actions to address shipping related waste (RS 1, RS 2 and RS 3), waste delivered in ports/marinas (RS 4) as well as fishing and aquaculture (RS 5 RS 9) as well as remediation and removal measures (RS 10 - RS 12) MARPOL Annex V and the Baltic Sea Special Area MARPOL Annex V aims to prevent pollution from ship generated waste, as waste generated on land and dumped at sea is covered by the London Convention (see below). MARPOL Annex V was originally adopted in 1973, in effect in 1988, and was last amended in 2011 (entered into force 2013). MARPOL Annex V defines ship-generated waste as: Food waste; Cargo residues contained or not contained in wash water; Cleaning agents and additives contained or not contained in wash water; Animal carcasses; and All other waste including plastics, synthetic ropes, fishing gear, waste bags, incinerator ashes, clinkers, cooking oil, floating dunnage, lining and packing materials, paper, rags, glass, metal, bottles, crockery and similar refuse. According to the latest amendments discharge of all waste generated during the normal operation of the ship is prohibited at sea. The exceptions of the general provisions are food waste, cleaning agents and additives in cargo wash waters, cleaning agents and additives in deck wash waters, animal carcasses as well as certain types of cargo residues. Besides the Annex itself, IMO also revised guidelines for implementation which were adopted in 2012 (IMO 2012). [IMO _2012_2012 Guidelines for the implementation of MARPOL Annex V. Resolution MEPC.219(63) adopted on 2 March The Baltic Sea was designated as a MARPOL Annex V special area already in 1973 (in effect from 1 October 1989). Based on this status the discharge of Annex V waste from a ship in the Baltic Sea area is more restricted than the general provisions above. The only allowed discharges are the following if resulting from normal operation and discharged outside 12 nm: ground or comminuted food waste, cargo residues and cleaning agents in cargo hold wash waters as well as deck cleaning agents in deck wash waters. In addition to these discharge prohibitions, the MARPOL Annex V requires every ship of 400 GT or larger which are engaged in international voyages to carry a Garbage Record Book. All waste disposal or discharge events the ship is engaged in must be recorded in detail in this document. Further, every ship of 100 GT, and/or certified to carry more than 15 passengers, is required to have a garbage management plan -which specifies procedures the crew must follow for compliance. London Convention and Protocol The "Convention on the Prevention of Marine Pollution by Dumping of Wastes and Other Matter 1972", the "London Convention" for short, has been in force since 1975 and aims to effective control of dumping of 72
74 wastes and other matter to the marine environment. It includes a lists of waste items for which dumping is not allowed or restricted. All the Baltic Sea countries except Latvia and Lithuania have ratified the 1975 London Convention. The Convention was supplemented by the London Protocol in 1996 which tightens the regulations of the original 1975 Convention by generally prohibiting all dumping except for a reverse list of possibly acceptable wastes as well as prohibiting at sea incineration of waste which is not ship generated. In the Baltic Sea countries Denmark, Germany, Estonia and Sweden have ratified the 1996 London Convention protocol. Port Reception of MARPOL Annex V waste in the Baltic Sea Port reception fees are important element in work to minimise illegal discharges. Already during the 1990s the coastal countries developed and agreed within HELCOM that 100% indirect fee, the No Special Fee, should be applied in the region in order to avoid incentives for illegal discharges. As ships have to pay for waste handling regardless of use this removes a major reason for illegal dumping. The existence of a regional practice in terms of fees as in the Baltic Sea is not available elsewhere in Europe. Even if there is some heterogeneity in actual implementation, which in many cases includes limits to the amounts of waste which is possible to deliver under the indirect fee, this measure has likely had a major role in promoting the use of PRFs for ship generated wastes in the region and thus reducing dumping. Information on MARPOL Annex V waste reception facilities in ports of the Baltic Sea States can be found in the IMO Global Integrated Shipping Information System (GISIS) on Detailed waste discharge procedures and arrangements for specific ports are described in waste management plans elaborated by the ports. As mentioned above some form of no special fee is applied in nearly all ports in the Baltic Sea. To ensure the use and efficiency of the port reception facilities, an information sheet must be forwarded to the next port of call 24 hours in advance of the intended use of a port reception facility or, if the voyage takes less than 24 hours, on departure from the previous port. If the ship s next port of call is determined less than 24 hours before arrival thereto, the notification shall be submitted immediately upon determination of the next port of call. The sheet must include the following information: the capacity of the waste storage tanks/bins on board; the amounts of wastes delivered at the last port of call; and the estimated amounts of wastes to be delivered at the next port of call. Enforcement and compliance The major challenge when it comes to enforcement and prosecution of MARPOL Annex V violation is the difficulties related to collecting sufficient evidence for the illegal discharge evidence that clearly connects a specific ship to a detected discharge beyond reasonable doubt. This is less related to the legislation or implementation of MARPOL Annex V, but to the challenging nature of Annex V waste which makes dumping very difficult to detect compared to e.g. oil discharges for which effective aerial and satellite surveillance is in place. Connecting a ship to waste incident is only possible unless the discharge/violation is observed red handed by whistleblowers on board, aircraft or passing vessels, documenting the incident by video or photos. The 73
75 difficulties in gathering evidence at sea underlines the importance of port enforcement and to look into possible ways of taking away any financial incitement to discharge litter or garbage into the sea. As the Baltic Sea no special fee has largely addressed the financial incitement issue, enforcement measures in ports of call are practically the main available measure to improve compliance. These measures include using track ship waste delivery record to identify possible offenders, which would require ship-specific statistics of waste delivery, or more effective Port State Control inspections. The difficulty of prosecuting discharges can be illustrated by the answers to questionnaires circulated by HELCOM Secretariat on Annex V related infringements and the resulting administrative fines. Only 10 cases of illegal dumping of ship generated waste were successfully prosecuted by the Baltic Sea countries during During the same period around 200 violations related to administrative procedures (e.g. failures in keeping garbage Record Book or having an updated Garbage Management Plan) and 74 other MARPOL V related cases ended up in fines for the ships. The administrative fines issued in these cases were further low, usually in the order of euros per case. However, in many countries such fines are followed by criminal sanctions -which are usually considerably higher. Future Perspectives Rewarding green practices by reduced port fees A weak point of the no special fee approach to port reception is that it does not reward for implementation of advanced on-board waste minimization and handling. Fee reductions from advanced on-board waste minimization and handling by green shipping indices/certificates in relation to Annex V waste handling (e.g. implementation of ISO 21070) has been proposed as one way to promote good practices on board. However the financing of such schemes remain a question mark. Further, as different sorting categories on board and the sorting categories in ports. In some cases due to the different categories used, waste is not recycled on land but end up treated as mixed waste, even if sorted on board. This could be addressed by studying further the potential in developing a harmonized scheme of sorting to bridging the IMO practices and realities of on shore waste handing. Improving statistics on ship generated waste The exact quantification of trends in waste delivery and thus the efficiency of measures like the No special fee is difficult due to the lack of statistics. This is due to the fact that waste handling in Baltic Sea ports, and also ports Europe wide, is carried out by different shades of cooperation between port authorities and waste handling companies and also involving differences within countries due to diverging municipal practices. Due to the involvement of various private actors waste statistics is simply not available regionally in the Baltic Sea, or commonly even nationally. Improving waste statistics, both on waste produced on board ships and waste delivered to PRF facilities, is crucial to enable more advanced technical work on improving port reception facilities and their use. This should include statistics of not only big commercial ports but also on smaller fishing ports which tend to fall outside the national systems in place for larger ports. 74
76 Improving remote sensing of marine litter, especially plastic Optical observations, Imaging spectroscopy, Synthetic Aperture Radar (SAR) and Raman spectroscopy (new technology able to find subsurface floaters) have all potential uses in remote sensing of marine litter, particularly plastic (NASA 2017). These tools can naturally be mounted on other vessels than satellites, including surveillance aircraft and ships, be mounted on the shore or even be used in handheld devices. However, application of these methods to remote sensing of plastic marine litter would require work calibrating/validating sensor signals, translating measurements to be comparable with in situ data, and efforts in correcting signal bias London Protocol ratifications in the Baltic Sea Of the Baltic Sea countries Finland, Latvia, Lithuania, Poland, and the Russian Federation have not ratified the 1996 London Convention protocol. Dredged material and plastics and marine litter Additionally, the London Convention adopted in 2016 the recommendation to encourage action to combat marine litter (para and Annex 6 of document LC 38/18) as well as encouraged Parties to take into account the issue of plastics and marine litter when applying the dredged material waste assessment guidance (para of document LC 38/18). References: M., Gutow, L., Klages, M Marine Anthropogenic Litter Eds. ISBN: (Print) (Online). Gregory, M.R. & Ryan, P.G Pelagic plastics and other seaborne persistent synthetic debris: a review of Southern Hemisphere perspectives. J.M. Coe, D.B. Rogers (Eds.), Marine Debris Sources, Impacts and Solutions, Springer-Verlag, New York (1997), pp Hollman P.C.H., Bouwmeester H. & Peters R.J.B Microplastics in the aquatic food chain; Sources, measurement, occurrence and potential health risks. Wageningen, RIKILT Wageningen UR (University & Research centre), RIKILT report Plastics the Facts An analysis of European plastics production, demand and waste data PlasticsEurope. UNEP, Biodegradable plastics and marine litter - Misconceptions, concerns and impacts on marine environments. UNEP, UNEP. (2009). Marine litter: A global challenge. Nairobi. Veiga, J.M., Fleet, D., Kinsey, S., Nilsson, P., Vlachogianni, T., Werner, S., Galgani, F., Thompson, R.C., Dagevos, J., Gago, J., Sobral, P. and Cronin, R.; 2016; Identifying Sources of Marine Litter. MSFD GES TG Marine Litter Thematic Report; JRC Technical Report; EUR 28309; doi: / WWF Poland. (2011) Ecological effects of ghost net retrieval in the Baltic Sea. Pilot project: collecting ghost nets. Final report. ISBN:
77 NASA_2017_ Remote sensing of marine debris to study dynamics, balances and trends_ 76
78 08. UNDERWATER NOISE FROM SHIP BASED SOURCES Introduction Sound created under water spreads on average 4.5 times faster than in air and especially low frequency sounds can be heard over much greater distances. Human generated underwater noise can have both short and long-term negative consequences on marine life. Underwater noise can be categorised into continuous noise, including e.g. noise from ship engines or sonars, and impulsive noise, e.g. pile driving or seismic airguns used in oil and gas exploration. Impulsive sound may displace animals, as they are scared away from the area, and can also cause temporary or permanent hearing loss whereas one concern regarding human generated continuous sound is that it may mask animals communication and signals used for orientation. Maritime traffic is one of the sources of continuous underwater noise. The recent mapping of continuous underwater noise in the Baltic Sea shows that ship traffic is the main source of noise for lower frequencies audible for marine animals. However, its impact on the marine life at a population level in the Baltic Sea are unknown. The primary sources of underwater noise in a ship are associated with propellers, hull form (minimising wake), on-board machinery, and operational aspects (e.g. optimum speed for low noise levels). As many of the key parameters are difficult to influence on existing ships, the most efficient mitigation of underwater noise from ships seems to be attention during initial ship design. Additionally, speed reduction as well as temporal or geographical restrictions can also be effective means to mitigate noise from shipping (Weilgart, 2007; Merchant et al., 2012). Noise from shipping in the Baltic Sea Soundscape maps for the Baltic Sea have been developed in the frame of the BIAS project based on hydrophone data modelled for that purpose. Particularly the maps of the lower frequencies (63 and 125 Hz) highlight the role of ship traffic (see maps below). These frequencies are within the audible range of noise sensitive species (see Figure 1 and 2). Figure 1: MAPS Soundscape maps in the Baltic Sea, showing ambient underwater continuous sound at 1/3 octave frequency bands of 63 Hz, 125 Hz and 2000 Hz. Areas with high noise level overlap clearly with the location of major shipping routes. The noise from shipping is within a frequency interval that overlaps with the hearing range of several species. The results have been extracted with help of the soundscape planning tool of the BIAS project Figure 2: Auditory range of some marine species and sound frequencies generated by human activities in the Baltic Sea. The frequency bands monitored within BIAS and included in maps XX-YY are indicated by red squares. Human hearing is provided as a reference. After Scholik-Schlomer (2015) adjusted to Baltic Sea conditions. 77

79 Regulation related to underwater noise from ships in the Baltic Sea Underwater noise, especially continuous noise from sources like ships, is a relatively new issue which is poorly, if at all, covered by the existing framework of international environmental law Helsinki Convention Noise is not covered explicitly in the Helsinki Convention but, in addition to general provisions, the definition of pollution to be reduced by the Contracting Parties includes introduction of energy, which includes noise. 78
80 IMO Guidelines on reduction of noise from shipping IMO adopted 2014 the non-mandatory guidance document Guidelines for the reduction of underwater noise from commercial shipping to address adverse impacts on marine life to advice designers, shipbuilders and ship operators. It remains the only dedicated IMO instrument on reducing noise from ships. Ship design to reduce noise The IMO guidelines list a number of design and operational measures which may be used to reduce noise from ships. For the purposes of illustration some of these are described below. Design aspects: Propeller cavitation, hull design and machine vibrations Much of the underwater noise from ships is caused by the physical phenomenon called propeller cavitation. Propeller cavitation is the formation and implosion of gas bubbles on the backside of propeller blade due to the pressure differences created by propeller rotation and movement through water. The implosion of these bubbles result in hammer like hits to the backside of the propeller which create propeller noise. Propeller cavitation is, besides a source of underwater noise, also an undesired feature in terms of fuel efficiency and longevity of the propeller. Minimising this phenomenon is thus a potential measure with both economic and environmental benefits. Cavitation can be reduced under normal operating conditions through good design, such as optimizing propeller load, ensuring as uniform water flow as possible into propellers (which can be influenced by hull design), and careful selection of the propeller characteristics such as: diameter, blade number, pitch, skew and sections. Minimising fouling of propeller and underwater hull also help to reduce propeller cavitation and thus noise. During installation of on board machinery vibrations from diesel or LNG engines can be reduced by appropriate cushioning (mainly four stroke engines). Due to their nature electric engines have inherently lower vibration levels. Operational aspects When possible, ship speed can be optimised for lower noise (depending on ship design). Further, in some cases known areas with highly sensitive species can be avoided by route selection. Future perspectives Studies on the effects of ship noise on marine life The impacts of continuous noise from ships on the population levels of marine life in the Baltic Sea is relatively unknown. Further studies, following the study on noise sensitivity of animals in the Baltic Sea, recently conducted in HELCOM, could be used to document any concrete effects. 79
81 Promoting use of IMO guidelines in ship design The existing IMO guidelines as well as some other documents, such as the ICES CRR 209 noise specification for research vessels, include guidance on how to implement noise reducing designs. Voluntary incentives could be considered to promote the use of these available technologies. References: HELCOM 2016 Noise Sensitivity of Animals in the Baltic Sea. Document to HOD Hildebrand, J. A Impacts of anthropogenic sound. in: Reynolds, J.E. et al. (eds.), Marine mammal research: conservation beyond crisis. The Johns Hopkins University Press, Baltimore, Maryland, pp Merchant, N. D., Witt,M. J., Blondel, P., Godley, B. J., Smith G. H Assessing sound exposure from Shipping in Coastal Waters Using a single Hydrophone and Autonomic Identification Systems (AIS) Data. Marine Pollution Bulletin, 64: Pollara, A.S., Sutin, A., Salloum, H Feature extraction for acoustic signatures of small boats. The Journal of the Acoustical Society of America, 140(4): Weilgart, L. S The impact of anthropogenic ocean noise on cetaceans and implications for management. Can. J. Zool. 85:
82 09. ANTI FOULING SYSTEMS Introduction Biofouling is the growth of marine and aquatic organisms on submerged surfaces. This includes vessel hulls where it increases drag, leading to a higher fuel consumption and higher CO2 emissions. Biofouling may also reduce manoeuvrability and increase corrosion and may, like ballast water, result in transportation and introduction of invasive non-native species. Biofouling is also an issue in other maritime activities, including Aquaculture. As attached forms marine life in the cold and brackish Baltic Sea are small, and relatively slow growing, biofouling is a much smaller issue here than in fully marine environments. However as many ships in the region sail also outside the Baltic they need to be prepared for more aggressive forms of biofouling. Historically, various methods have been used for preventing biofouling on ship hulls including copper and lead sheets, tar or lime (CaO). However, since the 1960s dedicated antifouling paints have been the most commonly used method to prevent biofouling. Antifouling paints include traditionally active substances, toxins, preventing settling and growth. These active substances may be an environmental hazard on their own right, especially in docks and other areas where such paints are frequently removed or applied. Tributyltin tin (TBT) paints were introduced on the market in the 1960s, proved to be very efficient. However, after it was by 1980s discovered that TBT accumulates in food webs and causes widespread malformations and imposex (feminisation of males) of marine fauna also outside main shipping areas, TBT was successively banned from antifouling paints. Globally TBT was addressed by the 2001 IMO AFS Convention (in force 17 September 2008). After the ban of TBT most antifouling paints used today include copper (Cu2O, CuSCN or metallic copper) as the active ingredient, with various biocides sometimes used as boosters -some of which have been banned nationally. Even if the use of copper in antifouling paints is considered less problematic for the environment than TBT, it is still a pollutant. The use of copper in antifouling paints is today the main source of diffuse copper input to the marine environment [in Sweden] [Baltic Sea]. Especially in the Baltic Sea, where biofouling is relatively light, the available, and emerging, alternatives to copper paints, such as foul-release paints, bio-mimicing surfaces and in water hull cleaning, as well as optimising copper content could be explored further to reduce load of copper from antifouling paints. In absence of major technological breakthroughs, balancing between the environmental and economic gains of antifouling (significant reduction in fuel use and thus CO2 emissions, reducing non-native introductions) and the effects from release of copper as main active substance remains a challenge. Anti Fouling systems and the Marine Environment of the Baltic Sea TBT As would be expected from the IMO and EU ban of TBT in antifouling paints, imposex effects are decreasing in the Kattegat and Belt Sea/sound area between Sweden and Denmark, the only part of the Baltic Sea where imposex monitoring data is available. Also current levels of TBT, and its breakdown products dibutyltin (DBT) and monobutyltin (MBT), as such are close to detection limits in pristine areas away from ship routes and 81
83 harbours with historic contaminations. However, sediments are still a source for TBT in harbours and shipping lanes, which can be re-suspended during storms. [Figure 1: Timeseries of the Vas deference Sequence index VDSI from marine gastropods in the Öresund sound during the period EU regulation 782/2003 on TBT was adopted in 2003.] Copper Copper is not assessed in detail in recent HELCOM assessments or indicators, and consequently an updated regional synthesis of copper in the Baltic Sea marine environment is not available to assess the potential effect of antifouling paints with copper as active substance. However, according to a 2010 HELCOM thematic assessment on hazardous substances, sediment concentrations of copper (along with arsenic, cadmium, chromium, cobalt, nickel and zinc) increased from 2003 to 2008 in almost all of the 17 Swedish frequently sampled stations covered by the review (HELCOM 2010). Regulation 2001 International Convention on the Control of Harmful Anti-fouling Systems on Ships (the AFS- Convention). The 2001 IMO AFS-Convention entered into force on 17 September 2008, according to which ships are not allowed to use organotin compounds which act as biocides in their anti-fouling systems. The Convention applies to ships flying the flag of a Party to the Convention, as well as ships not entitled to fly their flag but which operate under their authority and to all ships that enter a port, shipyard or offshore terminal of a Party. All the coastal countries of the Baltic Sea have ratified the AFS Convention. To support the implementation, IMO has adopted several sets of guidelines, namely the "Guidelines for Survey and Certification of Anti-fouling Systems on Ships" (Resolution MEPC.102, 48), "Guidelines for brief sampling of anti-fouling systems on ships" (Resolution MEPC.104, 49) and the "Guidelines for Inspection of Anti-fouling Systems on Ships" (Resolution MEPC.105, 49). 82
84 Guidance is also available for hull cleaning activities including "Guidance on best management practices for removal of anti-fouling coatings from ships, including TBT hull paints" (Circular AFS.3/Circ.3 of 22 July 2009) and relevant sections of the 2011 Guidelines for the control and management of ships' biofouling to minimize the transfer of invasive aquatic species (MEPC.207(62)). According to the Article 11 of the AFS-Convention, a ship may be inspected for the purpose of determining whether the ship is in compliance with the Convention. Such initial inspection covers verification of valid certificates required by the Convention and/or a brief sampling of the ship s anti-fouling system according to Resolution MEPC If there are clear grounds to believe that the ship is in violation of the Convention, a through inspection may be carried out taking into account the IMO Resolution MEPC.105(49) on Guidelines for inspection of anti-fouling systems on ships. EU regulations (applicable for ships and ports of EU member states) Two EC Regulations,transposing the AFS convention to EU law and bind the EU member states: EU Regulation (EC) No. 782/2003 on the prohibition of organotin compounds on ships and Regulation 536/2008, giving effect to Article 7 of the EC Regulation 782/2003. After a phase in period the EC regulations did not allow from 1 January 2008 any ships with an organotinbased anti-fouling system to enter any EU port or offshore terminal and any ship flying the flag of an EU Member State to bear organotin compounds acting as biocides in its anti-fouling systems. Future perspectives Hull biofouling and invasive species Invasive aquatic species are introduced to new environments by ships mainly through ballast water (), but also hull fouling. As a global response IMO adopted the 2011 Guidelines to provide guidance on addressing transfer of non-indigenous species via hull fouling, and as a follow up document the 2013 Guidance for the future review of the 2011 Guidelines. In the Baltic introductions via hull fouling is a less studied topic than introductions via Ballast water. More information on the role of hull fouling as a vector of non-native species introductions could enable a more comprehensive regional approach on invasive species. Optimising copper content of anti-fouling paints Some recent studies point out that the concentration of copper may be further optimised -as some studies show that intended effect can be achieved in the Baltic Sea with lower concentrations than included in many commercial products. In-water hull cleaning Further, new fast methods and services using divers, robots and technological tools like ultrasonic cleaning have emerged for hull cleaning in water, avoiding costly dry-docking. Some of the approaches use filtering and storing the effluents to ensure environmental sustainability. When regularly used these methods 83
85 enable cleaner hulls, and lower fuel consumption, with less use of antifouling paints. However, as mechanical cleaning releases also some of the underlying antifouling paint, and copper, to the water some ports have restricted this kind of wet brushing. Regional recommendations on in-water hull cleaning activities could be explored. Foul release paints and bio-mimicing surfaces Acknowledging the problems in the widespread use of copper, new types of non-toxic antifouling paints and surface coatings are emerging as alternative. The traditional approach to this problem with foul release paints use silicone, fluoropolymers to create a smooth, slippery underwater hull surface which prevents, or weakens, attachment of biofouling organisms. However, currently available products require frequent application-and high operating speeds to be effective. In addition, sheltered parts of the hull need other solutions. Other more recent proposals involve creating a micro-, or nano,-texture for the hull itself to produce a similar effect, mimicking natural materials like shark skin or lotus leaf. A third approach is to use hard hull surface in combination with frequent hard brushing. Technological breakthroughs are needed to successfully mainstream such approaches which can be enabled by technological research funding. References [to be inserted] 84
86 10. MARITIME ACCIDENTS IN THE BALTIC SEA Introduction High level of traffic in combination with regional peculiarities such as narrow passages, wintertime darkness and ice makes the Baltic Sea a challenging area for navigation. Even if safety of navigation is one of the key concern for mariners and ship-owners, maritime accidents happen and the Baltic Sea is no exception in this respect. Statistics on the occurrence of accidents are useful to identify areas where further safety measures could be considered and thus reduce the risk of i.e. environmental damage. For this purpose HELCOM has since 1990s collected a regional dataset on accidents, which is based on reporting by the coastal countries. This has been published in various forms, until recently as annual HELCOM accident reports. Accident statistics is a challenging material to use as its quality depends fully on the level of reporting by companies and, in the case of HELCOM, countries. As reporting practices, persons and databases change over time it is not easy to create a reliable overview of accident occurrence over time in a region like the Baltic Sea, especially if minor accidents are included in the dataset. Nevertheless, by comparing different data sources one can improve the quality of accident data. For the purposes of this chapter an improved time series of HELCOM accident data for the period was created by double checking accidents reported to HELCOM with the Coastal Countries as well as by consulting other available accident databases (EMSA, Lloyds List Intelligence). The dataset covers tanker ships over 150 gross tonnage and other ships over 400 gross tonnage. The resulting dataset includes in total 1520 reported maritime accidents occurred in the Baltic Sea area during the period , occurring at a fairly stable level of 300 accidents per year. Around 4 % of these accidents led to loss of life, serious injuries or environmental damages. Even if accident data is useful it should be kept in mind that it is not self-evident to assume that future accidents will follow past patterns. While trends might look stable, and acceptable from the regulatory point of view, it is in the nature of accidents that they are sometimes difficult to predict, especially catastrophic events. Accidents are generally related to factors such as poor situation awareness, engine failures and vast operating areas, but one unpredictable Black Swan type of event can change commonly held views on accidents. Maritime accidents in the Baltic Sea Accidents in the Baltic Sea According to the revised HELCOM accident statistics, 1520 reported maritime accidents occurred in the Baltic Sea area during the period , occurring at a fairly stable level of 300 accidents per year without major drops or increases. Slightly more 4 per cent of the accidents led to loss of life, serious injuries or environmental damages. 85
. Figure 10.1 86")
87 Spatial distribution As expected these reported accidents cluster around highly trafficked sections of the Baltic Sea, particularly the southwest waters of Denmark, Germany and Swedish west coast (cf. Figure 10.1). Figure

88 Seasonal distribution When the maritime accidents of review period are broken down by month, a clear increase in the accident frequency can be identified from November to March. Ice, darkness and strong winds makes the navigation more difficult during the winter months. Beyond weather conditions, a contributing factor may be the drop in compliance with international regulations during wintertime, observed in Port State Control statistics from the northern Baltic Sea. [cf. figure 10.2] Accident types [cf. figure 10.3] 87
89 The most common type of maritime accident in the Baltic Sea has been for many years grounding or stranding of a ship. During the period from 2011 to 2015 groundings accounted for 21 % of the total number of accidents. Two of the 313 groundings caused also some degree of environmental damages. In this five years period, the number of groundings has been decreasing slightly. Typical contributing factors to these accidents were loss of maneuverability of ship and inadequate situation awareness including anticipation. Machinery damages were the second most common type of maritime accident from 2011 to 2015, which accounted for 18 per cent of the total number of accidents. Two of these 271 events led to environmental damages. During the review period, the number of machinery damages has been increasing slightly. Based on earlier findings, common reasons for these accidents are malfunctions of machinery automation or electricity supply, poorly planned maintenance systems and lac of technical redundancy. Collisions between ships were the third most common type of maritime accident during the review period. They accounted for 16 per cent of the total number of accidents. None of the 244 reported events caused any environmental damages. The number of collisions has been decreasing clearly during the five years period. Typical contributing factors to these accidents were violations of the COLREG rules and poor availability of information between ships. Other noteworthy type of maritime accidents are fires and explosions. Such accidents have received a lot of attention in Europe due to recent increase in the number of ship fires aboard ro-ro passenger ships and their fatal consequences. In the Baltic Sea there were 85 fires or explosions during the review period, which accounted for 5 per cent of the total number of accidents. The number of this type of accidents has been decreasing slightly in the five years period. Based on earlier findings, most of the ship fires originate in engine rooms, followed by cargo areas and accommodations. 88
90 Ship types [cf. figure 4] Cargo ships have been the most common type of accident ships in the Baltic Sea for years. From 2011 to 2015 the number of maritime accidents occurred to this ship type was 616, which accounted for 42 per cent of the total number of accidents. The accident frequency of this ship type is 27 accidents per nautical miles sailed, which is the same as average [cf. figure 5]. 89

91 Most of the cargo ship accidents were groundings. Typical size of the accident ship was from to gross tonnage. When the cargo ship accidents are broken down by year, no significant changes are evident. The main reason behind the quite high number of accidents occurred to this ship type could be found in the safety culture of the shipping companies, as many of them still need plenty of further development. The second highest number of maritime accidents involved passenger ships. During the review period the number of accidents occurred to this ship type was 413, which accounted for 28 per cent of the total number of accidents. The accident frequency of passenger ships is 41 accidents per 10 6 nautical miles sailed, which is clearly above the average. Consequently, changes in the passenger ship s traffic volumes may have a greater impact on the future accident numbers in the Baltic Sea than changes in many other ship types. Most of the passenger ship accidents were machinery damages or contacts with fixed objects, and the typical size of the accident ship was from to gross tonnage [cf. figure 6]. From 2011 to 2015 the number of passenger ship accidents has been increasing slightly. A breakdown of this ship category reveals that accident ships were mainly ro-ro passenger ships. The safety culture of these shipping companies is usually considered to be more developed than an average. Unfortunately, the latest developments do not bode well for the industry. Tankers were the third most common type of accident ships during the review period. From 2011 to 2015 the number of accidents occurred to this ship type was 170, which accounted for 12 per cent of the total number of accidents. The accident frequency of this ship type is 16 accidents per 10 6 nautical miles sailed, which is below the average. Most of the tanker ship accidents were collisions between other ships. Typical size of the ship involved in an accident was from to gross tonnage. When the tanker ship accidents are broken down by year, no significant changes are evident. Most of the accident ships of this main category ware product tankers. The safety culture of these shipping companies is considered to be 90
92 more developed than an average. A part from that, the industry has developed its own vetting process to ensure the safety on these transportations. However, the statistics show that improvement is still needed. References [references to be added] 91
93 11. MEASURES TO IMPROVE SAFETY OF NAVIGATION IN THE BALTIC SEA Introduction Even if safety culture on board ships is perhaps the key factor in ensuring safety of navigation in the Baltic Sea, accidents can be reduced by various safety measures by the coastal states. Thanks to the Helsinki Convention the coastal countries of the Baltic Sea have agreed to legally binding commitments to ensure the prevention of pollution from ships and rapid and effective response to spills. As there is a close relationship between safety of navigation and prevention of pollution from ships this has been an important part of HELCOM work since the very beginning. The early HELCOM work on safety of navigation in the 1970s concentrated on use of pilotage services in the Baltic Sea area and developing a position reporting system for ships. The Declaration on the Safety of Navigation and Emergency Capacity in the Baltic Sea area (HELCOM Copenhagen Declaration), adopted in September 2001 in Copenhagen by Ministers of Transport of the Baltic Sea region, has provided an important long term roadmap for the coastal countries in the field of safety of navigation. More recently the work in this field has, besides collection and analysis of accident data (described in the previous chapter), focused on improving nautical charts in the Baltic Sea through hydrographic re-surveys in cooperation with IHO Baltic Sea Hydrographic Commission (BSHC), providing a regional platform for regional consultations on new IMO routing measures, Recommendations on ice navigation including ships ice classes as well as cooperation on AIS data exchange. Regulations The International Convention for the Safety of Life at Sea (SOLAS 1974) The SOLAS Convention is the central international agreement which was first adopted in1914 (following the Titanic accident), and revised/renewed in 1929, 1948, 1960 and The current convention in force, known as SOLAS 1974, covers various aspects of ship safety, including construction, fire protection, lifesaving appliances, radio communications, safety of navigation, the carriage of cargoes and safety measures for high speed craft. The SOLAS Chapter V is the dedicated section on safety of navigation and covers a wide number of issues. As examples Chapter V regulation 10 (SOLAS V/10) provides that IMO is the only competent organisation to establish ships routeing measures and regulation 19 (SOLAS V/19) makes the carriage of AIS mandatory for certain types of ships. Other IMO instruments As safety at sea is the core of IMO mandate, there is a large number of instruments beyond SOLAS 1974 related to this issue. It does not make sense to attempt covering them comprehensively in this report and the reader is instructed to consult the IMO webpage. Nevertheless, it could be mentioned that the Convention on the International Regulations for Preventing Collisions at Sea (COLREGs 1972) provides the rules of the road at sea obligations concerning maneuvers and the necessary signals and lights and the Convention on Standards of Training, Certification and Watch keeping for Seafarers (STCW 1978) provides minimum requirements of seafarers in terms of education and training. 92
94 1992 Helsinki Convention and HELCOM work As in other maritime traffic related issues HELCOM provides a platform which the Contracting Parties can use for regional consultations on safety of navigation measures to be proposed at, and decided by, IMO. A large part of the 1992 Helsinki Convention Annex IV on ship-based pollution is devoted to regional cooperation to improve safety of navigation in the Baltic Sea region by Re-surveys and ENC, cooperation on AIS, common procedure of accident investigations and places of refuge. The shallow Baltic Sea requires also special caution when calculating ships Under Keel Clearance (UKC). For this purpose the national administrations have worked within HELCOM to develop basic Baltic specific information on determination of a ship s minimum under keel clearance (UKC) to provide safe navigation through sea areas with restricted available depth of water and thus enhancing the safety of navigation and protection of the marine environment. The material is available in the HELCOM Clean Shipping Guide (HELCOM 2017). Improved Nautical Charts and Re-Surveys in the Baltic Sea The availability of reliable nautical charts is a key enabling factor in improving safety of navigation (SOLAS V/4). As with maps on land the openly available nautical charts in the Baltic Sea region were during a long period based on the major historical hydrographic survey campaigns carried out by the coastal states during the expansion period of maritime traffic from mid-1800s to the First World War. The production of more reliable nautical charts (paper as well as electronic), is in most cases only possible through a considerable investment in new re-surveys using modern technology. The work of the hydrographers of the Baltic Sea region and particularly IHO Baltic Sea Hydrographic Commission (BSHC) during the last three decades in carrying out the needed re-surveys has been one instrumental factor in delivering safer navigation in, and thus prevention of accidental pollution of, the Baltic Sea. A major leap forward in this work was taken as an immediate reaction to the Baltic Carrier accident in Ministers of Transport of the Baltic Sea region agreed, in the 2001 HELCOM Ministerial Meeting in Copenhagen on safety of navigation, to develop a scheme for systematic re-surveying of major shipping routes and ports and to start implementation by The national hydrographic offices of the region followed up the decision and developed by 2002 the regional Harmonized Hydrographic Re-Survey Plan, based on estimations of the main routes used by the ships, and started implementation by Besides identifying areas used by ships the plan divided the areas according to their level of traffic to categories I (highest priority), II and III. In July 2005 the Baltic Sea coastal countries launched the, still operational, regional HELCOM AIS network for monitoring maritime traffic in the Baltic Sea, another fruit of the 2001 Copenhagen Declaration. The synoptic and historical AIS information, showing the actual sailed routes of ships in the entire region, made it clear that that there were high priority areas for surveys outside the original scheme. This new information led to extension and revision of the plan in 2010 and 2013, to cover more areas used for navigation. See table 1: to be added 93

95 By 2016, nearly km2 of seabed, more than the combined surface area of Estonia, Latvia and Lithuania, have been resurveyed by national hydrographic agencies in the Baltic Sea in order to implement the re-survey scheme. Surveys of nearly all Category I areas have been completed and also a significant number of category II areas. Figure
96 Ships routeing Measures As elsewhere the safety of navigation in the Baltic Sea took a leap forward with the 1960 revision of the Safety of Life at Sea (SOLAS) Convention (SOLAS, 1960), which explicitly referred to ships' routeing measures for safety of navigation, a topic later expanded in the SOLAS revision of In the Baltic Sea, these developments were followed closely and a number of routeing measures to prevent accidents in the Gulf of Finland and Northern Baltic Proper were adopted by the Inter-Governmental Maritime Consultative Organization (IMCO) (present International Maritime Organization IMO) already in 1968 (IMCO, 1968), only a year after the world s first traffic separation scheme in Dover Straits. Measures in the Baltic Sea adopted in 1968 include Off Kallbadagrund Lighthouse, Off Hogland (Gogland) Island, Off Porkkala Lighthouse, Off Hankoniemi Peninsula, Off Kopu Peninsula, Off Gotland Island and Off Öland island (IMCO, 1968). These and other such routeing measures were initially voluntary, but later established as recommendations (IMCO, 1971) and also defined in greater detail (IMCO, 1973). In strict legal sense the majority of IMO routeing measures are only recommendatory -even if navigation in them becomes de facto mandatory via rule 10 of COLREG. During 1980 s, IMO decisions allowed also routeing measures based on environmental justifications. By 2016 the Baltic Sea States have established (mainly via IMO) a large number of routeing measures in the Baltic Sea area. These include ship routeing systems such as 25 Traffic Separation Schemes (TSS), seven other spatial measures (such as two-way routes), six deep-water routes, four mandatory Ship Reporting Systems (SRS) SOUNDREP, BELTREP, GOFREP and GDANREP- as well as two areas to be avoided (ATBAs). In addition Vessel Traffic Service (VTS) all over the Baltic Sea provides services to mariners and follow the implementation of such measures. HELCOM Clean Shipping Guide (HELCOM 2016) includes a complete list of valid routeing measures in the Baltic Sea. AIS The International Automatic Identification System (AIS) carriage requirements are applied in the Baltic Sea. SOLAS Chapter V regulation 19 requires AIS to be fitted aboard all ships of 300 gross tonnage and upwards engaged on international voyages, cargo ships of 500 gross tonnage and upwards not engaged on international voyages (by 2008) and all passenger ships irrespective of size. The requirement became effective for all ships by 31 December Ships fitted with AIS shall maintain AIS in operation at all times. Some Aids to Navigation in the region are installed with AIS transponders and Virtual aids to Navigation (AtoNs) are further be used by some coastal states in dynamic situations like when temporary dangers occur like new wrecks etc., or when preferred routes are marked out electronically in heavy ice conditions. Some countries in the Baltic Sea, like Sweden and the Russian Federation, provide weather data via AIS for specific suitable devices if carried on board. The Baltic Sea area is covered by a dense network of coastal AIS network of shore based antennas to receive and share the information which in normal conditions enable coverage all over the region. Since the 1 st of July 2005 the national AIS networks in the Baltic Sea area are linked together as HELCOM AIS, which gives to all coastal countries a real time picture of traffic situation in the entire region. The AIS base station network of the Baltic Sea coastal states is presented in figure 2. Figure 2: Coastal AIS base stations of the HELCOM Members States 95
. In 2017 hosting of this server has been moved from Denmark to Norway.")
97 The globally pioneering regional HELCOM AIS network between the nine maritime administrations, was launched in July 2005 as one direct result of commitments at the HELCOM Ministerial Meeting of 2001 commitments, continues to be developed and maintained by a dedicated HELCOM Group (HELCOM AIS EWG). In 2017 hosting of this server has been moved from Denmark to Norway. As mentioned earlier the synoptic and historical AIS information, showing the density of traffic and the actual sailed routes of ships in the entire region, has during the last ten years highlighted the need for new high priority areas for bathymetric re-surveys, new charts (especially ENCs) as well as other safety of navigation measures such as IMO routeing. Access to the regional AIS data generated by the system is also available to a wide range of actors either automatically, or in some cases after an explicit consultation. The recent surge of maritime developments in the form of wind-power farms, pipelines and cables have increased the interest in this information for planning purposes. 96
98 Ice navigation During winter months ice is a major navigational challenge in the Baltic Sea region. During winter a large part of the Baltic Sea area is covered with ice and largest ice extent is observed during February-March. Based on HELCOM Recommendation 25/7 adequate ice strengthening is needed for ships sailing in the Baltic Sea during ice season depending on the thickness of level ice. Below restriction categories according to ice classes of the Finnish-Swedish Ice Class Rules (Baltic Ice Classes) and Russian Maritime Register of Shipping Rules 2008 (see table of ice class comparisons): In ice thickness in the range of cm, and if the weather forecast predicts continuing low temperature, a minimum ice class Ice 1 or equivalent should be required for ships entering the ports of a Contracting Party. in ice thickness in the range of cm, and if the weather forecast predicts continuing low temperature, a minimum ice class IC or Ice 2 or equivalent should be required for ships entering the ports of a Contracting Party. In ice thickness in the range of cm, a minimum ice class IB or Ice 3 or equivalent should be required for ships entering the ports of a Contracting Party. If ice thickness exceeds 50 cm, a minimum ice class IA or Arc 4 or equivalent should be required for ships entering the ports of a Contracting Party. If in force, these requirements will be announced to the mariners as traffic restrictions which can be lightened and finally removed after the melting period of ice has started in spring and the strength of the level ice fields has started to decrease. Information on ice conditions, traffic restrictions, ice breakers and other issues relevant to mariners navigating in the Baltic Sea during winter time can be obtained from the website Additional information about ice conditions in the Baltic Sea countries, including contact information of the national ice services can be obtained from the common website of the national ice services of the Baltic Sea States [cf. Table 1 on ice class comparisons] 97
 to use their services.")
99 Pilotage requirements Pilotage is traditionally considered as an efficient way to reduce the risk of accidents in specific high risk areas. For this purpose certified Baltic Deep Sea Pilots are available in all Baltic Sea coastal states and ships masters are recommended through IMO Resolution A. 1081(28) to use their services. Pilotage recommendations in the Danish straits were among the early topics of HELCOM work on safety of navigation and already considered during 1970s. Based on the 2002 IMO Recommendation on Navigation through the Entrances to the Baltic Sea, pilotage is [required] on the following legs: The Sound When passing through the designated areas of the Sound, the following ships should use the pilotage services established by the Governments of Denmark and Sweden: loaded oil tankers with a draught of 7 m or more loaded chemical tankers and gas carriers irrespective of size ships carrying a shipment of irradiated nuclear fuel or INF-cargoes 98
100 Route T When passing through the Route-T, the following ships should use the pilotage services established by the by the coastal States: ships with a draught of 11 m or more ships carrying nuclear fuel or irrespective of size or draught Future perspectives The Challenge of improving safety culture of operators The measures described above, as well as ensuring compliance with international safety regulations, are efficient measures which the coastal countries can take to improve safety of navigation in the Baltic Sea. However, shipping is most of all a business and it is shipping companies, not states, which have the decisive role in the maritime industry. Safety culture of shipping companies and their associated partners is a particularly crucial feature to improve safety at sea. Safety culture is an inherent part of the operation of the organization and must be based on high levels of information sharing and trust between management and the work force. References: [references to be added] 99
101 12. PREPAREDNESS AND RESPONSE CAPACITY IN THE BALTIC SEA Introduction Only few of the around 300 maritime accidents which take place yearly in the Baltic Sea result in an oil spill, and mostly these are small releases with only local impact and importance. Nevertheless larger spills have [regularly] taken place in Baltic Sea, requiring some sort of international response action to avoid damage to the environment. With the current frequency of traffic and size of modern ships, including tankers, it is not unthinkable that a major spill could happen again. In order to prepare for major pollution incidents, the coastal countries of the Baltic Sea and the EU (European Maritime Safety Agency, EMSA) maintain and develop a high level of preparedness and response capacity in the region. This includes naturally acquiring and maintaining the needed equipment including specialized spill response vessels and surveillance aircraft -but also agreed regional procedures, which are trained in joint annual operational exercises. Due to the sensitivity of the Baltic Sea, dispersants chemical products, which dissolve oil slicks to minuscule droplets- are not considered a primary response measure for oil spills. Instead, the focus is on ensuring sufficient mechanical recovery capacity at sea (sweeping arms, skimmers, brushes,), as well as booms, to be able to jointly collect or stop large spills before they reach the shore. In addition to such capacity at sea, the countries have recently also developed joint response cooperation on the-shore. This is necessary as in some cases it might not possible to stop a larger spill from reaching the shore. In such cases international response from the shore may be necessary, involving beach booms, trucks, smaller vessels and volunteers. It may also include preparedness in handling large amounts of oiled wildlife, which might include threatened species, is a special part of such on-shore response activities. Even if oil remains to be in focus of the response activities and cooperation due to the large volumes carried in the Baltic Sea, the region is also prepared to respond to spills of hazardous chemicals. For this purpose a number of advanced safe platform vessels for chemical response have been introduced recently. Timeline of accidental spills in the Baltic Sea The largest spills recorded in the Baltic Sea took place during the late 1970s and early 1980s. This is not surprising as during that time oil shipments increased rapidly but current safety measures, technology and perhaps also awareness were not in place. The Globe Asimi accident of 1981, with tons oil spilt to the Baltic Sea in the vicinity of Klaipeda (Lithuania), keeps the questionable record of the biggest spill in the regions history. After a number of relatively quiet years during the 1980s and 1990s, the Baltic Carrier (2001, 2700t) and Fu Shan Hai (2003, 1200 t) incidents awakened the region again to the threat from large spills (cf. Fig and Fig. 12.2). As a result a number of new safety of navigation measures were agreed for the region including also a revision of the relevant sections of the 1992 Helsinki Convention. No spills over 1000 tonnes have taken place in the Baltic Sea since Fu Shan Hai. [Figure Illustration with the timeline of accidental spills in the Baltic Sea] [Figure Illustration with the Major oil spills in the Baltic Sea ] 100
102 101
. [data not yet collected for period 2014-16]. In 2013, a total of 315 million tonnes of liquid bulk cargo were handled in 116 Baltic Ports (Baltic Port List 2014).")
103 Volume of oil carried in the Baltic Sea The volume of liquid bulk including oil handled in bigger Baltic Sea ports increased rapidly during the period but then levelled off (Figure 12.3). [data not yet collected for period ]. In 2013, a total of 315 million tonnes of liquid bulk cargo were handled in 116 Baltic Ports (Baltic Port List 2014). 102
104 More than 40% of this volume consists of traffic to and from Russian (Primorsk, Ust-Luga, St.Petersburg and Vysotsk), Finnish (Kilpilahti) and Estonian (Muuga) ports in the Gulf of Finland traffic, which crosses the entire Baltic Sea area. In Figure 12.4 is shown the biggest ten oil terminals in the Baltic Sea in [Figure 12.3: Oil handling in 18 larger ports in the Baltic Sea representing 88% of total volume handled. Based on HELCOM data and Baltic Port Lists ( ).] Figure
105 Figure
106 Regulations 1992 Helsinki Convention Helsinki Convention of 1992 and the specific Articles 13, 14 and Annex VII target ensuring preparedness and response to pollution incidents in the Baltic Sea. According to Regulation 4, Annex VII of the Helsinki Convention and HELCOM Recommendation 2/7 concerning the Delimitation of Response Regions for Combatting Marine Pollution, the Contracting Parties are obliged, inter alia, to agree bilaterally or multilaterally on those regions of the Baltic Sea in which they will conduct aerial surveillance activities and take action for combatting and salvage activities. As a principle the response regions should coincide with the boundaries of the Exclusive Economic Zones, where applicable. A large number of HELCOM recommendations have been agreed in addition. Sub-regional agreements and cooperation In addition to the provisions of the 1992 Helsinki Convention, which cover the whole Baltic Sea, nine subregional response agreements have been agreed in the Baltic Sea according to the three tiered approach to response (national-sub regional Baltic wide) and Regulation 4 of the 1992 Helsinki Convention Annex VII. These include currently the pollution preparedness and response agreements between Estonia and Finland (1993), Finland and Russia (1989), Sweden-Denmark-Germany (2002), Latvia and Lithuania (2001), Latvia and Sweden (2002), Latvia and Estonia (2014), Poland and Germany (2001), Lithuania and Russia (2009), Poland and Russia (2010). In addition, sub regional agreements for Sweden-Estonia-Latvia as well as between Estonia and Russia are currently being negotiated. These sub-regional agreements enable closer practical cooperation between neighboring countries, including detailed response planning and targeted exercises. Other regional agreements related to pollution preparedness and response in the Baltic Sea The 1971 Copenhagen Agreement on response cooperation between the Nordic countries is applied in the Baltic within the exclusive economic zones of Denmark, Sweden and Finland. The 2013 Agreement on Cooperation on Marine Oil Pollution Preparedness and Response in the Arctic is applied in the Bothnian Bay north of N. In addition, EU regulations are applied in those Baltic States which are also EU Members. IMO Agreements [To be developed including OPRC, Liability Conventions and others] Standard operating procedures (HELCOM Response Manual) An operational HELCOM response manual, which is essentially an extension of the Annex VII of the 1992 Convention, summarises technical details and the agreed procedures and practices in Baltic cooperation on response issues. It is under constant updating by the Response Working Group and available online 105
107 (helcom.fi). It includes besides the main text all the valid HELCOM Recommendations relevant for pollution preparedness and response. This manual was originally created based on early work during the late 1970s a series of Recommendations dealing with regional warning-, reporting-, communication- and command systems related to regional response operations were adopted by the Commission in 1980 and 1981, and later compiled in a targeted HELCOM Manual on Co-operation in Combatting Marine Pollution adopted in Later entire new sections, e.g. on aerial surveillance and sub-regional cooperation, were added. A separate volume II of the manual, focusing on response to accidents at sea involving spills of hazardous substances and loss of packaged dangerous goods, was adopted in 1990 to make the region better prepared also for this type of pollution incidents. The last addition is the volume III on response on the shore, adopted in 2013 and revised in Response vessel fleet in the Baltic Sea The Baltic Sea fleet consist of 85 response vessels as reported to HELCOM in 2016, including specially designed response vessels as well as navy and other vessels with national tasks in oil spill response. In total these vessels have a recovery capacity of 9144 m 3 oil per hour, carry 27.7 km of booms to stop and contain oil slicks and have a total capacity to store m 3 of collected oil and oily water. In addition storage capacity ashore is made available. However it should be noted that usually only a share of this capacity is available for international response operations as certain capacity need to be retained in the home country to preserve a minimum response capacity; and due to overhauls, maintenance, technological updates, and absence from the Baltic Sea area due to participation in international exercises. All coastal countries have at least one response vessel and also EMSA has a response vessel in the southern Baltic Sea. The national fleets of Germany, Sweden and Finland have largest recovery and storage capacities, more than half of the total capacity, with many specialised vessels. Table: Summary of the response capacity of the Baltic Sea coastal states and EU (EMSA vessel) as reported to HELCOM in Contracting Party Number of vessels Recovery capacity (m3/h) Boom length (m) Storage capacity (m3) DK EU (EMSA) EE FI DE LV LT PL RU SE Total Baltic Sea [Fig.5: recovery capacity according to home port of vessels ] 106
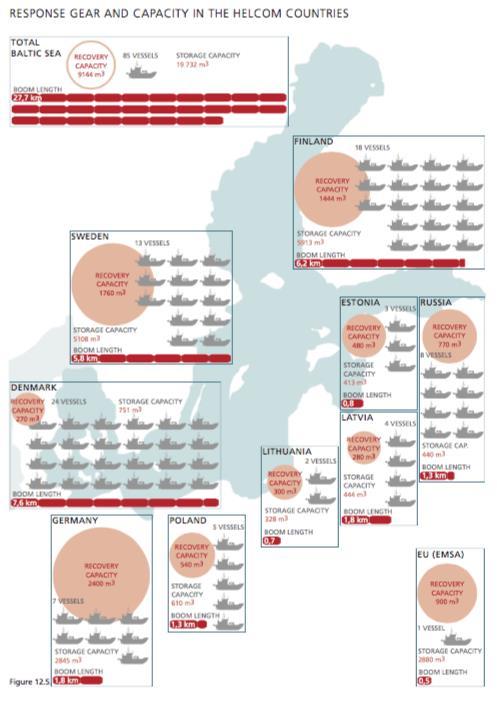
108 107

109 Response aircraft fleet in the Baltic Sea In addition to response vessels the coastal countries of the Baltic Sea have 35 surveillance aircraft (19 airplanes and 16 helicopters) which have an important role in response operations, observing slick movements and enabling situational awareness. These aircraft are in regular use and i.e. provide the surveillance data on operational pollution described in chapters 4 & 5. Exercises In order to ensure an effective joint response in practice the HELCOM Contracting Parties carry out joint response exercises regularly. These exercises range from table top or "paper" exercises to operational exercises. BALEX DELTA operational exercises are the most famous of the HELCOM response exercises, which since late 1980s have gathered the coastal states response fleets annually to the same port. The general objective of the BALEX DELTA exercises is to ensure that every Contracting Party is able to lead a major response operation. Baltic focus on mechanical recovery of oil & Dispersants Due to the sensitivity of the Baltic Sea, the coastal countries concluded in 1978 that in oil combatting operations in the Baltic Sea, the use of dispersants should be limited as far as possible, that sinking agents 108
110 should not be used at all in the Baltic Sea Area, that synthetic or natural absorbents could be used in certain cases, and that mechanical means for oil pollution combatting are preferable (HELCOM 1978). This agreement to focus on mechanical recovery and avoid dispersant and sinking agent use in the region is still valid today and included in Annex VII of the 1992 Helsinki Convention as Regulation 7 on Response Measures. Response to chemical spills Already in 2002, the coastal countries adopted a dedicated volume of the HELCOM response manual to address the potential risks from accidents involving hazardous chemicals. As new knowledge is available and as chemical transportations in the region, in both bulk and in packaged form, have increased during later years there are aims to update these regional best practices. Six response vessels in Finland and Sweden are equipped to be able to participate in response operations involving spills of hazardous chemicals. [to be named] Risk assessments & dimensioning adequate response capacity Maintaining response preparedness and the need equipment is expensive and it is important to dimension the capacity according to the foreseen risks of spills. This includes in some countries the identification of target spills, or a spill of certain size which will form the basis for national preparedness planning. [Table: National targets for spill response capacity in the Baltic Sea] Country Denmark Germany Poland Estonia Finland Sweden Russia Lithuania Latvia Response target 5000 t within three days t No fixed value t t (Gulf of Finland) /20 000t (Archipelago Sea)/ 5000t (Gulf of Bothnia) within three days t (National resources only) NA NA No fixed value Such targets are supported by national risk assessments which cover besides dimensioning capacity itself also its optimal placement along the coastline. Drift Modelling The Seatrack Web (STW) oil drift calculation system is the official HELCOM drift model/forecasting and hindcasting system which is used for calculating the fate of oil spills. It is developed and hosted by SMHI Sweden in cooperation with other regional institutes and available online for national authorities and certain research organisations. 109
111 STW has an important role in the response cooperation in the Baltic Sea region and is since the 1990s used by all Baltic Sea coastal states -in some cases in parallel with national systems. Several versions have been developed since the 1990s the recent being a completely overhauled version, with new web interface and enhanced model algorithms, released in The STW system is able to make forecasts of how a cloud of particles (e.g. oil) will be moving and behaving on the sea surface. In case an oil spill is detected, the system is used to predict where the oil will be after some hours. This enables combatting units to be able to plan where to be positioned to make the most use of their oil recovery equipment. On shore, cleaning units can plan where to move their units so they can protect the shorelines most probable of being affected by the oil. If it is an illegal spill it is of interest to identify the polluter. STW combines modelling run in a backtracking mode with the HELCOM AIS data in order to identify which ships have passed the track of the oil spill. This information is used to find possible polluters for further investigations. Places of Refuge Based on the explicit requirements of the 1992 Helsinki Convention, the coastal countries and the EU agreed in 2010 on a mutual plan for places of refuge in the Baltic Sea area (HELCOM Recommendation 31E/5). It calls the countries to define places of refuge in their jurisdiction and make them operational within sub-regional cooperation arrangements (see under Regulations within this chapter). The main responsibility to grant a place of refuge (PoR) to a polluting ship in distress is with the country in which the response operation started. However, in some cases this is not possible and a PoR in another coastal country would help to limit pollution or safety of life. The recommendation provides guidance for these cases when the country of origin requests another country to grant a PoR. Financial reasons are explicitly defined as not a sufficient justification for such requests. Future perspectives Open tools for risk assessments A risk assessment means systematically identifying, evaluating and analysing risks. By getting a full picture of risks, accidents can be better prevented and their consequences minimized with optimized risk reduction measures. These are regularly carried out in the coastal country administrations. However, they can also be carried out for an entire region such as the Baltic Sea in order to support joint regional planning and work. The HELCOM BRISK/BRISK-RU projects carried out the first regional risk assessment of spills in the entire Baltic Sea region. A challenge is that results of such risk assessments are typically valid for a limited period, while the international relations change constantly. The lack of regular risk assessments with a common methodology has caused difficulties in following how the risks of accidents, and pollution, develop over time and thus monitoring the cost efficiency of policy measures. New approaches are greatly needed to address these issues and use the full potential of risk assessments. The HELCOM led OpenRisk project will take the first step in developing a toolbox of joint and open methods that enable frequent assessments of spill risks from maritime accidents and to optimize response preparedness. 110
112 The expected main end users are national authorities and regional organizations working on spill prevention, preparedness and response, or their consultants. As such, the project focusses on risks related to spills from ship accidents. Alternative fuels and spills Besides positive contribution to reducing ship emissions, some alternative fuels such as LNG have the added benefit that they reduce the risk of oil spills as no bunker is carried on board. However, accident situations may naturally result in different types of hazards including the risk of human life loss. References [references to be added] 111
113 13. Fishing activity in the Baltic Sea Introduction Fishing activities in the Baltic Sea can be divided roughly to two main types: commercial and recreational fishing. Recreational fishing refers to fisheries as a leisure activity and takes place mainly in the coastal areas of the Baltic Sea. Commercial fishing includes mainly activities of vessels registered in national fishery vessel registers. Overall, the mechanization of commercial fishing since the 1950s has profoundly changed, and centralized, the industry resulting in the general long terms trend towards fewer fishermen working in larger vessels catching more fish (cf. figure 13.0 below). On one hand the bigger and more effective trawlers, tankers and gear have ensured large catches. On the other, vacuation pumps, sorting machines, refrigeration units and filleting machines have eased handling and transportation of bulk catch. Figure 13.0 Fisheries in the Baltic Sea land annually around tonnes of fish (Lassen 2011). The target species include herring (Clupea harengus), sprat (Sprattus sprattus), cod (Gadus morhua), European flounder (Platichthys flesus), salmon (Salmo salar) and sea trout (Salmo trutta) and a number of coastal species e.g. vendace, pike, perch, pike perch and garfish (in the southern Baltic only). In the western parts of the Baltic Sea and Kattegat there are fisheries targeting other flatfishes as well as norwegian lobster and prawn. Eel fishery has diminished during the last 30 years (Lassen 2011). In terms of volume the main species targeted by commercial fishing in the Baltic Sea include in decreasing importance Atlantic herring, sprat, cod and European flounder. The catches of herring and sprat alone account for nearly 90% of the commercial catch in terms of volume (STECF 2016). 112
114 Fishing vessels are commonly divided to small (SSF) 2 and large (LSF) 3 scale fisheries vessels. Based on the latest available figures the total commercial fisheries fleet of EU Member Countries operating in the Baltic Sea excluding Kattegat consisted in 2014 of around 6500 registered vessels, 11% of which were LSF vessels while 89% were SSF vessels (STECF 2016). LSF vessels landed 90% of the total catch in volume (STECF 2016). In addition to EU vessels, an unquantified number of Russian vessels operated in the Baltic Sea. Commercial fishing activities, particularly that of larger vessels (>12m), are closely monitored by data collection systems EU Common Fisheries Policy and for this reason relatively well known. Inversely, the activities of smaller coastal vessels, very much like leisure boats, in the Baltic Sea remain to be described in their full spatial complexity. Even if fishing uses boats and ships, and in this way a pollution source similar to shipping (see first chapters), the main environmental impact of fishing activity is the direct effects it has on the biodiversity of the Baltic Sea. Fisheries impacts naturally the targeted fish stocks, but depending on the gears used may also have an effect on the sea bed and its fauna and flora (bottom trawling) or other species including marine mammals and sea birds (incidental bycatch). Also derelict gears (e.g. ghost nets ) is a fisheries related environmental issue. These cause mortality of fish and other fauna in the Baltic Sea for a long period after they have been lost at sea. Fishing activities in the Baltic Sea Large scale fishing vessels There were in 2014 around 800 EU flagged industrial vessels in the large scale fishing (LSF) vessel category operating in the Baltic Sea (STECF 2016). These LSF vessels operating in the Baltic Sea used as main gear either demersal ( bottom ) trawls, targeting mainly species such as cod (Gadus morhua) as well as various flatfish species, or alternatively midwater trawls, targeting mainly herring (Clupea harengus) and sprat (Sprattus sprattus). While cod is caught mainly for human consumption, herring and sprat are mostly caught to produce fish meal and fish oil for animal feed (including aquaculture) (Lassen 2011). The LSF vessels landed 90% of the catch in terms of volume (STECF 2016). The largest vessel segment of the LSF category operating in the Baltic (24-40m) included 55 demersal trawlers (29 Swedish, 7 Danish and 19 Lithuanian) and 147 midwater trawlers (45 Latvian, 28 Estonian, 43 Polish, 22 Finnish, 5 Lithuanian and 4 Danish). (STECF 2016). The fishing activities of larger vessels (usually >12 m) are monitored closely by their flag states, using mandatory procedures like obligatory landing as well as technologies like Vessel Monitoring System (VMS) and fisheries control cameras installed on deck. The Figures 13-1 below illustrates the main target species in the Baltic Sea: cod, herring, sprat and flatfish as well as which gears are used to catch them. 2 under 12m using static gears 3 all vessels using towed gears and vessels over 12 m using static gears 113
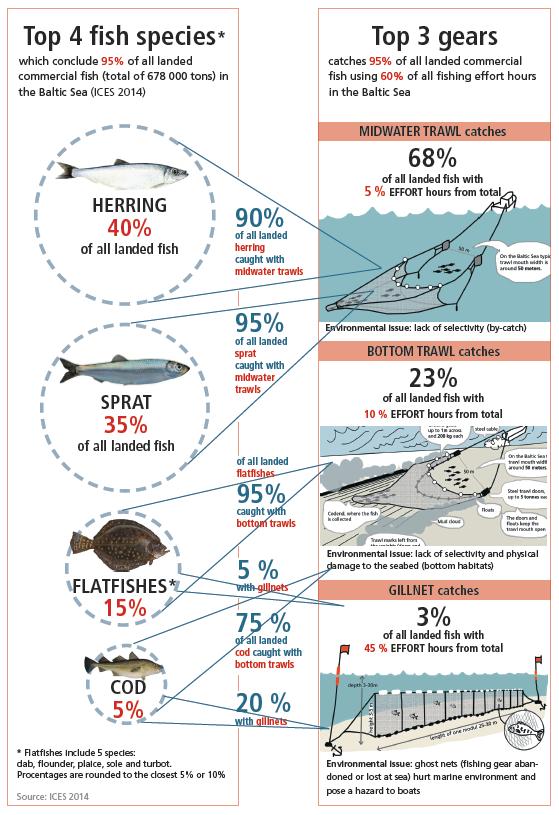
115 114

116 Figures
117 Small scale fishing vessels In terms of numbers the main part of the EU fishing fleet operating in the Baltic Sea consists of around 5700 smaller SSF fishing vessels (STECF 2016). These vessels used commonly different types of gears than the larger vessels, usually various fixed gears (fixed nets, lines and traps) without a defined main gear (categorized as PGP or polyvalent passive gears) and target a wider variety of species (STECF 2016). Partly due to different gears utilized, these smaller vessels cause likely less environmental damage by their operations. EU -wide smaller vessels tend to focus on catching higher value species for human consumption and employ more persons per landed fish (IFREMER 2007). Mapping commercial fisheries activities by AIS It is possible to map commercial fishing effort using the VMS data (e.g. ICES 2016, Bergström & Fredriksson 2012). However, also AIS data is becoming a viable basis for such mapping. AIS is compulsory for all EU fishing vessels with a length more than 15 meters since 2014 (EU Dir 2011/15/EU), but is also used on a voluntary basis by many smaller fishing vessels. Following the methodology developed by Natale et al. (2015), the fishing effort in the Baltic Sea during 2015 was mapped for this report using the HELCOM AIS data covering the entire Baltic Sea and a database of fishing vessels. The maps XX (next page) show the fishing effort for each of the main fishing gears based on AIS data. The complete methodology of this study is available in the Appendix XX. Please note that due to the lack of a vessel registry, fishing vessels from Russia are not covered in the above maps (cf. Figures next page). 116
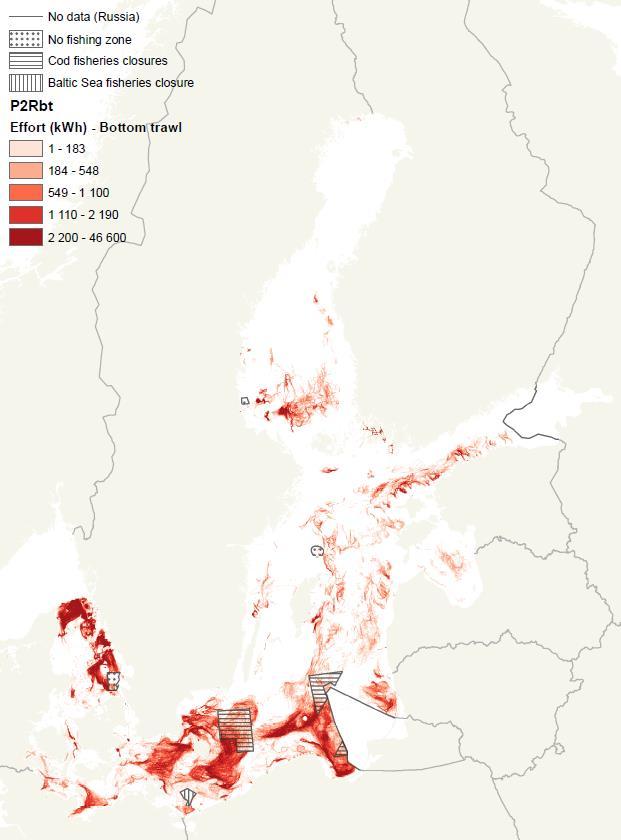
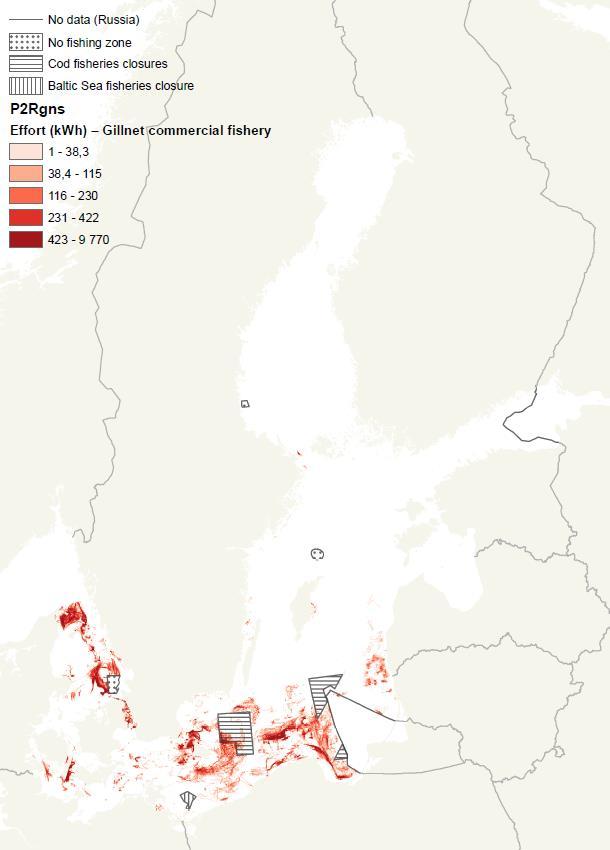

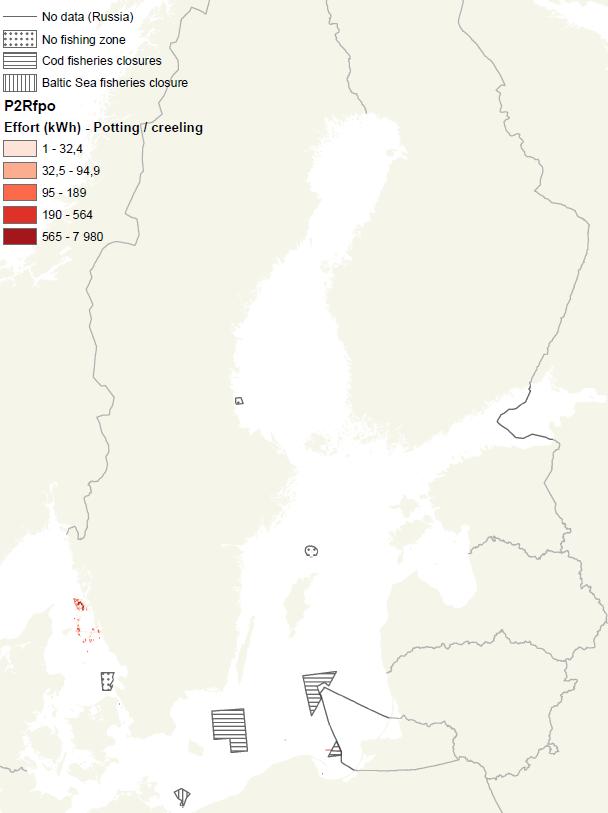
118 117
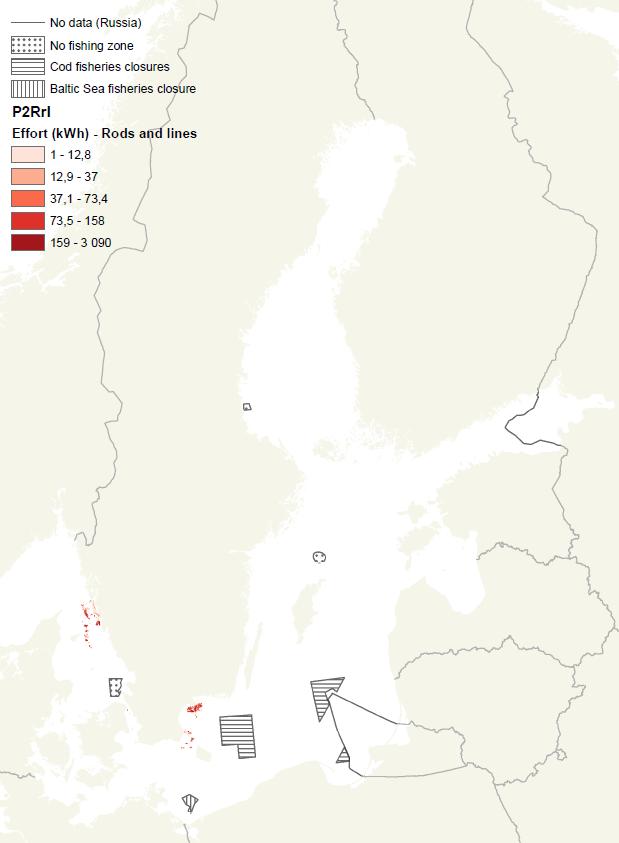
119 118
120 Recreational fishing Recreational fisheries refer to fishing during leisure time and targets an even larger variety of species, but also species such as cod which are targeted by commercial fisheries. The species targeted by recreational fisheries vary depending on local circumstances. As an example in Sweden and Finland, recreational catches are mostly perch (Perca fluviatilis), pike (Esox lucius), pikeperch (Sander lucioperca) but also roach (Rutilus). Also sea trout (Salmo trutta) and salmon (Salmo salar) are attractive species for recreational fishing in the regioneven if most of the activity takes place in estuarine and riverine areas. River restoration activities provide a way to recover lost spawning grounds of such migratory species, and ensure sustainable growth of such recreational fishing. As recreational fisheries has, at least until recently, been less regulated than commercial fisheries, and not under the same reporting obligations, it is more difficult to get quantitative information on its definitive extent and impact on a Baltic-wide scale. Even if there are no obligations some surveys on the catches of recreational fishing are carried out every year in Denmark and Sweden, and every two years in Finland. For the other Baltic Sea countries, there is no regular assessment of catches but the number of fishing licenses are monitored in Poland, Estonia and Germany. In Estonia, catch data is available for some specific area such as rivers where salmons are spawning. Based on the available information recreational fishing may equal commercial catches of certain commercially fished stocks (HELCOM 2017). Further, recreational catches exceed commercial catches for non-internationally assessed species such as the perch, the pike and the sea trout in Finland and Sweden. However, in many areas including for example Denmark overall, recreational catches are clearly smaller than commercial catches. (Lassen, 2011). Recreational fishing is a coastal activity which likely peaks in densely populated areas. Even if angling is perhaps the most common type of recreational gear also passive gears such as gill nets and fyke nets are allowed for recreational fishermen in many Baltic Sea countries. However, in Germany, these passive gears are allowed only for former commercial fishermen and they are completely forbidden in Poland and Russia. In Poland only angling and spearfishing is allowed for recreational fishermen. Environmental impacts of fisheries Target species removals Fish are an important component of the Baltic Sea ecosystem and as fishing removes them from the food webs there is a link between catches of target species and the state of the marine environment. Some species fished have also been assessed as endangered or vulnerable species as such. The official reported fisheries data available from national sources includes commonly only commercial landings. Thus they do not commonly include unreported commercial catch, discards and recreational catch. Some recent research has demonstrated that the total removals taken from the Baltic Sea may be up to 30% above the official ICES figures (Zeller et al., 2011). As some Baltic Sea stocks are in a vulnerable state such uncertainties in the data underlying management decisions may have important consequences to the marine ecosystem. Sea-bed disturbance by active bottom contact gears Trawling on the sea-bed, as well as similar activities such as mussel dredging, catches target species but also disturbs the seafloor physically. Due to this bottom trawling is commonly considered, from the point of view of the environment, as a problematic fishing practice overall. Bottom trawling for species like cod and flatfish is mainly carried out in the southern Baltic Sea, even if some bottom trawling of vendace and herring takes place in the Bothnian Sea. In addition, Norwegian lobster (Nephrops sp) and
121 prawn/ shrimp (Pandalus sp) as well as mussels are fished in the Swedish and Danish waters of Kattegat and Skagerrak. Bottom trawling can directly harm sessile species by removing them incidentally as well as having negative effects in the surrounding area by generating suspension of sediments in the water column. The deposition of such sediments can potentially cause smothering which can be harmful for the marine biodiversity (Korpinen et al., 2013). Incidental bycatch Unwanted, or incidental by-catch of fishing gears is among the central negative effects of fishing. Even if always undesirable it may cause mortality of especially vulnerable, or endangered, species. When unwanted species are brought on board the fishing vessels, they may end up discarded dead at sea. Bottom trawling tends to include a high share of non-target species, or incidental bycatch. However, also the use of passive fishing gears can in certain areas be responsible for mortality of marine birds and marine mammals. This includes the harpor porpoises (Phocaena phocaena) as well as the three species of seals occurring in the Baltic Sea: the grey seal (Halichoerus grypus), the harbour seal (Phoca vitulina) and the ringed seal (Pusa hispida) (ICES, 2004). The use of gillnets in areas with a high density of marine birds (resting, moulting and wintering areas) could also explain high number of by-catch for these species (HELCOM, 2003). Ghost nets and lost gears Derelict fishing gears or lost, abandoned or discarded gears, often referred to as ghost nets has been highlighted as a global environmental issue as they continue entangling fish and other fauna for a long time after being lost. While entangling nets and traps are on a global scale considered to be the most common type of derelict fishing gears (Macfadyen et al. 2009), in the Baltic Sea the main types of derelict gears seem to be fixed gillnets (including recreational nets) as well as trawls (WWF 2015). Until 1998, the amount of nets lost by the Swedish fleet alone was estimated at , which corresponds to approx km of total length (Tschernij & Larsson 2003). A number of recent regional and national projects have recently made efforts to estimate the number of derelict gears in the Baltic Sea. However, there has been less efforts put into estimating the actual impacts of these gears. Fishing regulations in the Baltic Sea EU Fisheries Policy in the Baltic Sea The regional fisheries commission, International Baltic Sea Fisheries Commission (IBSFC), established with the 1973 Gdansk Convention (Anon., 1973) was discontinued on the 31 st of December Today the overall regional fisheries management regime in the Baltic Sea, including spatial measures, is in the global context somewhat special, as the European Union (EU) member countries in the region have, according to the EU treaty, delegated powers in fisheries matters to the EU. EU member countries in the region have nevertheless the task and certain freedom to implement the EU level decisions EU Common Fisheries Policy (CFP) and may impose stricter requirements to their own fleets.
122 Within the ongoing regionalization of the (CFP), the high level group of the regional cooperation body, BALTFISH, established by a memorandum of understanding in 2013 (Anon., 2013), prepares and pre-consults regional proposals on fisheries measures to be considered and adopted by the EU Agriculture and Fisheries Council (AGRIFISH). The needed CFP data collection activities in the Baltic Sea are coordinated in a dedicated group consisting of Baltic Sea coastal countries which are members of the EU. From 2017 onwards this group will be named as the Regional Coordination Group (RCG). Implementation of the data collection is based on the EU multiannual program on data collection (EU-MAP) but implemented by the EU member countries based on national data collection programmes. Another EU body, the Baltic Sea Regional Advisory Council (BSRAC) provides stakeholder advice on management of fisheries in the Baltic Sea. EU-Russia cooperation In 2009, the EU and the Russian Federation concluded a new agreement on fisheries and living marine resources of the Baltic Sea (Anon., 2009a), establishing the Joint Baltic Sea Fisheries Committee, a bilateral fisheries body in order to fill the gap left by the closure of the IBSFC in ICES Authorative scientific advice on the status of fisheries stocks is provided by the International Council for the Exploration of the Seas (ICES) (Anon., 1964) Helsinki Convention & HELCOM Based on the 1992 Helsinki Convention as well as later HELCOM decisions, including the 2007 BSAP, the HELCOM group on ecosystem based sustainable fisheries (HELCOM FISH), originally established in 2008, involves environmental and fisheries authorities of all Baltic Sea states and the EU as well as interest groups for regional negotiations on fisheries environment issues. HELCOM FISH is currently the only regional intergovernmental body which includes all coastal countries (EU countries and Russia) in on an equal footing in fisheries related negotiations beyond science. Future perspectives Enhanced cooperation between fisheries and environmental organisations A part of global developments towards a more coherent marine governance there is a need for enhanced cooperation and collaboration at the regional level in the fisheries and environment theme, supported by continual exchange of information and lessons learned, exploring of shared objectives, and addressing issues of common interest (SOI 2016). Besides the HELCOM FISH group, providing a joint platform for both fisheries and environment authorities to reduce the environmental impact of fisheries, there is also a need for closer cooperation between the regional bodies focusing on fisheries management (BALTFISH and EU-Russia agreement) as well as regional marine environment management work carried out mainly within HELCOM. First steps for this enhanced cooperation has been taken during but this work needs to intensify in order to help the coastal countries and the EU to achieve regionally coherent policies related to the Baltic Sea marine environment and its resources. Improved information on incidental catches of birds and mammals in the Baltic Sea The monitoring of incidental by-catches of birds and mammals in the Baltic Sea is currently rudimental and little facts are available, or available compiled region wide, on the actual levels of these catches to enable considering further measures. Besides some small scale national initiatives, the only species covered by the existing regular data
123 collection in the EU framework is harbour porpoise (Phocoena phocoena) which is not observed in the entire Baltic Sea area. The ongoing work around the new EU fisheries policy data collection might enable more information to emerge in the future but this would need additional resources. Close cooperation between the authorities working with marine environment and fisheries is needed to optimise incidental by-catch data collection across sectoral boundaries. Promoting the development and use of alternative fishing gears and devices Initiatives in the Baltic Sea region have recently tested a number of alternative gears, both passive (e.g. fish pots as well as fixed and automatized longlines,) and active (e.g. trawls with escape windows) as well as related equipment, such as sound ( pingers ) and visible light devices, in order to reduce incidental bycatch (HELCOM 2017). If developed further and deployed commercially these could provide a means to reduce the incidental bycatches and at the same time allow for commercial fisheries operations. Assessing and addressing ghost nets The number of derelict gears have been studied in recent initiatives but more regional synthesis of the information could help in targeting. Further, their impacts are currently less known. All coastal countries in the wold adopted the Code of Conduct for Responsible Fisheries (FAO, 1995). Unfortunately at the moment there are no global standards on marking fishing gear. FAO is working on the finalisation of the draft guidelines on marking of fishing gear. After Technical Consultation in February 2018, the International Guidelines will be submitted for adoption by the FAO Committee on Fisheries (COFI 33) in July River restoration best practices Rivers are the paths which migratory fish like salmon and sea trout take upstream to their spawning grounds. Thus, the river and stream conditions directly influence the status of several migratory fish populations, which spend part of their life in the sea. During the last centuries, many streams and waters in the region have been subjected to intensive modifications such as straightening and dredging of streams for log driving, water level control, hydro-power developments as well as decreased water quality. In many cases such river and stream modifications have collapsed the natural fish production capacity. The changes in energy production, timber transportation and how we spend our leisure time has created interest to restore river and stream environments and their fish populations. To follow up public interest, several municipalities in the coastal countries of the Baltic Sea have recently implemented river restoration activities. River and stream restoration ranges from smaller interventions, such as adding gravel and riverside vegetation, to complete reconstruction of physical features, including natural meandering and removal of dams. As a fringe benefit, river restoration includes also often increased attention also to the water quality -and thus reduction of riverine pollution to the Baltic Sea. As restoration activities are costly there is a need to intensify sharing of best practices in order to restore degraded riverine habitats in the coastal countries. References Anon., Convention for The International Council for the Exploration of the Sea (Copenhagen, 12 September 1964).
124 Anon., Convention on Fishing and Conservation of the Living Resources in the Baltic Sea and Belt (Signed at Gdansk on 13 September 1973, Entered into force on 28 July 1974). Anon., Agreement between the European Community and the Government of the Russian Federation on cooperation in fisheries and the conservation of the living marine resources in the Baltic Sea (concluded 28. April 2009 in Brussels ) Bergström U and Fredriksson R VMS fisheries maps in Backer and Frias (eds.) Planning the Bothnian Sea: Outcome of Plan Bothnia -a transboundary Maritime Spatial planning Pilot in the Baltic Sea. p HELCOM 2003: The Baltic Marine Environment Baltic Sea Environment Proceedings No. 87. HELCOM, 2006 Assessment of Coastal Fish in the Baltic Sea Balt. Sea Environ. Proc. No. 103 AICES, 2004, Report of the Baltic Fisheries Assessment Working Group, ICES CM 2004/ACFM:22. IPCC HELCOM 2017a HELCOM FISH Document 3-1 Information about Coastal recreational fisheries in the Baltic Sea countries submitted by the HELCOM FISH-PRO II group. 10 pp. HELCOM 2017b HELCOM FISH Document 6-1 Questionnaire on alternative fishing gears or fishing techniques. (excel sheet). available online. ICES 2016 HELCOM request on pressure from fishing activity (based on VMS/logbook data) in the HELCOM area relating to both seafloor integrity and management of HELCOM MPAs. ICES Special Request Advice, Baltic Sea Ecoregion. Published 25 August 2015, Version 2, 14 January IFREMER 2007 Small-scale coastal fisheries in Europe, Final report of contract FISH/2005/ PP. Korpinen, S., Meidinger, M. & Laamanen, M. (2013). Cumulative impacts on seabed habitats: An indicator for assessments of good environmental status. Marine Pollution Bulletin. 74: DOI: /j. marpolbul Lassen 2011 Industrial fisheries in the Baltic Sea. Directorate General for internal policies policy department B: structural and cohesion policies, Fisheries. Report for the European Parliament 48 pp. Macfadyen, G. et al Abandoned, lost or otherwise dis-carded fishing gear. UNEP Regional Seas Refootnoteorts and Studies, No. 185; FAO Fisheries and Aquaculture Technical Paper, No. 523, Rome UNEP/FAO. Natale F, Gibin M, Alessandrini A, Vespe M, Paulrud A (2015) Mapping Fishing Effort through AIS Data. PLoS ONE 10(6): e doi: /journal.pone Vetemaa, M., R. Eschbaum, R. Aps, and T. Saat, Collapse of political and economical system as a cause for instability in fi sheries sector: an Estonian case. Proceedings of the IIFET 2000 International Conference. Microbehaviour and Macroresults. Oregon State University, July , Corvallis, OR, USA. WWF 2015 Removal of derelict fishing gear, lost or discarded by fishermen in the Baltic Sea final project report. 48 pp. Zeller, D., Rossing, P., Harper, S., Persson, L., Booth, S., and Pauly, D. 2011b. The Baltic Sea: estimates of total fisheries removals Fisheries Research, 108: SOI 2016 Outcome of the Sustainable Ocean Initiative Global Dialogue with Regional Seas Organizations and Regional Fisheries Bodies on Accelerating Progress towards the Aichi Biodiversity Targets, held in Seoul from 26 to 28 September 2016 ( Seoul Outcome ). STECF 2016 Chapter 4.5 EU Fleet activity in the Baltic Sea in Scientific, Technical and Economic Committee for Fisheries (STECF) The 2016 Annual Economic Report on the EU Fishing Fleet (STECF-16-11). Publications Office of the European Union, Luxembourg. p
125 Tschernij V, Larsson, P.-O., 2003: Ghost fishing by lost cod gill nets in the Baltic Sea. Fisheries Research, 64 (2-3):
126 14. AQUACULTURE IN THE BALTIC SEA Introduction Aquaculture is the controlled production of aquatic organisms whether at sea, in estuaries or inland. As an activity, aquaculture provides today half of all fish for human consumption worldwide (FAO 2017) and has had a vigorous global growth during recent decades (Figure 14.1). Figure 14.1 In many Baltic Sea coastal countries such as Denmark, Germany and Poland, have a long history with inland aquaculture of rainbow trout, but also other species such as common carp. In the Baltic Sea itself aquaculture developed mainly after the second world war and today consists of farming of fish, mainly rainbow trout, and smaller volumes of mussels. After a rapid period of growth, environmental concerns during the 1990s led to a stagnation of production volumes in the Baltic Sea. During last few years some coastal countries, particularly Denmark and Finland, have taken steps to increase national aquaculture production in the Baltic Sea and the volumes show growing trends. Aquaculture in the Baltic Sea There are 332 aquaculture sites in the Baltic Sea that were reported to HELCOM (HOLAS2 project) (Figure 14.2). In terms of volume practically all (>90%) aquaculture production for human consumption in Baltic Sea waters is cultivation of rainbow trout (Oncorhynchus mykiss, a salmonid fish native to the north American west coast first bred

127 in captivity in California during the late 19 th century). A main requirement of rainbow trout rearing is availability of good quality, well-aerated water, which is available at sea.
128 The production of rainbow trout in the Baltic Sea increased rapidly during the 1970s/1980s, reached a peak during 1990s and stagnated or even decreased during the first decade of 2000s (Figure 14.3). Today, the Baltic Sea aquaculture industry is again in an expansive phase and total production in the Baltic Sea coastal countries reached an all-time high of ton annual production in 2013 (FAO 2017). Figure 14.3 This takes place in net pens, open systems in free interaction with the surrounding marine environment, mainly along the SW coasts of Finland, Belt Sea and Kattegat in Denmark as well as the Swedish coast of the Gulf of Bothnia. Smaller amounts of whitefish (Finland) and mussels (Denmark and Sweden) are also reared in the Baltic Sea (Table 1). Table 1 Overview of marine/ Baltic Sea and inland aquaculture in the Baltic Sea coastal countries. FAO Fishstat J 2017, Aquafima 2014

129 The sea cages, also called sea pens or net pens, used in sea trout aquaculture consist of a flotation, usually a round ring, on the surface from which a net bag is hanging. These are fixed to the seabed with anchor and rode, and/or to the shore, but are commonly movable to enable sorting by size and butchering. In more advanced facilities the feeding of the fish is taken care of by computer controlled systems. These optimise the amount of feed according to parameters like the temperature of the water and use pressurised air to distribute right amount of feed to the pens. Fish feed consists mainly of processed fish, in the form of fish meal and fish oil, but includes also vitamins, minerals and color additives. The feed may also include vegetable oils and other products such as soija, wheat- and maize gluten or crushed sunflower. Environmental effects of Aquaculture in the Baltic Sea As feeding of fish cannot be done fish by fish there is always a share of the feed which is not eaten and ends up as waste. Further, the fraction consumed by the fish is only partly metabolized as fish growth while the remainder is excreted by the fish. Due to the open cage systems utilized in rainbow trout aquaculture production in the Baltic Sea this waste results in inputs of Nitrogen, Phosphorus and organic matter to the Baltic Sea. Heldbo 2013 estimated nutrient losses from farmed fish as 41t N and 8t P per 1kt produced fish (Heldbo 2013, Table 36 on page 197). Asmala and Saikku have estimated that during the period t N year 1 and 80 t P year 1 ended up in the Baltic Sea directly from Finnish rainbow aquaculture units in the Baltic Sea (Asmala and
130 Saikku). During this period the Finnish rainbow trout production was in the order of 10000t/y. From this loads of 55t N and 8t P per 1kt produced fish can be inferred. Assuming that production systems are more or less similar in the Baltic Sea region these figures would indicate that with the 2015 production level of ca. 26kt, rainbow trout aquaculture in the Baltic Sea would result in annual direct loads to the Baltic in the order of t N and 200t P. Besides nutrients, other environmental pressures from sea-based aquaculture include emissions of traces of medical preparates, copper from anti-fouling paints used of the facility, escapes of non-native reared fish as well as contagion of wild fish with diseases carried by cultured species. The two latter, escapes of reared species to the wild as well as spread of diseases are commonly highlighted as environmental issues. Overall, environmental concerns have been recognised by the industry which has improved its environmental record during the last decades. This has been recognised also by certificates such as Aquaculture Stewardship Council, WWF green list, awarded to some rainbow trout producers in the Baltic Sea. Environmental regulation of aquaculture 1992 Helsinki Convention and HELCOM Recommendations Aquaculture at sea is not explicitly addressed in the 1992 Helsinki Convention and the commitment to reduce pollution from aquaculture is covered by the general provisions of the Article 3 Fundamental principles and obligations. However, there are more specific commitments agreed in the form of HELCOM Recommendations. Aquaculture inland is addressed more directly. Regulation 2 (Specific requirements) of Annex III Criteria and measures concerning the prevention of pollution from land-based sources specifies that pollution from fish-farming shall be prevented and eliminated by promoting and implementing Best Environmental Practice and Best Available Technology. The 1992 Helsinki Convention Annex II Criteria for the use of Best Environmental Practice and Best Available Technology includes general characteristics of BAT and BEP to be applied in the Contracting Parties in relation to the Baltic Sea. The HELCOM Recommendation 25/4 Measures aimed at the reduction of discharges from marine fish farming includes more specific regional BAT and BEP for marine fish farming and as part of these i.a. recommend that nutrient discharges from marine aquaculture facilities should not exceed the annual averages of 7g tot-p and 50g tot- N per 1kg produced fish. The HELCOM Rec. 37/3 Sustainable aquaculture in the Baltic Sea region recommends that the Governments of the Contracting Parties to the Helsinki Convention to jointly develop by 2018 Best Available Technology (BAT) and Best Environmental Practice (BEP) descriptions for sustainable and environmentally friendly aquaculture in the Baltic Sea region and apply them based on a number of principles. As a source of nutrient pollution aquaculture is an activity contributing to the achievement of the Maximum Allowable Inputs (MAI) as well as Country Allocated Reduction Targets (CART) for Phoshorus and Nitrogen, agreed by the Contracting Parties in 2007 and National Legislation As the aquaculture facilities constructed so far have been relatively small scale they do not fall under international EIA or SEA procedures. The central legislation concerning aquaculture is thus mainly national regulations concerning environmental permits for aquaculture facilities and in some cases EIA. For EU countries a wide variety of EU legislation is naturally highly relevant for aquaculture.
131 Future Perspectives Nutrient mass balance equilibrium: fish feed from local raw materials The use of locally sourced fishmeal have also been put forward as a way reduce nutrient pollution of enclosed, or semi-enclosed, systems like the Baltic with material from the outside. Using local fish as fish feed material would avoid this, and instead recirculate local biomass. Integrated multi-trophic aquaculture (mussels and fish) Recent research shows that commercial farming of mussels in the Baltic Sea Region may be viable even in low salinity environments. The mussels will remain small in size but may nevertheless provide an alternative biomass feedstock for fishmeal, or even in other sectors such as biogas production. In some areas of the Baltic Sea, fish farming combined with mussel farming may also offer a way to compensate for nutrient emissions from fish aquaculture -by binding nutrients via the filter feeding of mussels. Inland farming including recirculation systems Terrestrial re-circulation aquaculture systems (RAS) offer good opportunities to control pollution compared to open net pen systems at sea which use the pollution assimilative capacity of the surrounding aquatic environment. However, these RAS systems are technology intensive and have today relatively high capital expenditure costs. Improving fish feed digestibility and selective breeding There are ongoing research activities around the world to reduce nutrient pollution from aquaculture by improving the digestibility of fish feeds, as well as improve the uptake of feed by selective breeding of cultivated species. References AquaFIMA 2014 Actual and potential aquaculture locations in the Baltic Sea Region. 39 pp. FAO The State of World Fisheries and Aquaculture Contributing to food security and nutrition for all. Rome. 200 pp. Heldbo Bat for fiskeopdræt i Norden -Bedste tilgængelige teknologier for Akvakultur i Norden Jesper Heldbo (ed.), Richard Skøtt Rasmussen and Susan Holdt Løvstad. ISBN : pp. Asmala and Saikku Closing a Loop: Substance Flow Analysis of Nitrogen and Phosphorus in the Rainbow Trout Production and Domestic Consumption System in Finland. Ambio 39 (2), pp
132 15. OFFSHORE WINDFARMS IN THE BALTIC SEA REGION Introduction Wind power and other offshore renewables, such as wave power, are part of the solution in the ongoing global move away from coal, oil, gas and nuclear power and replace that with more sustainable forms of energy production, mainly in order to reduce CO2 emissions and reduce global climate change. The first offshore windfarm in the world, the Danish Vindeby, was constructed in 1991 in the western end of the Baltic Sea. However, it is especially during the last ten years that interest in offshore wind energy in the Baltic Sea has taken off. The nameplate production capacity of offshore wind in the Baltic Sea has more than tripled during the last five years, from 0,6 to 1,7 GW. This Baltic boom is partly a result of lack of space in the North Sea, but also a realisation that the Baltic Sea provides somewhat lower but more stable winds and enable lower construction costs due to e.g. shallower depths and closer distances to the shore. Besides increase in capacity another trend is that while the first projects are characterised by smaller near-shore farms with smaller size turbines, the latest developments are larger, located further offshore and with much larger and effective turbines. The main environmental concerns related to offshore wind are usually underwater noise during construction phase, pile driving or demolitions, and operationally effects to birds (as well as bats nearshore). While underwater noise during construction phase can to some extent be mitigated by solutions such as bubble curtains, little studies are available on the region-scale operational effects of wind power farms to birds and their migration routes. Even if offshore wind is be out of sight from coastal homeowners, it occupies sea surface and infringes potentially with other maritime activities such as shipping or fisheries and is often planned to shallow banks which have high biodiversity values. It is thus globally and in the region an activity which is perhaps the main underlying factor behind the development of Maritime Spatial Planning, overall planning of space at sea (see Section XX). Also wave power technology solutions have emerged during last years and it is not unforeseeable that also this form of renewable offshore energy production will be installed on a commercial scale during the coming years. Offshore wind power in the Baltic Despite the quick developments offshore, the bulk of wind power developments today take place on dry land. As an example 10,923 MW were installed onshore compared to 1,567 MW offshore in EU in 2016 (EWEA 2016). However this ratio is changing as cost-efficiency of offshore developments is improving. By end of 2017 there will be a total of 578 offshore turbines divided to 17 offshore wind farms (solitary turbines excluded) in the Baltic Sea. In total these will be generating a nominal total of 1,7 GW of power by the end of the year The recent developments have been fast and the capacity has nearly tripled from 598 MW to 1669 MW during the period Denmark and Sweden were the first countries to develop offshore wind farms in the region during the 1990s, but Germany has quickly established itself as a major offshore wind country in the region since % of the existing capacity is located in the south-west of the Baltic Sea Region in the territorial waters of Denmark, Sweden and Germany (Figure 1).
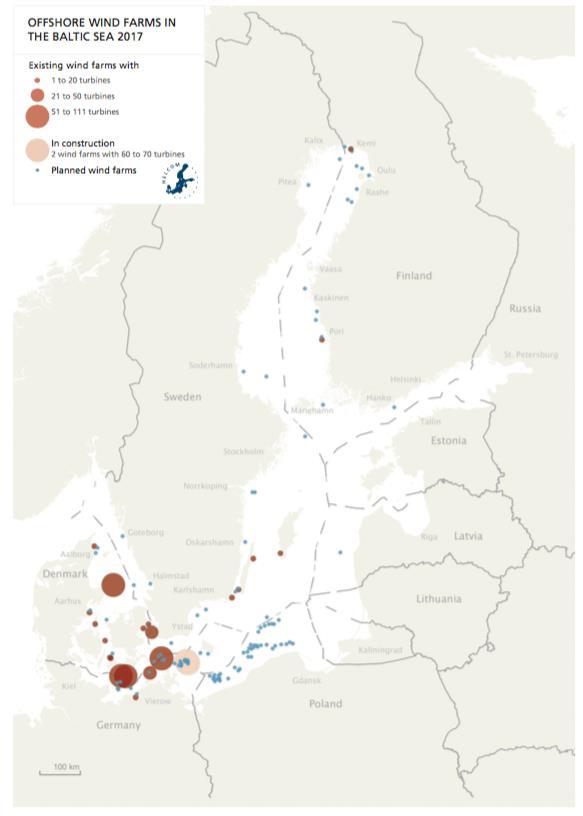
133
134 Seven of the farms have 48 or more turbines, the largest being the Anholt farm in Denmark with 111 units (400 MW). At the time of writing two farms are being constructed in German waters, the Wikinger farm (350 MW, 70 turbines) to be operational by 2017, and Arkona (385 MW, 60 turbines) to be operational by 2019 (Table 1 on existing windfarms).

135 While the early offshore windfarms in the Baltic Sea were built in shallow waters less than 10 m depth and less than 6 km from the coast the recent developments have been in somewhat deeper waters, more than 15 m and further from the shore, up to 35 km. The turbines have also grown in size. The turbines of the ongoing Arkona project are at 177m max height, three times the size of those of the first windfarm (Vindeby, dismantled in 2017) at 52,5 m. (Figure 2)

136 Two offshore wind farms have been decommissioned so far in the region: Yttre Stengrund (SWE) built 2001 and dismantled 2015, as well as Vindeby (DK) built 1991 and dimantled Vindeby on the north side of the island of Lolland in Denmark was the first offshore wind farm in the world. See figure 3 Offshore wind farm and the Baltic Sea marine Environment As a renewable form of energy windpower is, in the long run, a way to reduce the dependency in fossil fuels and CO2 emissions worldwide. Nevertheless, as with all human activity, there are environmental effects in constructing and operating windfarms which should be minimised with good planning but cannot be entirely avoided. The main environmental concerns related to offshore wind are usually underwater noise during construction phase, pile driving or demolitions, and operationally effects to wildlife, mainly birds. Beyond construction activities wind farms are usually assessed to have no or minor negative effects to underwater life (marine pelagic, demersal and benthic species) (Bergström et al., 2012, Hoffmann et al., 2002). Noise from pile driving and other underwater construction work The construction phase effects are commonly due to noise from installing a solid turbine base, or foundation on the seafloor. Even if other types of solutions exist, including floating turbines, today most of the offshore wind turbines in the Baltic Sea use a solid foundation (cf. Figure15.4).

137 These require activities such as pile driving and demolitions which create high level of impulsive noise which has shown to have direct harmful effects to marine fauna, especially marine mammals such as porpoises but also fish. As an example of regulatory developments related to this type of environmental effects the German government has set a mandatory 160-decibel limit on the sound levels allowed in wind farm construction, measured at a distance of 750 meters (half a mile) from the pile or source of noise Construction phase underwater noise can be reduced by using technical mitigation solutions such as bubble curtains during the operations. Region scale effects of windfarms to bird populations The main environmental concerns related to the operation of windfarms are Baltic Sea-wide effects to birds, as windfarm avoidance might induce population level changes due to changing flight patterns including migration routes (REF). Even if some studies focusing on single projects are available, few [no?] studies are available on the region-scale operational effects of wind power farms to birds and their migration routes. More research would be needed to enable evidence based planning on this point. See Figure 5 Regulations 1992 Helsinki Convention and HELCOM Recommendations Beyond the general provisions to minimise harm the 1992 Helsinki Convention article 7 covers Environmental Impact Assessment (EIA) even if the more specific provisions and procedures of the 1991 UNECE convention are commonly used instead (see below). The HELCOM Recommendation 17/3 (1996) on Information and Consultation with Regard to Construction of New Installations Affecting the Baltic Sea, recommends the countries to inform the Helsinki Commission about new installations including offshore wind power. HELCOM Recommendation 24/10 (2003) on Implementation of Integrated Marine and Coastal Management of Human Activities in the Baltic Sea Area calls the contracting parties to develop MSP.
138 The HELCOM Recommendation 34E/1 (2013) on safeguarding important bird habitats and migrations routes in the Baltic Sea was adopted in 2013 to enhance the research and monitoring of important birds species to map migration routes and staging areas such as wintering, feeding, moulting and resting grounds UNECE Convention on transboundary EIA and its 2003 SEA protocol Even if wind power developments are usually not considered to warrant an transboundary EIA (national EIAs are naturally carried out) based on the 1991 Espoo Convention, or the UNECE Convention on Environmental Impact Assessment in a Transboundary Context (UNECE, 1991), offshore wind power farms are in some countries such as Germany included in the explicit maritime spatial plans -which is in turn warrant a SEA according to the SEA protocol of the Convention (Anon., 2003). Future perspectives Future developments of offshore wind farming in the Baltic Sea Region A regional study from 2012 estimated that 40 GW of offshore wind capacity is possible in the Baltic Sea, when taking into account estimates on known environmental and other constraints (BASREC, 2011). This would indicate more than twenty fold increase from the existing capacity of 1,7 GW in the long run. Even if the realization of such scenarios is always debatable, it is very likely that the rapid trend of rapid growth of wind power capacity will continue well into the 2020s as a number of large projects have been approved or are in final phases of approval. More than a hundred new projects were in some form of preparation by 2015 (EWEA 2015) (cf. Figure 6, Map XX). These are not covered in detail as many of them might not be constructed due to business reasons despite formal approvals. Nevertheless they can be used to illustrate the relative level of interest on offshore wind in the region.
139 The main number of these new developments are taking place in the waters of Denmark, Finland, Germany and Sweden but also Poland, Estonia and Latvia have active offshore wind projects. The EEZ of Poland is one of the new hotspots of new developments as there are currently more than 70 submitted applications for the installation of new windfarms. There are also a large number of proposed projects in Finland. Offshore wind projects have been proposed also in Lithuania and Russia, but according to the latest data these are no longer active. Floating wind farm installations Floating turbines moored to the seabed offer an alternative to solid foundations and enable installation in deeper waters, even if the ice conditions in the Baltic Sea provide some challenges. A pilot facility will be installed in 2017 in German waters to test the feasibility of the approach. Wave power in the Baltic Sea Wave power is another strongly emerging form of offshore renewable energy in addition to wind power. Based on rapid technological developments recently the first commercial wave power farms are in the process of being constructed in Europe. Even if these initial developments are mainly focused in the waviest corners of Europe (Portugal, Scotland), also Baltic wave power plants might become a reality with maturing technology and falling costs. References: Bergström, L., Kautsky, L., Malm, T., Ohlsson, H., Wahlberg, M., Rosenberg, R., Capetillo, N.Å The effects of wind power on marine life, A Synthesis., Stockholm: The Swedish Environmental Protection Agency - Naturvårdsverket. Hoffmann, E., Astrup, J., Larsen, F., Munch-Petersen, S., Støttrup, J Effects of marine windfarms on the distribution of fish, shellfish and marine mammals in the Horns Rev area, Charlottenlund: Danmarks Fiskeriundersøgelser. BASREC Conditions for deployment of wind power in the Baltic sea region. Analysis part I. Enabling studies. Wind Europe 2017 Wind in Power 2016 European Statistics Heino 2013 Utilisation of wave power in the Baltic Sea region. Finland futures research centre FFRC ebook 9/
140 16. UNDERWATER CABLES AND PIPELINES Introduction A number of underwater pipelines and cables cross large distances under the surface of the Baltic Sea to connect the telecommunication and energy networks of the coastal countries with each other and the rest of the world. They are covered in this chapter to complete this overview of maritime activities in the Baltic Sea. Even if underwater cables and pipelines seem to be relatively harmless to the Baltic Sea marine environment during operation, the installation of this type of infrastructure may have environmental effects and is for this reason covered by international requirements to carry out international impact studies. They will also limit activities like fisheries and anchoring in the areas where they have been laid. There has been public concern on the environmental effects from installation and operation both power cables (Andrulewicz et al., 2003) and pipelines (REF) but the evidence for any environmental effects beyond sea bed disturbance during the construction phase are fragmentary. Underwater cables in the Baltic Sea Telecommunication and Energy transmission are the two main uses of underwater cables. A large number of underwater cables have been laid on the sea bed of the Baltic Sea even if the available information compiled by HELCOM 2017 has certain gaps (Figure 1).

141 Even if cables may be buried they can be damaged as result of human activities, specially anchoring and fish trawling. For this reason they are shown in nautical charts.
 used in electronic nautical charts.")
142 [Map legend: Underwater cables and their status in the Baltic Sea Region. The classification of status follows European Wind Energy Association s format and the International Hydrographic Organization (IHO) used in electronic nautical charts.] Telecommunication cables Even if the Baltic Sea region is geographically somewhat of a periphery, at least from the central European perspective, it is well connected to the rest of the world by telecommunication networks. Underwater cables carry over 99% or modern international telecommunication traffic, and provide the regional backbone of internet. Important internet nodes for the region are Stockholm, base of Telia Carrier, and Bonn, base of Deutche Telecom, two of the sixteen internet service providers (ISP) in the world who have the highest Tier 1 status. Usually, modern telecommunication cables are small, typically mm diameter without protective armour. Armoured fibre-optic cables may reach 50 mm diameter. Figure 2 Even if modern underwater cables, based on advanced fibre optics, are a relatively new development they can be regarded as an evolution of underwater telegraph cables laid during mid 1800s in the Baltic Sea. Examples of such early underwater cables in the region include for example telegraph cables between Helsingborg (Sweden) and Helsingör (Denmark) laid in 1855 and between Grisslinge (Sweden) and Uusikaupunki (Finland) laid in 1869, the latter providing connection between Europe and the Far East via Russia. Energy transmission cables Energy transmission between countries and offshore installations is another common use of underwater cables for their high reliability, security and cost-effectiveness.
143 Power cable diameters are up to 300 mm depending on the current-carrying capacity and the amount of armor protection (ICPC, 2011a; 2011b). Underwater pipelines in the Baltic Sea A number of underwater pipelines for transporting energy products such as gas between countries have been installed on the Baltic Sea seabed (Figure 3).

144 The Nord Stream pipeline, which started operating 2011 and is used for transporting natural gas across the Baltic Sea from Russia to Germany, is with its 1220 km one of the longest underwater pipelines of the world. The two oil and gas production fields in the Baltic Sea, the Polish B3&B8 as well as the Russian D6 fields, use pipelines to transport oil and gas within the fields as well as from the fields to the mainland.
145 Regulations 1992 Helsinki Convention and HELCOM Recommendations Even if the 1992 Helsinki Convention article 7 covers Environmental Impact Assessment (EIA), the more specific provisions and procedures of the 1991 UNECE convention are commonly used instead (see below). The HELCOM Recommendation 17/3 the countries should inform the Helsinki Commission about project as well as the other countries that could be affected by the installation of the new cables UNECE Convention on transboundary EIA and its 2003 SEA protocol The United Nations Economic Commission for Europe (UNECE) Convention on Environmental Impact Assessment in a Transboundary Context (UNECE, 1991), or the Espoo Convention, and its SEA protocol (Anon., 2003) aim ensure the sustainability of large scale infrastructure developments such as international pipelines [and cables]. Even if not covering the Russian Federation, the Baltic Sea contracting parties have discussed maritime and land-based projects as well as MSP itself within the main bodies but also within regional Baltic Sea cooperation seminars (UNECE, 2012). International Conventions The installation and operation of submarine cables and pipelines are regulated and protected by a number of international treaties including i.e.: : United Nations Convention on Law of the Sea (UNCLOS) : The Geneva Conventions of the Continental Shelf and High Seas : The International Convention for the Protection of Submarine Cables Future trends Planned pipelines A second Nordstream gas pipeline project along the first is currently in an advanced planning phase. Other international pipeline projects in the Baltic area include two new gas pipelines between Germany to Sweden and between Denmark and Poland. References Andrulewicz, E., Napierska, D. and Otremba, Z.,(2003). The environmental effects of the installation and functioning of the submarine SwePol Link HVDC transmission line: a case study of the Polish Marine Area of the Baltic Sea. Journal of Sea Research 49, Carter L., Burnett D., Drew S., Marle G., Hagadorn L., Bartlett-McNeil D., and Irvine N. (2009). Submarine Cables and the Oceans Connecting the World. UNEP-WCMC Biodiversity Series No. 31. ICPC/UNEP/UNEP-WCMC. Helsingin Samonat, Nord Stream gas pipeline has reached sea area off Kotka. Online] Available at: ICPC (2011). a. About Submarine Telecommunications Cables. Available at ICPC (2011). b. About Submarine Power Cables. Available at
146 Quartz (2015). Cable Illustration. Available in:
147 17. OFFSHORE OIL AND GAS IN THE BALTIC SEA Introduction Even if offshore oil and gas exploration is not a large scale activity in the Baltic Sea there are three exploited oil and gas fields in the region. Two of the existing fields, called the B3 and B8, lie in the Polish EEZ and the third, Kravtsovskoye (D-6), lies west from Kaliningrad. The production rigs on D6 and B3 are connected to coast with gas (B3) or oil and gas (D6) pipelines. B8 is connected to B3 with a crude oil pipeline. The activities are likely increasing as there are plans to exploit a number of other fields in both Polish and Russian waters of the Baltic Sea. Offshore oil and gas platforms in the Baltic Sea The three exploited oil and gas fields in the Baltic Sea are located in two general areas, the B3& B8 close to each other in Polish EEZ north of the Gdansk region and D6 in Russian EEZ off the coast of Kaliningrad (cf. map). B-3 & B-8 (Poland) The B3 field is situated about 80 km north town of Rozewie, in the vicinity of the Hel Peninsula. The B3 field hosts the Baltic Beta platform which is a production facility for both oil, shipped via a tanker by to the refinery in Gdansk, as well as gas, which is transported by a pipeline to the heat and power plant of Władysławowo on the Polish coast. The operations commenced in 1992 and the extraction licence is valid until B8 is a newly developed oil field which is estimated to contain 3.5 million tonnes of recoverable crude oil. Operations on the Petrobaltic rig on B8 commenced in 2015 with a licence valid until 2031 and produce [250,000t] annually. The B8 field is situated 35 km from B3 and the two are connected with an underwater pipeline which carries crude oil from the [drilling/pumping] operations in B8 to the production platform on B3. There are also two gas deposits, B4 and B6, which are yet unexploited but for which Lotos holds licenses which are valid until D-6 (Russia) Kravtsovskoye (D-6) oil field lies 22.5km west from the coast of Kaliningrad region and is estimated to contain 9.1 million tons of recoverable crude oil. Extraction began in 2004 and today two rigs are in place on the D-6 field, both operated by Lukoil. The field produces [600,000t] of crude oil annually. Produced oil and associated gas is transported by a 47-kilometre underwater pipeline to the Romanovo oil-gathering unit. Crude oil is exported through the Izhevsky oil terminal. Offshore oil and the environment There are environmental impacts related to all stages of oil and gas activities, including initial exploration, production and final decommissioning: oil discharges from routine operations, the use and discharge of chemicals, accidental spills, drill cuttings, atmospheric emissions, low level naturally occurring radioactive material, noise, and to some extent the placement of installations and pipelines on the sea bed (OSPAR 2009). In addition, tanker traffic, oil pipelines and possibly even wells may be potential sources of larger oil spills.
148 Regulations 1992 Helsinki Convention and HELCOM Recommendations The Article 12 Exploration and exploitation of the seabed and its subsoil of the 1992 Helsinki Convention states that each Contracting Party shall take all measures in order to prevent pollution of the marine environment of the Baltic Sea Area resulting from exploration or exploitation of its part of the seabed and the subsoil as well as ensure that adequate preparedness is maintained for immediate response actions against pollution incidents caused by such activities. The Annex VI Prevention of pollution from offshore activities of the Helsinki Convention further describes procedures and measures for the Contracting Parties undertake to avoid pollution. HELCOM Recommendation 18/2 on Offshore activities adopted in 1997 recommends e.g. that marine protected areas are excluded from exploration and exploitation activity and that an environmental assessment should be conducted in the area of offshore activity before granting a permission. HELCOM Recommendation 19/17 on Measures in order to combat pollution from offshore units adopted in 1998 recommends that each offshore unit has a Pollution Emergency Plan and requests the Governments to exchange information on offshore activities, discharges and contingency measures. Zero discharge principle There is a zero-discharge principle in place for discharges of oil-containing water, solid wastes and specific production chemicals included in black and red lists, from offshore platforms in the Baltic Sea. This approach was adopted by the HELCOM Ministerial Meeting [However, results on any monitoring carried out to implement this principle are not reported regularly to the non-producing coastal countries.] Future perspectives New fields entering production In 2015, Lukoil reported an oil discovery at its D33 block, with recoverable oil reserves estimated at 21.2 million tons, making it the first mid-sized field of the Baltic Sea. Also four other fields in the Russian EEZ off Kalinigrad (D-41, D-29, D-6-Yuzhnoye, D-2) have plans and if realised peak aggregate output of 2.15 million tons per year would be attained by Lotos has plans to exploit the two gas deposits, B4 and B6, with aggregate reserves of 4 BCm and presumed annual output of 250 MCm. Other fields In Sweden exploration drilling since 1990s have produced minimal results and several companies have let their permits lapse. Svenska Petroleum in 2009 was denied test drilling in the Baltic Sea Lithuania has so far taken no steps at all to assess its hydrocarbon potential. Latvia has an offshore field, the E6-1 block belonging to Balin Energy, was discovered already in 1984 but its assumed reserves of 2-3 million tons might prove uneconomic to exploit. In Denmark licences for exploration and production of hydrocarbons are awarded according to two different procedures, depending on where in Denmark the area is located. Licensing rounds are held for the most attractive area in the North Sea, which is situated west of 6 15' eastern longitude. In the rest of Denmark, including the Baltic Sea, licences are granted according to the Open Door procedure.
149 References OSPAR 2009 Assessment of impacts of offshore oil and gas activities in the North-East Atlantic.
150 18. SUBMERGED HAZARDOUS OBJECTS IN THE BALTIC SEA Introduction An unquantified amount of dumped hazardous waste, warfare material as well as potentially polluting wrecks lie on the Baltic Sea seabed. These have ended up where they lie as a result of an accident, in the case of wrecks, or as a result of wilful dumping. In many cases these objects remain on the seabed as a potential or actual hazard to the marine environment but also to humans. Even if the location of certain types of objects, such as mines, chemical munitions and wrecks, are relatively well known, there are large uncertainties around the amounts or types of submerged hazardous objects in the Baltic Sea. Even if technological means are available to actively remove and dispose these objects, such operations are expensive and include a risk of worsening the situation by spreading the contaminants in the surrounding sea area. As a result there is generally little interest in active mitigation in the coastal countries except in certain high risk cases. Systematic mapping and assessment of submerged hazardous objects would need more studies and likely also new, more cost efficient underwater technology. Submerged hazardous objects in the Baltic Sea Dumped, and other submerged warfare materials Especially after the Second World War there was a need for an economic and efficient way of disposing the enormous quantities of warfare material which was no longer needed. The solution was commonly to dump it to the sea, including the Baltic Sea. The total amount of warfare material in the Baltic Sea is not known even if more information is available on certain types, particularly chemical munitions and mines. Warfare material on the seabed of the Baltic Sea can be divided into two major categories conventional munitions, including dumped military material (DMM), unexploded ordnance (UXO) and mines, as well as chemical munitions. These include substances which are not only a hazard for human life but also for the marine environment. Dumped warfare material in the Baltic Sea emerged as an issue during the 1980s as it was identified as a danger to the general public, especially groups like fishermen. Even today, the possibility of people encountering warfare materials while working in the marine environment of the southern and western Baltic Sea cannot be ruled out (e.g., fishermen and workers involved in offshore construction activities). Perhaps the type of warfare material which has received the highest level of attention during the last decades is chemical munitions (HELCOM 1995, HELCOM 2013). Around 40,000 tonnes of chemical munitions were dumped mainly item-by-item from ships within, or en-route to, designated dumping areas (Figure 18.1 next page), e.g. close to Bornholm (HELCOM 2013). It is estimated that these chemical munitions contained, during dumping, some 15,000 tonnes of chemical warfare agents (HELCOM 2013). Chemical munitions may also occur outside the designated dumping areas as munitions are known to have been thrown overboard while ships were on their way in order to save time. As some munitions were dumped in wooden cases some may have also drifted outside the area where they were actually dumped.

151 Figure 18.1 HELCOM maintained until recently an annual record on the reported incidents related to chemical munitions caught by fishermen. There is a clear decrease in the annual number of reported incidents, with the exception of Possible reasons for this decrease are changes in the local abundance of fish, fewer fishing hours, the use of state-ofthe-art fishing gear and gaps in national reports. As there are uncertainties associated with the reporting of incidents, the figures do not necessarily reflect the actual situation. The change in the early 1990s coincides with the decline of the fishing activities in areas off Bornholm. In addition to chemical munitions, a high number of mines have been laid to the Baltic Sea during the last wars. In the Baltic Sea approximately mines were laid in 2200 minefields during Of these 35,000 to 50,000
152 mines have been swept and removed. It is estimated that 35,000 mines may remain in the Gulf of Finland alone. The known mine locations are presented in the figure 18.2 [missing]. Finally, an unquantified but large amount of conventional ammunition (small and large caliber ammunition rounds) and other military material was dumped after the war to the Baltic Sea, mostly within the German Territorial Sea (12 nm) but also elsewhere. In addition an unknown number of unexploded ordnance (UXO) from artillery and bombs lie on the seabed along the Baltic Sea coast. Environmental effects of dumped warfare materials Particularly dumped chemical weapons contain a large amounts of substances, some of which may cause a hazard to the environment or the marine environment. The 2013 HELCOM report dedicated to dumped chemical munitions describes 15 different substances or compounds used in chemical munitions. According to existing knowledge, chemicals originating from chemical warfare materials can contaminate the nearby area but also spread from the disposal sites of the containers due to natural and anthropogenic processes. However, so far no chemical warfare agent parent compounds or degradation products have been detected in the water column in measurable quantities. The environmental impact of chemical warfare agent mixtures has not either been thoroughly assessed by e.g. ecotoxicological means. In certain areas in the southern Baltic Sea (Germany, Poland and Latvia), beach visitors have come into contact with white phosphorus, used in chemical munitions, washed ashore. This incendiary agent can cause severe burns and is highly toxic. According to the historical information available, sulfur mustard is the most abundant chemical warfare agent in the dumped munitions. This chemical agent poses a present risk to humans who come into contact with it, and to organisms within its immediate vicinity, taking into account both short- and long-term effects. Polluting wrecks A relatively large number potentially polluting wrecks lie on the Baltic Sea seabed, containing oil or other environmentally harmful substances either as cargo or, more commonly, as fuel. However, there is currently no available Baltic Sea wide dataset or register of polluting wrecks which would enable a full regional overview. The figure 18.3 below presents the location and size of wrecks in the Baltic Sea based on the available data from Sweden, Poland and Estonia.

153 Figure Sweden, Estonia and Finland have completed a dedicated studies classifying potentially polluting wrecks in their waters. In Sweden a comprehensive national register containing close to underwater objects in Swedish waters was analyzed in Of these 2700 wrecks were selected as of interest having certain potential for environmental hazard using explicit criteria (wrecks 100 GT or larger, wrecked after year 1900, used and had on board oil product or similar, carried environmentally hazardous cargo or from which leakage had been observed). 316 of the potential wrecks were
154 confirmed as having of potential environmental hazard and further studies identified 31 wrecks as being of acute concern. In Estonia out of total 705 identified wrecks 84 have been identified as having potential for risk of oil leakage, of which 14 have been confirmed as having a risk of oil leakage. In Finland 46 wrecks were identified in 1999 to potentially carry over 100 tons of oil, 13 of which were confirmed to carry this volume. Environmental effects of polluting wrecks Possible release of hazardous cargo or fuel from the large number of wrecks in the Baltic Sea has been recently highlighted as a potential issue of regional concern as sudden leakages may result in an emergency spill response operation similar to spills from maritime or coastal accidents. Historic dumping of industrial and radioactive waste Modern environmental legislation developed in the Baltic Sea countries only during the 1950s-60s and before this period the sea was a legal disposal site for waste, both solid and liquid. As a large part of this historic dumping was done by individual industrial facilities, municipalities and even private persons much of this dumping is very poorly documented. Some of the dumped material might be hazardous and resist degradation over time and thus remain as an environmental hazard on the seabed. Some dumping sites or hazardous waste have been identified accidentally during hydrographic soundings or when searching for mines or wrecks. In some cases, particularly regarding dumping of radioactive waste, dumping was carried out by national authorities and thus more readily available. For example, according to an overview on disposal of radioactive wastes at sea done by IAEA (IAEA 1999) on the request by IMO London Convention CPs, at least Sweden and Russia have carried out dumping of radioactive waste in the Baltic Sea mainly during the s (IAEA 1999, page 48 Sweden, page 77 Russia). Year Country Location Amount GBq Ci 1959 Russia 65 44'N, 35 54'E 600m3 <10 0, Russia Near Gogland island 100m3 10 0, (two operations) Sweden Landsort deep 43, 75 m3 (230 containers, 64 t) ,4 Table 18.1 There are also identified examples of historic dumping of other types of industrial waste to the Baltic Sea. One example is the more than Barrels containing hazardous waste with estimated 10 tons of Mercury, encapsulated in concrete, dumped during the 1950s and 60s in the Bothnian Sea outside Sundsvall (Åstön, Brämön and Sundvallsfjärden). Some thousands of the dumped barrels were observed during geological investigations in 2006 and more have been detected over time. The quicksilver-containing material in the barrels is catalysator mass from vinyl chloride (raw material for PVC plastic) production. However, this is likely just one of many as similar industrial activities producing hazardous waste took place in many areas around the Baltic Sea during the 1950s and 60s.
155 Environmental effects of historic dumping of industrial and radioactive waste As the amounts, types and locations of historic dumping of industrial waste remain largely unknown, it is not possible to estimate the possible environmental hazards involved. Regulations 1992 Helsinki Convention and Recommendations The 1992 Helsinki Convention has a dedicated article 11 and Annex V addressing Dumping. According to Article 11 the Contracting Parties shall prohibit dumping in the Baltic Sea Area with the exception of dredged material, if the criteria specified in Annex V are met, as well as under specific circumstances when dumping is the only way to ensure safety of human life. London Convention 1972 and Protocol 1996 (see descriptions under Chapter 7 Marine Litter) Nairobi International Convention on the Removal of Wrecks 2007 The Nairobi International Convention on the Removal of Wrecks, 2007, provides a legal basis for States to remove, or have removed, shipwrecks that may have the potential to affect adversely the safety of lives, goods and property at sea, as well as the marine environment. It mainly addresses wrecks outside the territorial sea but has also an optional clause by which a Contracting party may make it applicable in the territorial sea. It makes shipowners financially liable and require them to take out insurance or provide other financial security to cover the costs of wreck removal. It will also provide States with a right of direct action against insurers. Basel Convention 1989 The 1989 Basel convention restricts transboundary movements of hazardous waste, particularly from more to less developed countries. Active removal of hazardous underwater objects As mitigation/ active removal of hazardous underwater objects is generally expensive, and as such operations involves certain risks of worsening the situation by spreading hazardous substances to the marine environment, the default decision of many national authorities has been to leave the material on the sea bed (e.g. HELCOM 2013). The exception is mines which are systematically and regularly cleared in the region, e.g. by BOSB the regional cooperation structure on ordnance clearance. However, depending on the situation and with increasing knowledge active removal has been considered as a viable option (e.g. HELCOM 2013). For example, proactive removal of oil from wrecks has potential for cost-effectiveness as this can be planned in advance and can be carried out relatively safely using modern technology. In view of the increasing utilization of the seafloor for economic purposes (e.g., offshore wind farms, sea cables, pipelines), the risk of encountering hazardous submerged objects is likely increasing in the Baltic Sea.
156 Future perspectives Mapping historic dumping of hazardous industrial waste in the Baltic Sea It is possible that more historic dumping sites of hazardous waste comparable to the few identified cases await detection on the Baltic Sea seafloor. National overviews of such historic dumping is not available in the Baltic Sea and information on this topic is in general scarcely available. Historic dumping of hazardous waste could be mapped in future regional initiatives. Mapping and classification of polluting wrecks in the Baltic Sea There is currently no available Baltic Sea wide dataset or register of potentially polluting wrecks. The ongoing HELCOM SUBMERGED initiative to create a regional dataset of potentially polluting wreck would benefit from region wide projects or similar studies. Current illicit trafficking and dumping of waste in the Baltic Sea Illegal trafficking of waste has been rising recently particularly between countries in North West and North East Europe (EUROPOL 2013). Criminals are exploiting the high costs associated with legal waste management and are in this way making substantial profits from illegal trafficking and disposal activities, circumventing environmental legislation. According to EUROPOL criminals make use of a wide variety of improvised illegal dumping sites such as gravel and sand pits, abandoned industrial facilities, open-cast mines. Recent illegal dumping at sea has been documented in other parts of the world but so far not in the Baltic. References IAEA 1999 Inventory of radioactive waste disposals at sea. IAEA-TECDOC ISSN EUROPOL 2013 Threat Assessment Environmental Crime in the EU. Europol public information. 18 pp. HELCOM 2013 Chemical Munitions Dumped in the Baltic Sea. Baltic Sea Environment Proceedings No pp.
157 19. LEISURE BOATING IN THE BALTIC SEA Leisure boating in the Baltic Sea Particularly in the Sweden, Denmark and Finland but also Germany leisure boating, particularly sailing, has long history and strong traditions. Sweden, Denmark and Finland belong to the countries in the world with the highest per capita boat ownership. During recent years leisure boating has increased in popularity also in the other coastal countries. Even if national registers and figures of boat ownership are available in many countries (e.g. Transportstyrelsen 2016) it is difficult to use them to identify the number of leisure boats actually used in the Baltic Sea. National summary figures and registers also include boats used in inland waters, which represents a significant share in countries like Sweden and Finland. Based on available estimations from satellite image counts in the order of of boats were observed in leisure boat marinas along the Baltic Sea in 2016, most of them in Sweden, Denmark, Finland and Germany (Fig & 19.3 next page) (Johansson & Jalkanen 2016). These figures does not account for all boats and thus likely underestimates the number of boats (Johansson & Jalkanen 2016). Usually leisure boating in the Baltic Sea takes place along the coastline, with relatively few offshore voyages. Figure 19.1

158 Figure 19.3 The biggest leisure boats over 100 GT are registered as IMO ships. In 2016, there were only 23 of these yachts visiting the Baltic Sea and they are mostly registered in countries outside the Baltic Sea Region (cf. Fig. 19.2).
159 Figure 19.2: number of IMO yachts per flags Environmental issues related to leisure boating Leisure boats are potential sources of waste water, underwater noise, emissions of active substances in antifouling paints as well as exhaust gases (e.g. Johansson & Jalkanen 2016). However, due to the limited size of leisure boats they are usually considered as a minor pollution source. Inversely, leisure boating -particularly canoeing, rowing and sailing -likely contributes to environmental awareness as boaters spend time in directly depending on the nature and its elements (Hasselström, 2008). Regulations 1992 Helsinki Convention and HELCOM Recommendations Even if most IMO regulations address only to larger vessels, certain discharge regulations apply to pleasure craft based on the Helsinki Convention 1992 (entered into force 17 January 2000). As an example, small vessels built on or after 1 January 2000 and fitted with a toilet should as a general rule comply with the sewage discharge regulations of Annex IV to MARPOL (1992 Helsinki Convention Annex IV, Regulation 5) and be able to connect to sewage reception facility pipes (Guidelines available in HELCOM Rec 22/1). Small vessels built before 1 January 2000 can be exempted by the Baltic Sea countries from this obligation if the installation of toilet retention systems in these ships is technically difficult or the cost of installation is high compared to the value of the ship. Currently Finland and Sweden have national regulations in place on sewage discharge from small vessels under their flag. Dumping of waste to the sea is equally forbidden from leisure boats as it is from larger ships. Future perspectives Recycling end-of-life boats Most boats in the Baltic Sea, according to some studies well over 90% (Transportstyrelsen 2016), are made of glass fibre reinforced plastic materials. Fibre reinforced plastic is highly durable material but eventually these boats will reach the end of their useful life and need to be disposed of in an environmentally responsible manner. As regulation is starting to restrict the disposal of FRP to landfill, relatively costly recycling will become the only realistic option. Currently, there appears to be little incentive for innovation in green design and the development of new marine products that are more sustainable throughout their life-cycle and during scrapping and recycling.
160 Noise from leisure motorboats Especially in coastal areas, recreational motor boating is one potentially important source of underwater noise. However it is challenging to map this source as it is not covered by existing maritime surveillance such as AIS. Instead, alternative methods enabling the extraction of acoustic signatures of different types of boats could be applied. In parallel, a dialogue with the leisure boating community is needed to promote good boating behaviour (slow speeds in sensitive areas, good engine maintenance and lower engine noise). References Hasselström, L Report 5878,Tourism and recreation industries in the Baltic Sea area Economic Marine Information. [ Transportstyrelsen 2016 Båtlivsundersökningen En undersökning om svenska fritidsbåtar och hur de används. RAPPORT Dnr TSG Mars Johansson L. & Jalkanen, J-P Activity data for the Baltic pleasure boats. Deliverable 1.3, type DB. SHEBA. 10 p.
161 20. Future trends in maritime traffic Introduction This chapter focuses on future scenarios for maritime traffic in the Baltic Sea area. As a basis it includes a literature review on the scenario work done within the Baltic Sea region over the past few years. Also, it reports the results of a questionnaire study conducted based on the key factors for development identified through the literature review. Previous scenario work in the Baltic Sea area SHEBA project SHEBA project developed scenarios for shipping in the Baltic Sea for the years 2030 and The goal was to assess impact of shipping on the Baltic Sea region environment and on ecosystem services (Fridell et al., 2016). SHEBA project has also made an extensive literature review and presents a table with the existing scenario work within the Baltic Sea area, methodology used and a short overview of the types of scenarios made. The scenario work reports that were considered the most relevant for the Baltic Sea shipping development are summarized below in the following chapters. The documents chosen for summaries fulfilled the following criteria: 1. Document directly addressing shipping developments OR 2. the geographical scale was limited on the Baltic Sea or Europe WWF: Future Trends in the Baltic Sea WWF Baltic Ecoregion Programme focused on making scenarios for the period until 2030 (WWF, 2010). The scenarios were made separately for fifteen different sectors covering most human uses of the marine areas across the Baltic Sea region and the goal was to find out if the future visions for different sectors and especially the related sea use would overlap. The chapters related to maritime transport handled shipping, ports and tourism and recreation. The report mentions shipping in the executive summary showing the most striking growth in human uses of the sea: the prediction was that the number of ships in the region would double within the 20 years. The report predicts an increase from about ships per month to more than 9000 ships every month (see figure 20.1 below). Furthermore, the prediction is that the size of ships will increase considerably over the study period. Figure 20.1: Increase in number of ships per month. Source: WWF, The report makes a separate scenario for oil transports as the development and expansion of ports in Gulf of Finland is considered to play an important role in the general growth of shipping numbers. According to the WWF scenario, the amount of oil shipped in the Baltic Sea would grow by 64% by 2030, from about 180 million tons to almost 300 million tons.
162 Assuming that the tanker ship size would grow and all the oil transports would be done with fully laden Aframax size class tankers with a draught of about 15 meters (maximum draught that can enter the Baltic Sea through Danish straits) and cargo carrying capacity of about metric tons, transporting 300 million tons of oil would require minimum 3000 voyages per year, or about 8 tanker voyages per day. Transporting the current 180 million tons of oil would require about 1800 Aframax voyages per year, or five voyages per day. The actual number of ships would however be much larger, as most crude oil and products tankers operating in the Baltic Sea area are smaller than Aframax size class (or cannot be fully laden to keep the draught at acceptable level), as currently rare ports in the Baltic Sea can receive ships up to 15 meters draught. The report mentions the sea use aspect of safe manoeuvring and recommends sufficient safety zones around the shipping areas. If the prediction of growing ship size is accurate, the importance of safety zones is even greater. This will be complicated in the many shallow and narrow areas of the Baltic Sea where the cargo ships and oil tankers are voyaging. Ports are likewise predicted to grow and dredging of ports and entrances to ports is likely to become more common, to accommodate the larger ships. Blue Growth study (European Commission) The shipping related scenarios were especially for short sea shipping. Identified trends included the increase in LNG especially for the Baltic Sea short sea shipping. The document included also an impact scenario, predicting strong positive trend for market share, mild positive trend for employment and energy consumption and mild negative trend for aquatic life and natural habitats (especially due to lacking regulation for underwater noise), although the report mentions that the more stringent ECA regulations in the Baltic Sea will reduce certain types of harmful emissions. The scenario also predicts possible fuel cost fluctuations due to the pressure on the refinery industry to deliver large amounts of low-sulphur fuels (Ecorys, Deltares, OceaniC development, 2012). The project made also a cluster report for cruise tourism and predicted increase in the size of ships due to more intense price competition. The study mentions the Baltic Sea cruise tourism as one of the areas that may benefit for increasing fuel prices as the destination ports are close to each other. Improving port facilities and development of attractive destinations is one of the main drivers for the industry. In the Baltic Sea, this is likely to benefit the ports where the large cruise ships can berth close to city centers. The trend of cargo ports moving away from city centers may create new opportunities for the cruise ships to take over the cargo infrastructure. A third maritime-related cluster report is related to maritime surveillance, and predicts increase in security surveillance in Europe. The development is however dependent on possible adoption European system of data sharing, and the negotiations for such an agreement within Europe are predicted to take several years. Pilot projects in European basins (such as the Baltic Sea) are however likely.
163 Global Marine Trends 2030 (Lloyds register) This report is more focused on the global phenomena driving shipping patterns: Population growth and aging population in developing countries, GDP growth, resources geography and environment. The report further focuses on the developments for global demand for oil, LNG, steel, coal and certain other raw materials and products, as well as global fleet and fleet ownership characteristics. Such developments are relevant for the Baltic Sea shipping, especially regarding the raw materials transport from the Baltic Russian ports, but the scale of these scenarios is rather wide and it is hard to identify specific trends to the Baltic Region (Lloyd's Register, QinetiQ, University of Strathclyde, 2013). Shipping 2020 (Det Norske Veritas) The Shipping 2020 report does not address the Baltic Sea specifically but it has built four comprehensive scenarios for world economy, shipping, environmental regulations, fleet growth, fuel prices and technology and innovation that can be applied to the case of the Baltic Sea. The scenarios extend only till 2020, but the last chapter also identifies trends and drivers beyond the scenario timeline. These drivers include for example research on black carbon from shipping, hull-fouling and underwater noise. Furthermore, the chapter mentions certain innovations that are considered important for the future development of shipping. These include green fuels, low-energy ships, arctic transport, digitalization of navigation and development of electric engines and battery technology (Det Norske Veritas, 2012). HELCOM Maritime scenarios: Methodology Method used for scenario building is the Delphi method. The Delphi method was developed in to collect expert judgements on variety of topics and described in detail by (Linstone & Turoff, 1975) Key factors for the Delphi study were identified based on the key topics in the HELCOM Maritime Assessment. The identified key factors were assessed using the real-time Delphi method (RT-Delphi), described by (Gordon & Pease, 2006). The Delphi method gives the stakeholders an opportunity to express their personal ideas and opinions freely, as the panel is anonymous. RT-Delphi differs from the traditional Delphi in number of questionnaire rounds. While the traditional Delphi is done in three or more rounds to reach consensus, RT-Delphi requires only one round. The goal is to develop new ideas concerning future developments but not necessarily reach consensus. The panelists receive a report of the answers of other participants immediately after answering. Real time delphi survey was conducted during the HELCOM MARITIME meeting in Tallinn. The participants were given an opportunity to answer the questionnaire before the meeting and during the meeting there was a briefing on the research goals and using the Delfoi portal. After the briefing the participants were given 10 minutes to answer the survey. They were also informed that they could continue answering to the survey until the end of the day, after which the survey would be closed. Description of the Delphi-exercise The questionnaire consisted of three groups of questions: 1. Increase in shipping - Where will it happen? First key factor to consider was the increase in shipping traffic. The general assumption of any scenario work in the past has been that shipping is increasing and will continue to increase. Therefore, the participants were not asked to evaluate whether shipping increases, but where the impacts of increasing shipping will be mostly seen. 2. Environmental impacts - What impact will these pressures have in the future?
164 Impacts of the identified key factors were evaluated based on two criteria: Firstly, the participants were asked to evaluate the SIGNIFICANCE of the impact of different environmental issues of shipping to the state of the Baltic Sea marine environment by Secondly, the participants were asked to evaluate the PROBABILITY of these issues causing degradation to the state of the Baltic Sea by Environmental actions - What impact will these actions have in the future? Actions to respond to any negative impacts of the identified key factors were evaluated based on the same criteria as in the previous section: the SIGNIFICANCE, or importance of the actions and the PROBABILITY of the actions being carried out successfully by The goal was to evaluate the actions that can be taken to mitigate or avoid environmental impacts of shipping. The answers were given on a scale of four: Very significant/probable, significant/probable, somewhat significant/probable and not significant/probable. The results were analyzed by giving points for each answer in a following way: answers placed in far ends of the scale (very significant/probable and not significant/probable) were given 2 points and the mid-scale answers were given one point. The points were then counted together for the more positive points (Very significant and significant) and more negative points (Somewhat significant and not significant). The classification to Low, Medium and High was made by counting the percentage of positive/negative points. 0-33,3% was deemed as low 33,3-66,6 as medium and 66,6-100% as high. The identified key factors and the results Increasing shipping Existing predictions for the future of maritime transport in the Baltic Sea mention a strong increase in shipping traffic. The number of ships in the Baltic has been estimated to double between The increase has been anticipated to occur due to expanding oil terminals and subsequent oil transports, regional development and increase in cruise ship tourism in the Baltic Sea area (WWF - Future Trends in the Baltic Sea 2010) The latest shipping growth scenario is done by SHEBA project (Fridell et al., 2016). Their project deliverable presented three scenarios called "Sustainability", "Business as Usual" and "Fragmentation" (see figure 2). In short, the sustainability scenario illustrates a Baltic Sea area where there is high concern of environment, with policies that require use of abatement technologies and alternative fuels and support development of such environmental technology. Global economic growth is strong and population growth is low. Business as usual is the current trend-scenario where the global economic growth is stable and global population growth will slowly begin decreasing by the end of the 21st century, dependency on fossil fuels is decreasing slowly and development of new clean shipping technologies is as today. Fragmentation scenario illustrates a Baltic Sea where environmental goals are not reached, the abatement technologies and alternative fuels development is weak. Global economic growth is slowing down and there is strong increase in global population.
165 Figure 20.2: Shipping scenarios adapted from the SHEBA scenarios (Fridell et al., 2016) The participants evaluated which basins will be mostly affected by the increase of shipping in the Baltic sea. Results from the Delfoi-exercise are presented in figure The Gulf of Finland (GoF) was considered most affected by increase in cargo and tanker shipping. The participants clarified in their comments that the predicted impacts are mainly due to traffic between the GoF ports (Especially Primorsk and Vysotsk) and routes or ports within other basins or outside the Baltic Sea, and not increase in the shipping between the ports within the GoF. This also explains why the rest of the areas where biggest change in shipping numbers were predicted, are located along the main traffic route between the entrance to the Baltic Sea and the GoF. LNG-carrier transports were especially mentioned as a ship type that will increase in the Baltic Sea. The cruise ship traffic growth was considered to affect mainly the ports which are already more established in the cruise business. Mentioned ports and areas included Gulf of Finland: St. Petersburg, Tallinn and Helsinki, Archipelago Sea, Stockholm and Copenhagen. Secondarily there may be growth in newer destinations, eg. in Bothnian Sea and Bay/The Quark area, although establishing tourism in new areas takes time due to change in habits of the consumers and necessary infrastructure and service development. Waste reception in ports was mentioned as one requirement for cruise ship tourism development. Regarding regular passenger traffic, two developments were mentioned. First, the construction of a link between Fehmarn and Denmark may lead to less ship based passenger traffic in the Baltic Sea. Second, a regular ferry line connection between Poland and Lithuania was mentioned as a possible future development for Baltic Ro-Ro and passenger traffic.

166 Figure 20.3

167 Figure 20.3: Results summary from Delphi excercise in Tallinn, September 2016
168 Anti-Fouling paints Environmental Impact Actions Significance/Severity for Baltic Environment Probability of damage by 2030 Significance of actions Probability of effective actions by 2030 After ballast water management convention is set in force and the risk of species introductions from ballast water discharge is reduced, biofouling will be the main vector for species introductions in the Baltic Sea and the issue will gain more attention. The challenge is tackling invasive species with Anti-Fouling innovations that are effective but less harmful for the environment. There are two possible development straits. At least in the beginning there may be difficulties to reduce the harmfulness of the paints to the marine environment due to the pressure of reducing marine species invasions. A species invasion may have even more devastating effects on the Baltic Marine ecosystems than the harmful effects from anti-fouling paints. On the other hand, more research and general attention to the issue may speed up the innovations process and finding new, less harmful solutions. Chronic oil pollution & residual discharges Environmental Impact Actions Significance/Severity for Baltic Environment Probability of damage by 2030 Significance of actions Probability of effective actions by 2030 The issue of residual discharges can be addressed by improving the reception facilities for tank cleaning effluents. Positive developments are likely to be seen in the Baltic Sea area by Member states and ports are working on this subject and are making progress (as shown during CP PRF and similar national events.) With the implementation of SECA, we may see an increase in scrubber emissions unless emission standards for the effluents will be enforced or scrubber water discharge is prohibited. Chronic oil pollution remains a significant environmental impact in the Baltic Sea due to its long-term effects on the environment.
169 Underwater noise Environmental Impact Actions Significance/Severity for Baltic Environment Probability of damage by 2030 Significance of actions Probability of effective actions by 2030 Underwater noise does have an impact on the Baltic ecosystem albeit little is known of impacts on species on population level. Underwater noise has localized impacts in the Baltic Sea but it is not considered likely to cause severe damage to the Baltic Sea marine environment by It is unlikely that specific actions will be taken by 2030 to address the issue. The results for underwater noise indicated that the probability of actions taken by 2030 to tackle the issue is low. The significance of such actions was also considered low. Issue with underwater noise may be partly solved with more silent alternative propulsion systems as they become more common. However, the cavitation noise from propellers is a major source for underwater noise and cannot be solved by reducing engine noise, but with propeller design. Airborne CO2 emissions Environmental Impact Actions Significance/Severity for Baltic Environment Probability of damage by 2030 Significance of actions Probability of effective actions by 2030 Airborne emissions of CO2 from shipping will have a strong negative impact on the Baltic Sea environment by It is very likely that we will continue seeing damage in the Baltic Marine Environment caused by CO2 emissions for the next decades. However, using alternative fuels in the Baltic Sea area will have a significant impact on solving this matter and good development in this field will be seen by LNG ships are considered as a likely ship type to increase in the Baltic Sea area. Hybrid Diesel-electric with additional wind and solar propulsion. All electrical engine solutions are highly dependent on the development of battery technology. Currently the alternative propulsion systems are mainly pilot projects and unless there will be considerable political will to develop the systems, significant development will not be seen by 2030 and fossil fuels will be used in shipping as today
170 SECA Environmental Impact Actions Significance/Severity for Baltic Environment Probability of damage by 2030 Significance of actions Probability of effective actions by 2030 SOx emissions will drop significantly, improving the state of the Baltic Sea and the air quality of surrounding countries. Increased use of alternative fuels by 2030 will also play a role in the SOx reduction. Retrofitted and newly built scrubbers will become more and more common and there will be somewhat significant effects to the state of the Baltic Sea caused by the scrubber emissions containing sulphuric acid and number of other pollutants, unless the scrubber water discharge is prohibited. Low-sulphur fuels and scrubbers are likely to reduce the SOx emissions at the first stage. The increase in LNG vessels and alternative propulsion systems may reduce the SOx emissions as they become more common in commercial shipping traffic. NECA Environmental Impact Actions Significance/Severity for Baltic Environment Probability of damage by 2030 Significance of actions Probability of effective actions by 2030 NECA Tier III regulations will stand in force by 2021 and new ships build after this will have technology that reduces NOx emissions to Baltic Sea. There will still be significant NOx emissions by 2030 due to the fleet renewal rate but the emissions will start decreasing with new ships entering the Baltic Sea fleet. Despite the designation of the Baltic sea as a NECA, NOx emissions will still be significant in 2030 as the NECA will only affect new ships built on or after Ships in the future are likely to use more LNG as fuel source therefore complying with NECA. Hybrid diesel-electric engines with additional solar or wind propulsion, reducing diesel usage and therefore NOx emissions may also have an impact if the technology development continues. The new ships fitted with fossil fuel engines must install abatement technology to comply with NECA Tier III. Marine Litter Environmental Impact Actions
171 Significance/Severity for Baltic Environment Probability of damage by 2030 Significance of actions Probability of effective actions by 2030 Issue of marine litter from ships will be effectively addressed by This will be done mainly by improving the reception facilities in ports. However, the actions will have limited significance for the Baltic Sea Marine environment as main sources of plastic pollution are from land-based sources. Monitoring of transfer of waste within Baltic ports will help to control the volumes of waste and will facilitate better adjustment of port services as well as the proper management of waste within the ports. Sewage discharge Environmental Impact Actions Significance/Severity for Baltic Environment Probability of damage by 2030 Significance of actions Probability of effective actions by 2030 The revised MARPOL Annex IV will enter fully into force by 2021 and both old and new passenger vessels are not allowed to discharge untreated black water in the Baltic Sea. Port reception facilities are an important factor in reducing sewage discharge by Sewage treatment facilities installed on board are also likely to play a role, although MARPOL Annex IV has no requirements for the operation of the sewage treatment plants. There are no operational standards for the effluent quality. The treatment standards need to be enforced as for example done for cruise ships discharging in Alaskan waters and for the discharge of treated sewage on river cruise vessels in Europe. Such treatment standards should also cover graywater discharge.
172 Ballast water management Environmental Impact Actions Significance/Severity for Baltic Environment Probability of damage by 2030 Significance of actions Probability of effective actions by 2030 Ballast water management convention will enter in force by 2017 and ships will comply with the new regulations. The risk of new species introductions from ballast water will be reduced by It will take some years before full impact can be reached due to ongoing work on the approval of treatment systems. Despite the BWMC, species introductions will continue to be an issue in the Baltic Sea due to hull fouling. However, invasive species introductions deriving from biofouling may have a significant impact on the Baltic marine environment.
173 Large oil/chemical spill Environmental Impact Actions Significance/Severity for Baltic Environment Probability of damage by 2030 Significance of actions Probability of effective actions by 2030 The risk of a large oil or chemical spill in the Baltic Sea exists, the increasing traffic and especially the increase in oil and oil products traffic in Gulf of Finland will add to the risk. Development of response facilities will continue and this will have a significant effect in limiting the negative environmental impacts in case an accident occurs. However, the risk of an accident can never be eliminated completely. Development of E-navigation has potential to prevent accidents to some extent. Conclusions Most likely trends The consensus from the Delphi exercise was that regarding air emissions, there will be considerable actions by 2030, although they may not be sufficient to tackle the environmental damage caused by air emissions, at least by the timeline until The reasons vary. Regarding the CO 2 emissions, the harmful effects to the Baltic environment cannot be fully prevented or stopped even if alternative fuels would be used more extensively by Seeing the full results from SECA and NECA will also take longer than 2030, due to the speed of fleet renewal, since certain regulations will only be applied to newly built ships. It is also possible that the challenges of refineries to produce sufficient amounts of low Sulphur fuels will slow down the process. Very likely positive trends for the Baltic Sea environment are regarding the ban of sewage discharge and reduction of species introductions through ballast water management. Sewage discharge is seen as a relatively simple problem to solve with the ban of discharge and development of port facilities in the Baltic Sea area. Ballast water management is standing in force during 2017 and is likely to reduce species introductions effectively by By that time, discussion and challenges regarding invasive species introductions will shift towards possible regulation of hull fouling. Least likely trends The environmental issues that are least likely to be tackled by 2030 are the toxic effects from Anti-Fouling paints. The reason may be that the forbidding of TBT based paints has been considered a great success and the toxic effects from paints based on other chemicals are not considered as harmful. In addition, the pressure to reduce species introductions via hull fouling may make it difficult to consider less harmful, possibly less effective alternatives for current paints. Underwater noise is not very likely to be thoroughly addressed by 2030, even though it is included in the Water Framework Directive. The reasons for this are probably the lack of scientific evidence on harmful effects of sound on population/species level. Also, any decisions on regulations regarding shipping noise are likely to take time way beyond 2030 to stand fully in force. It is not likely that any large-scale single event in the Baltic Sea would speed up the process of managing the issue of underwater noise, as adverse
174 environmental effects are mainly long term. Sudden adverse impacts from powerful sonar systems could be such a factor, but such noise source falls outside the scope of regular maritime transport in the Baltic Sea.
175 References Det Norske Veritas. (2012). shipping 2020 (pp. 1 68). Retrieved from NTU5LnBkZg==&decode=y Ecorys, Deltares, OceaniC development. (2012). Blue Growth: Scenarios and Drivers for Sustainable Growth from the Oceans, Seas and Coasts: Maritime Sub-Function Profile Report Short Sea Shipping (1.2) (pp. 1 38). Retrieved from 0Short%20Sea%20Shipping_Final%20v pdf Fridell, E., Winnes, H., Parsmo, R., Boteler, B., Troelzsch, J., Kowalczyk, U., et al. (2016). SHEBA - Sustainable Shipping and Environment of the Baltic Sea (pp. 1 52). Gordon, T., & Pease, A. (2006). RT Delphi: An efficient, round-less almost real time Delphi method. Technological Forecasting and Social Change, 73(4), Linstone, H. A., & Turoff, M. (1975). The Delphi method - techniques and applications (pp ). Addison-Wesley Pub. Co. Lloyd's Register, QinetiQ, University of Strathclyde. (2013). Global Marine Trends 2030 (pp. 1 75). Retrieved from WWF. (2010). Future Trends in the Baltic Sea (pp. 1 40). Retrieved from Sea
176 Annex 1 Draft methodology to create statistics and density maps from AIS data Introduction HELCOM Automated Identification Systems (AIS) data is currently used for several purposes in the Baltic Sea, for example improving navigation safety, analyzing emissions from ships or mapping underwater noise. The HELCOM Secretariat has not been able to make use of this data due to lack of resources and many projects in the HELCOM community have not taken advantage of this valuable information. Due to funding opportunities, the HELCOM Secretariat has been recently able to use AIS data to provide shipping density maps as well as statistics. Learning how to handle the large AIS dataset has not been an easy task: the tools were created from scratch to produce AIS data products. The part 1 of the document will explain the methodology used by the HELCOM Secretariat to prepare the AIS data to for producing maps and statistics. The part 2 will explain how to generate shipping density maps. Part 1: Methods to produce statistics The aim of this analysis is to produce monthly CSV files with which we can create maps and statistics based on HELCOM AIS data. To create those CSV files we worked with monthly files of pre-processed AIS data. This document explains how we add parameters to those files: Trips: Ships going from port to port. Stops: Ships stopping in a port Exits: Ships exiting the Baltic Sea Enters: Ships entering the Baltic Sea To identify these parameters, we created four types of areas. Our method tracks the ship movements between them: Exiting and entering areas of the Baltic Sea Areas outside the Baltic Sea Ports where the ships are stopping The Baltic Sea area where the ships are traveling Before this process was started, the AIS data was pre-processed to clean it and make it human readable and to remove erroneous signals. This part was done by the HELCOM Secretariat with data from the AIS HELCOM Server managed by the Danish Maritime Authority until end of Since the beginning of 2017 the server is administered by the Norwegian Coastal Administration. The following methodology was automatically repeated to each monthly files of AIS data from April 2005 to 2016 included and only for IMO-registered ships. Most of the computing tasks were done using the software R (V3.3.1) with the R Studio interface (R ). For some GIS tasks we used ArcGIS 10.4 for Desktop. The server used has the following specifications: Intel Xeon E ,30GHz 10 cores with 48 GB RAM. The method we explain outputs two files: - A CSV file with a trip Id numbers to produce density maps
177 - A CSV file describing the ships movement.
178 Ships movements: the exit and enter events This first section will explain how to identify the ships going outside and entering the Baltic Sea, area defined by the Article 1 of the Helsinki Convention. The output of this analysis are the exit and enter events table. It is a list describing which ships are leaving or entering the Baltic Sea, at what time and where. 1. Definition of the signals The very first step is to find the AIS signals from ships that could be leaving or entering the Baltic Sea. The signals are by definition the position reports from ships. The latitude and longitude are the two parameters used for this spatial analysis. We defined 5 areas as exit areas : the borders between outside and inside the Baltic Sea where the ships have to go through to leave the Baltic Sea towards the North Sea or to major lakes in the Baltic Sea Region (Lakes Vänerm, Ladoga and Saimaa). These areas are polygons between 2,4 and 16,6 km wide. Name of the exit area Skagen Goteborg Kiel Canal Neva River Lappenrenta Location Between the port of Skagen (Denmark) and the village of Kärna located 15 km north of Gothenburg (Sweden). On the Göta Canal next to the city of Kungälv (Sweden). This location marks the entrance and exit to the Vänerm lake in central Sweden. On the Kiel Canal on the Western side of the port of Kiel (Germany). This location marks a canal between the Baltic Sea and the North Sea. Along the Neva river, after the city of Saint-Petersburg (Russia). This location is used to assess the ships going to or coming from the lake Ladoga in Russia. On the Saimaa Canal, between the Gulf of Finland the Saimaa lake. We created a new column called exit area in the table (position reports from ships). For each signals that are in one of the 5 polygons, the name of the exit area was added to this new column. We also defined a second type of polygons to highlight the areas outside the Baltic Sea: a total of 4 polygons were created and are naturally located next to each of the exit polygons previously described. They are called outside areas. Name of the outside area Location Skagen / Vänerm The area of the North Sea (outside the Kattegat Sea towards the North Sea) and the Vänerm lake. Kiel The Kiel Canal. Saimaa The Saimaa lake Neva River The Neva River and the Ladoga lake We added a new column to the table to identify the signals that are outside the Baltic Sea hence inside these outside areas. The figure 1 below is showing the two exit areas Skagen and Goteborg and the

179 outside area Skagen / Vänerm. The signals that are not in the exit area or in the outside area are obviously in the Baltic Sea. These are signals from ships in ports or traveling in the Baltic Sea therefore they are in an area called inside area. Fig. 1: Location of outside and exit areas, example of the Kattegat Sea. 2. Identification of the sequences of signals in the exit areas of the Baltic Sea After the previous step, we could know the location of each AIS signals: in an exit area of the Baltic Sea, outside the Baltic Sea or in the Baltic Sea. By sorting the data by ship (IMO number) and by time, we identified the sequences of ships traveling through the exit areas polygons. A sequence is a group of signals from a ship describing a movement the exit areas. The figure 2 (below) illustrates how we built that sequence. Each one has a unique identification number: the signals are gathered into groups of signals that match the same sequence.

180 Fig. 2: Generating the sequences in an exit area. In the figure 2, the points X 6, X 7 and X 8 have the same sequence identification number. The points from X 218 to X 220 have another unique identification number. But the points from X 105 to X 108 do not have a sequence identification number: the ship is not leaving the Baltic Sea since there is no point in the outside area. This process is applied for all of the signals found in the exit areas. We give the sequence identification number to the ships following two kind of paths: inside area -> exit area -> outside Baltic or outside Baltic -> exit area -> inside area For the ships that are returning to the same area (outside or inside) than they came from, there is no sequence identification number added to the signals. 3. Definition of the sequences entering or exiting the Baltic Sea Each of the signals of AIS data have a parameter called COG the course over ground (a value from 0 to 360 ). Following the COG of the signals within these 5 polygons, we could identify if the ships were entering or leaving the Baltic Sea. The 5 exit areas polygons were located to identify the ships leaving or entering the Baltic Sea. For each signals that have a sequence identification number, a new value defining a unique direction of the boat was assigned. For example, if the boat is traveling between 90 and 270 in an exit area, we can say that the
181 boat is traveling towards the south: the value 180 is added for this signal (for 180 ). This step is done for each signals in the exit area: a new value is added (0 for traveling north, 90 for traveling east, 180 for traveling south and 270 for traveling west). This new value is called COG 2. The next step was to identify all the sequences leaving or entering the Baltic Sea through the exit areas. A function available with the software R (under the package dplyr) was used to summarize the COG 2 for each of the unique sequences and therefore the direction of the ships within the exiting area. The average of the COG2 (x COG2) was computed for each of the unique sequences. We made these calculations of COG 2 and x COG2 to avoid some unexpected ship movements in the exit areas. Finally, we selected the signals from ships going outside or inside the Baltic Sea for each exits area following the name of the location of these unique sequences: Name of the exit area Value of x COG2 for exiting the Baltic Sea Value of x COG2 for entering the Baltic Sea Skagen x COG2 = 0 (north) x COG2 = 180 (south) Goteborg x COG2 = 180 x COG2 = 0 Kiel Canal x COG2 = 270 (west) x COG2 = 90 (east) Neva River x COG2 = 90 x COG2 = 180 Lappenrenta x COG2 = 0 x COG2 = 180 After this step, we could know if the ships was exiting or entering the Baltic Sea for each exit area and for each sequence. 4. Creation of the events exit / enter The next step was to create the exit and enter events for each of the unique sequence identification number. An event is the information about the exits and enters of the Baltic Sea: Parameters created for the exit and enter events IMO number MMSI number MinTime MaxTime Event Location Sequence number Definition IMO number of the ship MMSI number of the ship Date and time of the first signal in the exit area Date and time of the last signal in the exit area Exit or Enter the name of the exit area The unique sequence of the exit or enter After the events are identified, we could know the time of exiting or entering the Baltic Sea through the 5 exit areas for each ship. This new data was stored in a temporary file and was used during the last step of the analysis.
182 Ship movements in the Baltic Sea The second section of the analysis was to create the trips and the stops events - a table with stops in ports and trips between ports or between a port and exit/enter areas. 1. The ports of the Baltic Sea First, we created 245 ports polygons around ports in the 9 countries of the Baltic Sea. We used this method: We filtered some monthly AIS data keeping only the signals where the speed of the boat was 0. We used Open Street Map, Google Maps as background images. Shipping lines produced with AIS data helped to see ship movements The publication Baltic Ports List of 2012 helped to identify ports. 2. Definition of the signals: where are the ships? Once the ports polygons were ready we wanted to check if the ships where inside or outside those areas. We plotted in R software the AIS signals and overlaid them on top of the ports polygons and the exit areas. 3. Preparation of the signals defining a stop in a port To locate the ships that are stopped in a port we used the speed of the ship which is available as the parameter SOG (Speed Over Ground) for each position reports. In theory, just filtering those ships with SOG equals zero would be enough. However, because of the accuracy of the AIS transmitter onboard the ships, it is possible that the SOG is not equal to 0 even when the ship is at berth in a port. To avoid this issue, the SOG of a ship at port with less than 0.5 knot was replaced by 0 knot. When the speed was equal or higher than 0.5 knot, we kept the original SOG the boat could be moving during the maneuver along the berth. 4. Producing the events stops in a port The next step was to generate the events stop: a group of signals with a unique sequence identification number. Each signals that were qualified as a stop from the previous step would be assigned this number. To find the stops as sequences we sorted the data by ship (IMO number) and by time. The table would show when a ship is at sea and coming into a port and is stopping (when the SOG value is equal to 0). The sequence identification number is given to the ships following two kind of paths: at sea -> at stop or stop -> at sea
183 Finally, we created the following parameters by summarizing the information by each unique identification number: Parameters created for the Definition stops sequences IMO number IMO number of the ship MMSI number MMSI number of the ship MinTime Date and time of the first signal with SOG = 0 MaxTime Date and time of the last signal with SOG = 0 Event Stop Location the name of the port Sequence number The unique sequence of stop Once we calculated the Mintime and Maxtime, it was possible to know the duration of the stops. Thereafter, we made a subset of the stops longer than 10 minutes is done which was stored as a temporary file to be used later. 5. Producing the events trips at sea After the stops at port were created we proceeded to calculate the trip of each trip at sea. Naturally, all the signals outside the 245 port polygons and in the Baltic Sea were selected as trips. To find the trips between two stops, between an enter and a stop and between a stop and an exit, we sorted the data the data by ship (IMO number) and by time The figure 3 below shows three types of situation: the signals as trips between an exit area and a stop (situation 1), between two ports (situations 2) or between a port and an exit area (situation 3).
. This is the input needed to produce lines and shipping density maps.")
184 Fig. 3: The 3 types of situations for the trips sequences We assigned a unique sequence number, called the trip Id, to each movements between the locations. Every signals of the same sequence will have assigned the same sequence number, called trip Id (cf. Fig. 4 below). This is the input needed to produce lines and shipping density maps. The same process was applied to all of the ships. These are all the parameters that we calculated: Fig. 4: Assigning the trip ID value to the sequences at sea Information collected for the trip sequences IMO number MMSI number MinTime MaxTime Distance sailed Event Sequence number Definition IMO number of the ship MMSI number of the ship Date and time of the first signal of the trip Date and time of the last signal of the trip Distance sailed Trip The trip Id value To calculate the duration of each trips we could use Mintime and Maxtime. The distance sailed was calculated during the summarizing step it is the cumulative distance between each signals of the trip Id value. This table is saved as temporary file and will be used for the next step.
185 Outputs of the process The output of the whole process are two CSV files. The first one is used to produce statistics of the events: they have to be harmonized to be relevant for further analysis. The second one is the file with the position reports from ships with a trip Id assigned to each AIS signals. These monthly files are used to produce shipping density maps. Output to produce statistics Output to produce density maps Three files per month: - A table with the exit / enter sequences information - A table with the stop sequences information - A table with the trip sequences information Monthly files with a trip Id assigned to each AIS position report. With which we can produce density maps. These three table are merged and sorted by ship (IMO number) and time. However, the files have to harmonize: for the same ship, two stop sequences or visit sequences cannot be consecutive. If some of them are consecutive, they are merged together and the duration of the events and the distance sailed at sea is corrected. The monthly files are finally merged as yearly files to generate statistics on a yearly basis
186 Part 2 Methods to produce density maps What is a shipping density map A shipping density map represents the intensity of shipping traffic in certain time period. There is no standard definition or method to create shipping density maps. We have developed a method that answers a basic question: Assuming we have a grid of cells and the trips of ships from port to port, how many times do those trips cross each cell of the grid? The process can be explained in four steps: 1 We need a grid with 1km*1km cells 2 We overlap the trips of each ship onto the grid 1km 1km 3 We count how many lines are crossing each cell 4 We apply the style darker color means more density

187 What we need before creating the density maps Before we begin to produce shipping density maps we need: The right software Monthly CSV files with all the AIS signals A grid to overlap the lines and create the maps A ship list: a csv file containing all ships per year. What software we need to create shipping density maps: We used ArcGIS 10.4 for Desktop advanced license with Spatial Analyst for creating raster layers. All scripts were written in python scripting language version 2.7 using ArcPy a Python ArcGIS scripting module. We used a dedicated server available through remote access with the following specifications: Intel Xeon E ,30GHz 10 cores with 48 GB RAM. Monthly csv files We have to be sure we create beforehand the following folders under each year. O1_trips is created in a previous process. It contains a CSV file per month: Each monthly file contains the following columns:
188 What grid do we need? We need a grid, a shapefile with square cells, in order to put the lines on top. We then count how many of them are crossing each cell. The grid file was downloaded from the European Environment Agency (EEA) and it is based on recommendations made at the 1st European Workshop on Reference Grids in 2003 and later from INSPIRE geographical grid systems. This standard grid was recommended to facilitate the management and analyses of spatial information for a variety of applications. EEA offers a grid in shapefile format for each country in three scales: 1km, 10km and 100km. We chose the 1km grid to produce high resolution maps. After we downloaded each Baltic Sea country we joined them all in one file. The resulting merged grid had more than four millions cells. We then delete the cells on land to save space and make the file easier to manage. The result was a file with about 400,000 cells. Three Steps for creating density maps Once we have the monthly csv files with the AIS signals, the folders and the grid we can start the process to create a density map. We followed three steps to create density maps: 1. Create lines 2. Divide the lines in ship types 3. Make the density map There is a python script for each step. They all use python s multiprocessing module. This module allows us to submit multiple processes that can run independently from each other in order to make best use of our CPU cores. We used a machine with 10 cores. The final result of processing one year is a density map in raster format (TIFF) per month and per ship type. That makes 96 maps. It takes about 40 hours to complete the process on average per year. All scripts will be made available in the HELCOM Secretariat GitHub. 1 Create lines NAME OF THE SCRIPT: TrackBuilderFromCSV_multiprocessing.py PURPOSE: Creates lines representing trips of ships from port to port. DURATION: three hours per year with multiprocessing. PRECONDITIONS: Before creating lines we need: A year folder under which there are csv files containing all trips per month.

189 The file name of the monthly file must have the year and the month name in English The monthly csv file must have the following columns: o MMSI o Trip_id: Number of trips per MMSI (per ship) HOW THE SCRIPT WORKS: This script reads each monthly csv file and converts coordinates to lines OUTPUT: the output of this process is a folder with lines shapefiles for each month 2 Split lines by ship type NAME OF THE SCRIPT: SplitTracksByShipType_multiprocessing.py PURPOSE: Once we have the lines shapefiles we proceed to divide each file into different ship types DURATION: two hours per year with multiprocessing. PRECONDITIONS: Before creating lines we need: A folder with monthly lines shapefiles


190 The file name of the monthly file must have the year and the month in English A ship list: a csv file with unique number of ships per year created in a previous step. This file must include at least the following fields: o IMO number o HELCOM_Gr: HELCOM Gross ship type a wide classification of ship types o HELCOM_De: HELCOM Detail ship type a detail classification HOW THE SCRIPT WORKS: This script divides the monthly line files into the HELCOM gross classification ship types: "CARGO", "CONTAINER", "FISHING", "OTHER", "PASSENGER", "SERVICE", "TANKER", "UNKNOWN", "VEHICLECARRIERROROCARGO" OUTPUT: a folder per ship type under which there are the monthly lines shapefiles 3 Make the density map NAME OF THE SCRIPT: CreateRastersYear_multiprocessing.py PURPOSE: Create a density map by overlapping a grid and counting the number of lines crossing each cell

191 DURATION: It depends on the ship type. We estimate an average of 5h per ship type. For cargo, the ship type with most signals, it takes about 10 hours. A ship type with less signals as service can take about 2h. PRECONDITIONS: Before creating lines we need: A folder with monthly lines shapefiles divided in ship types The file name of the file must have the year and the month in English A grid shapefile (go or link to page 1) HOW THE SCRIPT WORKS: The process to create a map is divided into six steps, illustrated in the figure below. It uses python s multiprocessing module to run six months simultaneously:
192 OUTPUT: a folder, 04_rasters, with subfolders for each ship type. Under each subfolder there is a raster file in TIFF format for each month. There is also a yearly file (CARGO_2009_Year_Raster.tif) with the sum of all monthly raster files

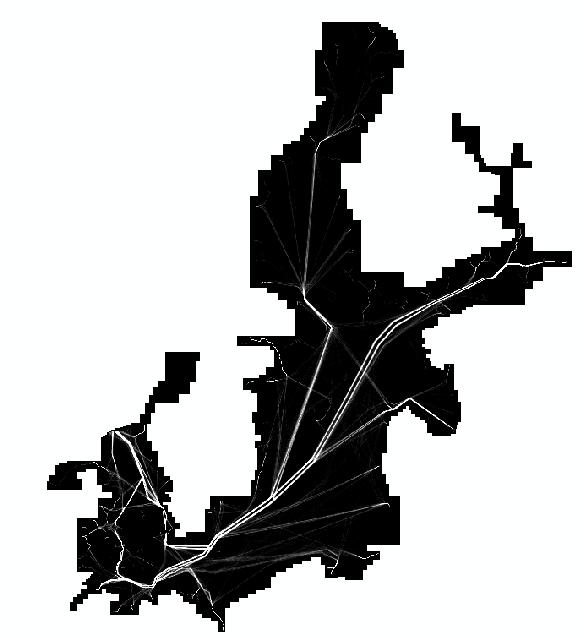
193
194 Annex 2 Mapping fishing activities in the Baltic Sea using AIS data Ronny Fredriksson, Mårten Erlandsson, Ulf Bergström Swedish University of Agricultural Sciences Department of Aquatic Resources INTRODUCTION METHOD AIS and fleet list data extraction Data processing RESULTS AND DISCUSSION Maps of fishing activities AIS and VMS comparison Applications of AIS REFERENCES

195 Introduction The original objective of this study was to produce an overall analysis of the fisheries activities in the Baltic Sea, presented in the form of GIS maps, figures and tables, and a description of the analyses performed. Original plans involved using a VMS dataset (vessel monitoring system used to track fishing vessels above 12 m length) from year 2008 to 2012 for producing these maps. However, during the initial work with the VMS dataset the presence of non-fishing positions in the dataset were discovered. Since the dataset lacked information on vessel speed these steaming positions could not be corrected retrospectively. It was therefore decided that an AIS dataset with data from 2014 would be used instead, and that an evaluation of working with AIS (Automatic Identification System) data as a tool for fishery management should be included in the objectives. The AIS system is an automatic tracking system used on ships and by vessel traffic services for identifying and locating vessels by electronically exchanging data with other nearby ships and AIS base stations. The AIS has been progressively extended in the EU to medium-large size fishing vessels and has become compulsory since May 2014 for all fishing vessels of more than 15 meters of length (EU Dir 2011/15/EU). This makes the AIS system interesting as a tool for mapping of fishing activities. Figure 1 illustrates the jurisdictional zones that affect fisheries in the Baltic Sea. The rules at sea is a subject to international law, notably to the United Nations Convention on the Law of the Sea (UNCLOS). UNCLOS defines the conditions for States to extent sovereignty or jurisdiction over the oceans. In this regard, a coastal state has the possibility to claim different levels of access and rights at sea through declaration of different types of zones (Figure 1). Full sovereignty is exerted over territorial waters, which may be declared up to a maximum of 12 nautical miles (nm) from the coast baseline. Beyond the territorial water limits, a coastal state may also claim for exclusive economic zones (EEZs), to a maximum extent of 200 nm from the coast line. In both such zones, the rights for the exploitation of marine living resources (i.e. fishing) belong exclusively to the coastal state. However, some of the rights, i.e. the fishing, in both of these zones can be permitted to foreign vessels. In the absence of an EEZ claim, a coastal state may also exert sovereign rights over fishing only, by claiming an exclusive fishing zone. 'High seas' correspond to sea areas not subject to any claim by a coastal state. Access to fishing in the high seas is possible to vessels of any country (Weissenberger, 2015). Figure 1. Sea delimitations based on international law (UNCLOS). The main aim of this study was to produce maps that describe the spatial distribution of the different fishing methods, hereafter referred to as fisheries, used within the Baltic Sea and analyse their interaction with other types of maritime activities as well as the likely spatially relevant environmental effects. The secondary aim was to test the usability of AIS as a tool within the fishery management. In Natale et al.
196 (2015) AIS data of Midwater trawl activities were tested and in this study we evaluated their method for different fisheries in the Baltic Sea. Method AIS and fleet list data extraction The positions of the currently known fishing vessels operating in the Baltic Sea during the year 2014 were extracted from the HELCOM AIS data network (9 countries). A list of vessels identified to be fishing vessels was acquired from a ship information provider ( to cover all IMO (International Maritime Organization) vessels. The IMO number is a unique reference for ships and remains linked to the ship for its lifetime, regardless of a change in name, flag, or owner. If the ship information was not available with the provider (i.e. non-imo ships), we used the ship information from the AIS data. This list included MMSI (Maritime Mobile Service Identifier, a unique number identifying ships at radio communication) and IMO numbers, dimensions, name, call sign and type of each vessels. Vessels in this list included a number of EU and non-eu countries. Next, all AIS equipped vessels of Baltic Sea states identified as fishing vessels or unknown were checked against online information providers to identify AIS fishing vessels of Baltic Sea states. Then information on VMS equipped vessels from Baltic Sea EU countries was extracted from the EU fleet register and merged with the AIS list to create an exhaustive list of all relevant Baltic Sea fishing fleet (AIS and VMS merged). Thus a table of all Baltic Sea state fishing vessels was retrieved, including all the details of the AIS list plus the power of the vessels and their primary and secondary gear types (from the logbook, DCF level 4). Where gear types were not available, a visual (from online provider picture) estimation of the gear used (DCF level 3, rough estimate) was appended. In the AIS fishing fleet list, the fields relative to power and gear type were drawn from the Baltic Sea fleet list using the call sign as linkage between the lists. Information on gear type and power was still missing for a number of vessels from EU, non-baltic, member states. This gap was filled using their call signs and the logbook information in the EU fleet register. For non-eu flag vessels (e.g. Russia, UK, Canada, USA etc.) a visual estimation of the gear was performed based on online archives of images (e.g. Some vessels did not have available information on power in the EU fleet register (data gaps) or were from non-eu countries. For these vessels a power was estimated based on their lengths, using parameters from a power regression on the known power/length of 665 vessels (R-sq = 0.65). This operation also allowed to check and correct errors in the reported length of some vessels. The signals of the fishing vessels in the AIS fishing fleet list were extracted from the AIS HELCOM data for the year 2014 (following their MMSI number). Only the signals within the Baltic Sea (cf. Article 1 of the Helsinki Convention) were selected. Data processing The first step of the data handling was to exclude signals with a speed lower than 0.5 knots and thereby excluding signals from ports and other non-fishing positions. After that the time between sequent signals from a specific vessel were calculated as the variable Fishing time. Fishing time above seven minutes were removed based on the assumption that the AIS-system had been turned off prior to the signal, and thus the vessel had not been fishing. The limit was set to seven minutes based on the pattern of the fishing time variable in a histogram (
197 Figure 4). Combined with information of engine power, the fishing time was used to calculate the effort in KWh. Figure 4. A histogram of every time difference between two sequent signals for every vessel. About 2 % of the signals had a difference exceeding seven minutes. The data were then divided into two separate datasets, one with information of primary gear type according to DCF level 4 (a detail level where for instance bottom trawl are separated into PTB - Bottom pair trawl, OTB - Bottom otter trawl, OTT - Multi-rig otter trawl and TBB - Beam trawl) and one dataset without information on primary gear type. The main analysis in this study were done on the dataset with detailed gear type information. The second dataset were mainly used to illustrate how much spatial information that was lacking when using this method. In the dataset with detailed information on the gear type, all signals from gear types that only had one vessel or few signals in total were removed, see Figure 5. The gear types that were removed were DRB (Boat dredge, 1200 signals), GTR (Trammel net, 700 signals)
198 and GND (Driftnet, forbidden method, signals). All the bottom trawling gear types were merged together. Mid-water trawl gear types were merged together in the same way, as well as rods and lines gear types. Gear type in the AIS data Gear type in this report PTB OTB OTT BT - Bottom trawl TBB OTM PTM MT - Mid-water trawl LTL LHP RL - Rods and lines FPO GNS LLD LLS PS SDN FPO - Potting / creeling GNS - Gillnet commercial fishery LLD Pelagic long lining activity LLS Demersal long lining activity PS Pelagic purse seining SDN Demersal Danish seine DRB GTR Removed GND Figure 5. A complete list of gear types of Baltic Sea fishing vessels in 2014 and how they were treated in this report. All the bottom trawling gear types (PTB - Bottom pair trawl, OTB - Bottom otter trawl, OTT - Multi-rig otter trawl and TBB - Beam trawl) were merged together. Mid-water trawl gear types (OTM - Midwater otter trawl and PTM - Pelagic pair trawl) were merged together in the same way, as well as rods and lines gear types (LTL - Trolling lines and LHP - Hand and Pole lines). The AIS-data does not provide any information about when a boat has been fishing or not. To retrieve this information from the data, a histogram for each gear type was made of vessel velocity at each signal, see
199 Figure 6. The histograms generally consist of two Gaussian distributions, one at a lower speed where the boat was likely fishing and one at higher speeds representing steaming. According to Natale et al. (2015) an appropriate formula to calculate the speed limits for trawl fishing is μ ± 1.5 σ, where μ is the mean value and σ is the standard deviation of the first Gaussian distribution. These limits gave a good fit for the midwater trawl fishing but were not possible to use generally on all gear types. The Gaussian distribution of the speed profiles for each gear type was analysed in the statistical software R using the mixtools library and the function NormalmixEM2comp (Benaglia et al, 2009). After a visual check of the speed histograms, the interval knots were defined as fishing for all of the fisheries.
200 Figure 6. Histogram of the vessel's velocity at each signal for each gear type. The red marks shows 1.5 * SD from the mean of the first normal distribution in the R function normalmixemcomp2. To verify the quality of the velocity values in the AIS data, the values were compared with calculated velocity values based on the boat's difference in position and time between two consecutive signals. The methods did not differ significantly and the AIS data of velocity was considered to be useful. Maps of the fishing effort per gear type and in total were produced in ArcGIS v by summarizing all the fishing efforts in 1*1 km squares. The maps were then supplemented with polygons displaying no fishing zones, cod fishing closures and the economic zone of Russia. Results and discussion Maps of fishing activities After applying the speed filter ( knots) and excluding the minor gear types (DRB, GTR and GND) the dataset consisted of 998 vessels and approximately AIS signals. For 236 of the vessels included in the dataset, corresponding to 24% of the fleet, detailed information on gear type was not available. The AIS signals from these vessels made up approximately 10% of the total filtered dataset. The major gear types in the dataset were bottom trawl, midwater trawl and gillnet that together made up 99 percent of the total number of signals. In table 1 the effort for each gear type is presented. In figure 5-13 the resulting maps describing the fisheries are presented. Bottom trawl (figure 5), Midwater trawl (figure 6) and gillnet (figure 7) were the most extensive fisheries in terms of number of signals in the dataset. They were also the fisheries that had the largest spatial distribution, where bottom trawl and midwater trawl occurred throughout the whole study area and gillnet covered the major part of the Baltic Proper and Kattegat. The magnitude of the other fisheries were less extensive.
201 Figure 5. Fishing effort (kwh) for gear type bottom trawl within Baltic Sea Figure 6. Fishing effort (kwh) for gear type midwater trawl within Baltic Sea 2014.

202 Figure 7. Fishing effort (kwh) for gear type gillnet within Baltic Sea Figure 8. Fishing effort (kwh) for gear type potting/creeling within Baltic Sea 2014.
 for gear type pelagic")
 for gear type demersal")
203 Figure 9. Fishing effort (kwh) for gear type pelagic long line within Baltic Sea Figure 10. Fishing effort (kwh) for gear type demersal long line within Baltic Sea 2014.
 for gear type pelagic")
 for gear type demersal")
204 Figure 11. Fishing effort (kwh) for gear type pelagic purse seine within Baltic Sea Figure 12. Fishing effort (kwh) for gear type demersal Danish seine within Baltic Sea 2014.

205 Figure 13. Fishing effort (kwh) for gear type rods and line within Baltic Sea Table 1. Number of vessel, generated number of AIS signals defined as fishing and fishing time per fishery. Fisheries No. Vessels No. Signals Fishing time (h) Bottom trawl Midwater trawl Rods and lines Potting/creeling Gillnet Pelagic long line Demersal long line Pelagic purse seine Demersal Danish seine Tot DCF Level Tot DCF Level Figure 14 illustrates the total fishing effort made by all fisheries included in the analysis, and figure 15 shows the fishing effort made from vessels without detailed information on gear type. Approximately 10 % of the total number of signals defined as fishing lacked detailed (from the logbook, DCF level 4) information of gear type. The general picture is that the extra data follow the same spatial pattern as the rest of the data, suggesting that the loss of these vessels from the detailed dataset did not distort the fishing patterns observed. Almost no fishing were detected within the Russian EEZ areas despite the fact that 31 Russian fishing vessels were included in the analysis.
. In their study, only Midwater trawl data were used.")
.")
206 Figure 14. Total fishing effort. Figure 15. Fishing effort from vessels without detailed information on gear type. The main parts of the method used in this report was first developed and tested by Natale et al (2015). In their study, only Midwater trawl data were used. Here we show that their algorithm for separating fishing activity from steaming worked well also on midwater trawl data from the Baltic. However, the speed interval determined by the algorithm for other fisheries did not match the data as well as for the Midwater trawl (figure 4). Therefore, after a visual check of the speed histograms, the interval knots were defined as fishing for all different fishing methods studied. This interval worked fairly well, but there were still some evidence of steaming vessels and signals close to ports left in the dataset (figure 16). This could most likely be improved by setting the upper and lower speed limit for each gear type separately. For passive fisheries we might lose signals when applying the lower speed limit to the filter since vessels often standing still when hauling.

207 Figure 16. Illustration of the fact that some non-fishing signals near harbours remains in the dataset despite the speed filter, illustrated by Midwater trawl fishery in the Bothnian Sea. AIS and VMS comparison Both VMS and AIS has its advantages and disadvantages. VMS offers a satellite based communication system that offers bi-directional guaranteed communications where every signal is transmitted and received, but at a cost. The costs per signal are shared between the user or fisherman and the authorities wishing to monitor them. AIS is primarily intended as a situational awareness tool and as means to exchange pertinent navigation information in near real-time and is used by ships and by vessel traffic services for identifying and locating vessels by electronically exchanging data with other nearby ships, AIS base stations and satellites without a cost per message. Therefore, AIS is a more economical solution but since it is an open system there is no guarantee of message reception. An advantage of AIS compared to VMS is the spatial resolution. The VMS system sends out a signal every one to two hours, while the AIS messages transmission rates range from 2 seconds to 3 minutes depending on speed or rate of turn. The high spatial resolution makes AIS an interesting tool for fishery management and science, for instance when comparing fishing with other activities or protected areas at sea. However, one aspect to consider is that there are areas with low AIS signal coverage. This is something to keep in mind if using AIS as a management tool as it can be difficult to determine if the absence of activity in an area is a true absence or a result of weak AIS signal strength. In this analysis there were no indications of week signals affecting the results. By using AIS instead of VMS data we get spatial information on non EUfishing vessels. However, the down side is that we lose some detailed information on gear type for EUvessels. Another important aspect to consider when comparing AIS with VMS is that AIS is compulsory for fishing vessels of more than 15 meters while the corresponding length for VMS is 12 meters. Thus, we lose some information on smaller vessels when working with AIS data compared to VMS. A common problem for both system is that they do not cover vessels smaller than 12 meters and thus we lack information on a significant part of the fishery based near the coast. Applications of AIS Figure 17 illustrates an example of an overlay analysis between total fishing effort and protected Natura 2000 areas in the Baltic Sea. We only show an illustrating example since many of the protected areas are small and therefore it is difficult to illustrate the whole study area in one map. The analysis showed that during 2014 fishing had occurred in 179 of 1053 areas. Figure 17 indicate that fishing can be quite extensive within Natura 2000 areas. In figure 17 the total fishing effort were used, but this analysis can be made


208 separately for each fishery. This makes it possible to make fishery specific analysis, e.g. bottom trawl versus habitat destruction and by catch estimations made by gillnet and so on. Figure 17. An example from the southern Baltic sea illustrating the overlap between fisheries and protected Natura 2000 areas. Figure 18 illustrates the overlap between shipping routes and fishing areas, to identify areas with a potential conflict of interests. Both shipping routes and important fishing areas are here defined as the 20 percent of the raster cells with the highest values in the study area. An area with both heavy traffic and a lot of fishing activity is for example the area west of Gothenburg, on the border area between Skagerrak and Kattegat. Also, northwest and north of Bornholm there are two smaller areas with a lot of fishing that overlap areas with high traffic frequency areas. Also, in the inlet to the Gulf of Finland and in the southern parts of the Bothnian Sea there are areas where shipping routes overlap with important fishing areas. Figure 18. The areas with highest fishing effort in relation to areas with the highest frequency of traffic, based on the number of vessels passing per month. The traffic data is from 2011 representing all shipping traffic that particular year.
EUROPEAN ENERGY FORUM 2013
 EUROPEAN ENERGY FORUM 2013 28 th May 2013 1 Wärtsilä Our business areas POWER PLANTS SHIP POWER SERVICES 2 Wärtsilä This is what we bring to the market EFFICIENCY ENVIRONMENTAL SOLUTIONS FUEL FLEXIBILITY
Prospects for LNG in the South Baltic Sea Region
 Scientific Journals Maritime University of Szczecin Zeszyty Naukowe Akademia Morska w Szczecinie 2013, 36(108) z. 1 pp. 59 63 2013, 36(108) z. 1 s. 59 63 ISSN 1733-8670 Prospects for LNG in the South Baltic
European Shortsea Network
 European Shortsea Network ESN Report SECA 2015 preparedness Riitta Pöntynen, SPC Finland 18 December 2013 Joint SSS and MoS Focal Points meeting SECA report contents Facts on the European SECA SECA traffic,
A clean environment. Towards zero-emission shipping BUSINESS WHITE PAPER KEY BENEFITS CONTENTS
 A clean environment Towards zero-emission shipping BUSINESS WHITE PAPER CONTENTS KEY BENEFITS I. Introduction... 2 II. Striving for sustainable performance and ensuring compliance... 2 III. Cutting costs
Potential for LNG Bunkering
 Potential for LNG Bunkering Presented by Valery Nemov, Gazprom Export Courtesy of Pace Global Energy Services Porto, September 13 th, 2011 ZMB 1 Agenda Context and Market Overview Key Drivers and Major
Sustainable Shipping -operating towards 2020 and beyond
 Click to edit Master title style Sustainable Shipping -operating towards 2020 and beyond Asia Pacific Petroleum Conference (APPEC 2018) Singapore, 26 Sep 2018 Elfian Harun, Environment Manager AGENDA 1.
North European LNG Infrastructure Project: Draft Feasibility Report Appendix A Ship Cost Analysis. Date:
 A North European LNG Infrastructure Project: A feasibility study for an LNG filling station infrastructure and test of recommendations. Date: 2011-11-21 Draft Feasibility Report Appendix A Ship Cost Analysis
Emission change potential of Finnish sea traffic in the Baltic Sea in transferring to use LNG
 Emission change potential of Finnish sea traffic in the Baltic Sea in transferring to use LNG Kaisa Manninen a)*, Sirkka Koskela a), Mari Tuomaala b) Sari Siitonen b) Tommy Mattila b) a) Finnish Environment
LNG fuel distribution strategy for the BSR v5
 LNG fuel distribution strategy for the BSR v5 Introduction The land-based and the maritime LNG market will be closely connected in the future. With stricter emission restrictions, more ships will be built
New Sulphur requirements, Best Practice and the Way Ahead
 New Sulphur requirements, Best Practice and the Way Ahead Motorways of the Sea Conference Markku Mylly Executive Director Gothenburg/ 9-10 November 2015 Content EMSA short introduction of the Agency Sulphur
WÄRTSILÄ CORPORATION
 Stakeholder expectation WÄRTSILÄ CORPORATION ENTSOG 4th Workshop on the European Ten Year Network Development plan September 29, 2011 Juhani Hupli, Vice President, Ship Power Technology Wärtsilä Corporation
Baltic Marine Environment Protection Commission
 Baltic Marine Environment Protection Commission Maritime Working Group Tallinn, Estonia, 6-8 September 2016 MARITIME 16-2016 Document title Results of questionnaire to revise HELCOM Recommendation 28/3
Module 1: LNG Fuelled Vessels Design Training
 Module 1: LNG Fuelled Vessels Design Training Compliance Strategies of Owners with the Regulations Dr Evangelos Boulougouris (University of Strathclyde) Minimise Cost Maximize Revenue Maximum Profit Owner
What should be done to heal the Baltic Sea?
 What should be done to heal the Baltic Sea? Mr. Mikhail Durkin, HELCOM Professional Secretary Towards a cleaner and healthier Baltic Sea Public hearing of the Committee on the Environment, Public Health
Challenges of Gas Engine Introduction
 Challenges of Gas Engine Introduction Dr. Christian Poensgen Engineering Director < 1 > LNG for Propulsion Benefits & Challenges Benefits: No additional measures to reach NO x and SO x -limits Will meet
VIKING LINE S ENVIRONMENTAL STRATEGY & ENERGY EFFICIENCY. Innovative and Environmentally Friendly Operation with Viking Line Ferries
 VIKING LINE S ENVIRONMENTAL STRATEGY & ENERGY EFFICIENCY Innovative and Environmentally Friendly Operation with Viking Line Ferries Maritime Stakeholder Event Brussels, Belgium June 1, 2011 Kari Pihlajaniemi
HELSINKI COMMISSION HELCOM MARITIME 13/2013 Maritime Group 13 th Meeting Szczecin, Poland, November 2013
 HELSINKI COMMISSION 13/2013 Maritime Group 13 th Meeting Szczecin, Poland, 26-28 November 2013 Agenda Item 13 Future work and meetings Document code: 13/1 Date: 18.10.2013 Submitted by: Secretariat WORKING
Conventional vs. LNG Fuelled RoPax - Case Study -
 Conventional vs. LNG Fuelled RoPax - Case Study - 42nd ANNUAL INTERFERRY CONFERENCE 7th 11th October 2017 Split, Croatia Sokrates Tolgos < 1 > Agenda 1 Emission Compliance and Fuel Concepts Basic Considerations
November 2018 Development Paper. MariEMS Learning Material. 27. Energy Efficiency Operational Indicator (EEOI) 27.1 Introduction
 27.1 Introduction") November 2018 MariEMS Learning Material This is the 27th compilation by Professor Dr Reza Ziarati on the work of the EU funded Erasmus + MariEMS partners and material extracted from the IMO TTT Course.
November 2018 MariEMS Learning Material This is the 27th compilation by Professor Dr Reza Ziarati on the work of the EU funded Erasmus + MariEMS partners and material extracted from the IMO TTT Course.
Estimation of atmospheric nitrogen deposition to the Baltic Sea in the periods and
 Estimation of atmospheric nitrogen deposition to the Baltic Sea in the periods 1997-23 and 2-26 Summary Report for HELCOM Jerzy Bartnicki and Semeena Valiyaveetil Meteorological Synthesizing Centre-West
LNG infrastructure in the Baltic Ports
 LNG infrastructure in the Baltic Ports Bogdan Ołdakowski, Secretary General, Baltic Ports Organization International LNG Congress 14-15 March 2016, London Plan of the presentation Introduction to BPO LNG
Module 5: Ship-Port Interface and Energy Efficiency. IMO Train the Trainer Course. Energy Efficient Ship Operation
 Module 5: Ship-Port Interface and Energy Efficiency IMO Train the Trainer Course Name of the Presenter Affiliation of the presenter, City, Country Energy Efficient Ship Operation Venue, City, Country Day
Gintautas Kutka Executive director Lithuanian Shipowners Association. LNG seminar 16 June, 2011
 Gintautas Kutka Executive director Lithuanian Shipowners Association LNG seminar 16 June, 2011 CLIMATE CHANGE (CO2) Shipping maintransporter of global trade (90%) counts FOR 2 to 4% of global CO 2. Ongoing
GREEN INFRAPORT PROJECT
 PRF-Workshop, Kiel, Germany 1 July 2016 GREEN INFRAPORT PROJECT Emil Arolski, Project Manager Baltic Ports Organization Baltic Ports Organization The BPO's mission is to contribute to sustainable development
SUSTAINABLE SHIPPING AND PORT TRENDS. Habil. Dr., Captain, Prof. Vytautas Paulauskas Klaipeda Shipping Research Centre
 SUSTAINABLE SHIPPING AND PORT TRENDS Habil. Dr., Captain, Prof. Vytautas Paulauskas Klaipeda Shipping Research Centre SUSTAINABLE SHIPPING AND PORT DEVELOPMENT WHOT IT IS? The aim of this presentation
GUIDANCE ON LNG BoG MONITORING
 23 rd May 2017 GUIDANCE ON LNG BoG MONITORING 1 PURPOSE This paper provides guidance to the verifier and the company for the on-onboard monitoring of boil off gas (BoG) and recording of data for the purpose
BOSKALIS ON BIO CREATING NEW HORIZONS
 34 BOSKALIS ON BIO CREATING NEW HORIZONS Reducing emissions is very much on the agenda at Boskalis: with a large global fleet, the company is constantly looking to cut carbon emissions. Biofuels offer
LNG as a marine fuel meeting environmental standards. Klaipeda, Preben Hagelskjær Lauridsen
 LNG as a marine fuel meeting environmental standards Klaipeda, 15.11.2017 Preben Hagelskjær Lauridsen Agenda Who are we? Energy awareness! MARPOL Annex VI Energy Awareness on ships LNG International rules
Baltic Marine Environment Protection Commission
 Baltic Marine Environment Protection Commission Expert Working Group for Mutual Exchange and Deliveries of AIS & Data Stockholm, Sweden, 7-8 June 2017 AIS EWG 28-2017 Document title Draft methodology to
La tutela ambientale sui mari internazionali (Environmental Regulations of the Shipping Industry)
") RUOLO DELLA MARINA MILITARE PER L IMPIEGO DEL GAS NATURALE NELLA PROPULSIONE NAVALE Roma, 21 / 11/ 2013 La tutela ambientale sui mari internazionali (Environmental Regulations of the Shipping Industry)
RUOLO DELLA MARINA MILITARE PER L IMPIEGO DEL GAS NATURALE NELLA PROPULSIONE NAVALE Roma, 21 / 11/ 2013 La tutela ambientale sui mari internazionali (Environmental Regulations of the Shipping Industry)
ADVANCING LNG FOR CLEANER MARINE
 WE SEA A BETTER PATH ADVANCING LNG FOR CLEANER MARINE Gas4Sea is setting a new direction in the maritime sector by advancing liquefied natural gas (LNG) as a marine fuel via ship-to-ship transfer. Under
Shipping steers a clear course on emissions
 Delivering Excellence Through Innovation & Technology Shipping steers a clear course on How Pollutants and greenhouse gas from shipping form a significant part of the overall air quality picture ee.ricardo.com
MINIMUM REQUIREMENTS FOR VESSELS BOUND FOR OR LEAVING PORTS OF THE BALTIC SEA STATES AND CARRYING DANGEROUS OR POLLUTING GOODS
 CONVENTION ON THE PROTECTION OF THE MARINE ENVIRONMENT OF THE BALTIC SEA AREA HELSINKI COMMISSION - Baltic Marine HELCOM 19/98 Environment Protection Commission 15/1 Annex 7 19th Meeting Helsinki, 23-27
Promoting sustainable mobility: natural gas and biomethane as a fuel for transport
 Promoting sustainable mobility: natural gas and biomethane as a fuel for transport European Federation of Agencies and Regions for Energy and the Environment Address: rue de Stassart 131, 1050 Brussels
Challenges for the maritime industry: environmental requirements... Ralf Plump, PTP lead Environmental Protection, Safety & Environmental Research
 Challenges for the maritime industry: environmental requirements... Ralf Plump, PTP lead Environmental Protection, Safety & Environmental Research Content Challenges for maritime industry - upcoming environmental
Green Marine. Environmental Program. Performance Indicators for Ship owners
 Green Marine 2015 Environmental Program Performance Indicators for Ship owners Table of contents 1. AQUATIC INVASIVE SPECIES... 3 1.A - DOMESTIC SHIP OWNERS... 3 1.B - INTERNATIONAL SHIP OWNERS... 4 2.
LNG Bunkering LNG in Baltic and Black Sea Ports"-
 30th May 2013 - Varna ESPO 2013 Conference LNG Bunkering LNG in Baltic and Black Sea Ports"- Emil Arolski Project Manager- LNG in Baltic Sea Ports Plan of the presentation: LNG in Black Sea Ports- transfer
Table of contents. 1. Global Environments 2. Green Ship Technologies in Korea
 1 Table of contents 1. Global Environments 2. Green Ship Technologies in Korea 2 1. Global Environments 3 IMO Regulations International Maritime Organization Energy Efficiency, NOx, SOx, PM/BC, VOCs, Fuel
MARITIME MRV HOW TO PREPARE FOR CARBON EMISSIONS REPORTING NOVEMBER 2016
 MARITIME MRV HOW TO PREPARE FOR CARBON EMISSIONS REPORTING NOVEMBER 2016 AGENDA Policy background Scope and timeline The monitoring plan Templates and reporting The verification process Q&A 2 POLICY BACKGROUND
Port of Gothenburg driving towards a more sustainable infrastructure
 Port of Gothenburg driving towards a more sustainable infrastructure Sara Sköld Port of Gothenburg Sustainability sara.skold@portgot.se www.portgot.se Introduction Environmentally differentiated port due
SHIP ENERGY EFFICIENCY MANAGEMENT PLAN SEEMP. Edilberto Peralta Lloyd s Register Operations Manager Central and South America
 SHIP ENERGY EFFICIENCY MANAGEMENT PLAN SEEMP Edilberto Peralta Lloyd s Register Operations Manager Central and South America "If you can't measure it, you can't improve it. Peter Drucker SEEMP An energy
NEWSLETTER A new era of. green shipping. The introduction of liquid natural gas (LNG) as ship s fuel.
 as ship s fuel.") NEWSLETTER 01-2008 green shipping A new era of The introduction of liquid natural gas (LNG) as ship s fuel http://www.eu-magalog.eu The Project MAGALOG - Marine Fuel Gas Logistics Welcome to the no.1 issue
NEWSLETTER 01-2008 green shipping A new era of The introduction of liquid natural gas (LNG) as ship s fuel http://www.eu-magalog.eu The Project MAGALOG - Marine Fuel Gas Logistics Welcome to the no.1 issue
International Convention for the Prevention of Pollution from Ships (MARPOL)
") MARPOL 1973, as amended Adoption: 1973 (Convention), 1978 (1978 Protocol), 1997 (Protocol - Annex VI); Entry into force: 2 October 1983 (Annexes I & II) International Convention for the Prevention of Pollution
MARPOL 1973, as amended Adoption: 1973 (Convention), 1978 (1978 Protocol), 1997 (Protocol - Annex VI); Entry into force: 2 October 1983 (Annexes I & II) International Convention for the Prevention of Pollution
Oil transportation in the Baltic Sea and MIMIC project
 Oil transportation in the Baltic Sea and MIMIC project 14 th International Conference Maritime Transport and Infrastructure 2012 Olli-Pekka Brunila UTU/ CMS Riga, Latvia 26 April 2012 www.merikotka.fi/mimic
MAGALOG. Maritime Fuel Gas Logistics. Best Practices Report
 Grant agreement no. EIE/06/016/SI2.448420 MAGALOG Maritime Fuel Gas Logistics Intelligent Energy Europe (IEE) ALTENER Key action: VKA 8 Best Practices Report Period covered: from 01.07.2007 to 31.12.2008
ANNEXES. to the Commission Implementing Regulation
 Ref. Ares(2016)3985800-28/07/2016 EUROPEAN COMMISSION Brussels, XXX [ ](2016) XXX draft ANNEXES 1 to 3 ANNEXES to the Commission Implementing Regulation on templates for monitoring plans, emissions reports
Delft, 6 th December KIVI- NGVA Europe
 1 NGVA Europe at a glance Advocacy: Natural and renewable gas as Transportation Fuel The European stakeholder that promotes the use of natural and renewable gas as a transportation fuel mainly in vehicles
Carbon footprint report 2013
 Carbon footprint report 2013 For DEME activities in Belgium and the Netherlands; in accordance with the CO2 Performance ladder in Ton CO2 Rev. 2014-04-02 Uncontrolled if printed. Most recent version is
GREEN INFRAPORT PROJECT
 BPO Conference, Helsinki, Finland 8 September 2016 Scandic Marina Congress Center, Katajanokanlaituri 6 GREEN INFRAPORT PROJECT Emil Arolski, Project Manager Baltic Ports Organization GREEN INFRAPORT PROJECT
Erik Thun Our path towards climate smarter shipping Nautiska Föreningen, 27 November 2018
 Erik Thun Our path towards climate smarter shipping Nautiska Föreningen, 27 November 2018 Joakim Lund CCO, Thun Tankers Thun Tankers part of Erik Thun AB Our scope has always been tailor making sustainable
Baltic Marine Environment Protection Commission
 Baltic Marine Environment Protection Commission Helsinki Commission Helsinki, Finland, 28 February 1 March 20 HELCOM 38-20 Document title Draft Work Plan - HELCOM Maritime sub-group on green ship technology
The MAGALOG Project LNG-fueled shipping in the Baltic Sea
 The MAGALOG Project LNG-fueled shipping in the Baltic Sea The project is supported by: 1 MAGALOG WP4.2 Economical and Environmental effect of LNG fuelled ships 2 Objectives and background The study looks
Development of Efficient, Environmentally Friendly and Flexible Shipboard Regasification Vessel
 13 Development of Efficient, Environmentally Friendly and Flexible Shipboard Regasification Vessel KENJI TSUMURA *1 MASARU OKA *1 TOSHIO OGATA *2 MAKOTO TABIRA *2 Mitsubishi Heavy Industries, Ltd., (MHI)
Alternative fuels LNG a short or a medium term solution?
 Alternative fuels LNG a short or a medium term solution? Ketil Djønne Vice President, External Relations The Age of LNG FUEL is hereis here History of modern LNG carriers goes back to 1969 40+ years. Today:
Ship Powering Options for the Future. An Outline Synopsis of the Study
 Ship Powering Options for the Future An Outline Synopsis of the Study Maritime Studies at City University London Propeller Vibration Marine Supply Chain Dynamics Institute of Cavitation Research Container
Non-fuel Methods of IMO Compliance. Prepared for Platts Bunker and Residual Fuel Oil Conference 8th Annual, Houston 22 June 2011
 Non-fuel Methods of IMO Compliance Prepared for Platts Bunker and Residual Fuel Oil Conference 8th Annual, Houston 22 June 2011 Agenda Introduction Alternative Fuels and Approaches Primary Paths Scrubber
LNG as a ship fuel- developing competence to utilize business opportunities GO LNG Conference Vilnius,
 LNG as a ship fuel- developing competence to utilize business opportunities GO LNG Conference Vilnius, 2017-04-27 Dr Gerd Würsig, Business Director Alternative Fuels 1 27 April 2017 SAFER, SMARTER, GREENER
COMMISSION STAFF WORKING DOCUMENT. Actions towards a comprehensive EU framework on LNG for shipping. Accompanying the document
 EUROPEAN COMMISSION Brussels, 24.1.2013 SWD(2013) 4 final COMMISSION STAFF WORKING DOCUMENT Actions towards a comprehensive EU framework on LNG for shipping Accompanying the document Communication de la
Need update. Maritime Forecast to 2050 SAFER, SMARTER, GREENER DNV GL 2018
 Need update Maritime Forecast to 2050 1 SAFER, SMARTER, GREENER The Maritime forecast to 2050 provides projections for Maritime forecast to 2050 provides projections for key drivers Regulation Technology
CLEANSHIP. Move Forward with Confidence
 CLEANSHIP Move Forward with Confidence Why choose Bureau Veritas for CLEANSHIP Courtesy of Compagnie du Ponant Bureau Veritas Mission & Policy Since 1828, BV s mission has been to safeguard both wider
SUSTAINABLE SHIPPING AND PORT TRENDS
 SUSTAINABLE SHIPPING AND PORT TRENDS Habil. Dr., Captain, Prof. Vytautas Paulauskas Klaipeda Shipping Research Centre SUSTAINABLE SHIPPING AND PORT DEVELOPMENT WHOT IT IS? The aim of this presentation
Logistics in Finland megatrends and game changers
 Logistics in Finland megatrends and game changers 23.10.2014 Markku Henttinen, CEO, The Finnish Association of Purchasing and Logistics (LOGY) Content What s LOGY? Logistics costs in Finland Industrial
Appendix C: Baltic Sea Environment Fact Sheets
 Appendix C: Baltic Sea Environment Fact Sheets Here we present the Baltic Sea Environment Fact Sheets which later on will be available on HELCOM web pages: Nitrogen emissions Nitrogen depositions Heavy
MicroMist Marine Scrubbers
 MicroMist Marine Scrubbers Advanced Ship Scrubber Technology Improving your bottom line EnviroCare International EnviroCare international, with headquarters in California, designs and manufactures pollution
CLEAN BALTIC SEA SHIPPING PROJECT - MARITIME TRENDS AND PERSPECTIVES
 CLEAN BALTIC SEA SHIPPING PROJECT - MARITIME TRENDS AND PERSPECTIVES Urszula Kowalczyk, Jakub Piotrowicz Maritime Institute in Gdańsk Midterm Conference - CLEANSHIP, Riga 19-20 Sept 2012 Development of
Development Facts & Options
 UnSustainable Shipping & Port Development Facts & Options 5th Regional EST Forum in Asia Bangkok, Thailand 23 25 August 2010 Uwe Breitling ASEAN German Technical Cooperation Sustainable Port Development
Vision of the Future Ship
 Vision of the Future Ship Oskar Levander, VP Innovation, E&T, Marine Green Technology and Alternative Fuels Viking Grace, 16.1.2014 2013 Rolls-Royce plc The information in this document is the property
Marine Protection Rules Part 100 Port Reception Facilities Oil, Noxious Liquid Substances and Garbage
 Marine Protection Rules Part 100 Port Reception Facilities Oil, Noxious Liquid Substances and Garbage MNZ Consolidation Marine Protection Rules ISBN 978-0-947527-29-7 Published by Maritime New Zealand,
Handling and Transportation of LNG
 Handling and Transportation of LNG History and Examples of LNG use Whereas Liquid Petroleum Gas (LPG) is carried under pressure, Liquid Natural Gas (LNG) is carried at atmospheric pressure and has been
An Outlook for the Maritime Industry Towards 2020
 An Outlook for the Maritime Industry Towards 2020 Future Development in Maritime Shipping Kenneth Vareide 2013-02-28 Topics Background and Key Drivers for the Maritime Industry A Outlook Towards 2020 Current
Need update. Maritime Forecast to 2050 SAFER, SMARTER, GREENER DNV GL 2018
 Need update Maritime Forecast to 2050 1 SAFER, SMARTER, GREENER FORECAST TO 2050 - SUITE OF PUBLICATIONS 2 The Maritime forecast to 2050 provides projections for Maritime forecast to 2050 provides outlooks
Approach to Environmental Solutions in the Marine Engineering Business
 49 Approach to Environmental Solutions in the Marine Engineering Business HIROTOMO OTSUKA *1 YUSUKE WATANABE *2 HIDEAKI KANEKO *3 KAZUKI SAIKI *3 SHO KOYANAGI *3 MASAYUKI KATO *3 Ships can transport large
Reference Applicability
 Oil tanker Chemical tanker Gas carrier Bulk Carrier container vessel General Cargo vessel Certificate or document Reference Applicability International Tonnage Certificate (1969) Tonnage Convention, article
CLEAN AIR FOR EUROPE - THE BASELINE ASSESSMENT
 CLEAN AIR FOR EUROPE - THE BASELINE ASSESSMENT Clean air is essential for a good quality of life and it enhances the social well being of European citizens. Scientific assessments reveal a range of harmful
Conclusions on the Clean Air Dialogue with Ireland
 13 th March 2017 Ireland has made significant progress in reducing air pollution and improving air quality, to the benefit of public health and welfare, the environment and its ecosystems, as well as reducing
LNG bunkering Why, How and When. Nigel Draffin Technical Manager LQM Petroleum Services Inc.
 LNG bunkering Why, How and When Nigel Draffin Technical Manager LQM Petroleum Services Inc. SOx, NOx,CO 2 and PM Environmental protection legislation is targeting atmospheric pollution. Sulphur oxides
EU Legislation relevant to recreational boating
 EU Legislation relevant to recreational boating Introduction The following seven sections list EU legislation that may directly or indirectly impact on recreational boating. Each section deals with a particular
w w w. c o n t a i n e r s h i p s g r o u p. c o m CONTAINERSHIPS Alternative (Bio) Fuel
 Fuel") w w w. c o n t a i n e r s h i p s g r o u p. c o m CONTAINERSHIPS Alternative (Bio) Fuel 08-06-2018 COMPANY UPDATE Finnish Family Owned w w w. c o n t a i n e r s h i p s g r o u p. c o m Current vessel
w w w. c o n t a i n e r s h i p s g r o u p. c o m CONTAINERSHIPS Alternative (Bio) Fuel 08-06-2018 COMPANY UPDATE Finnish Family Owned w w w. c o n t a i n e r s h i p s g r o u p. c o m Current vessel
Zero Emission, green shipping or energy efficiency? Research in Maritime Environmental Science at Chalmers
 Zero Emission, green shipping or energy efficiency? Research in Maritime Environmental Science at Chalmers Karin Andersson Mechanics and Maritime Sciences, Chalmers University of Technology 1829 Chalmersska
MEGASTAR BUNKERING EXPERIENCES. Sergei Jefimov Klaipeda
 MEGASTAR BUNKERING EXPERIENCES Sergei Jefimov Klaipeda 15.11.2017 CONTENTS 1. Eesti Gaas in brief 2. Why LNG? 3. Bunkering of Megastar 4. LNG supply chain 5. LNG quality 6. Conclusion EESTI GAAS IN BRIEF
Why LNG? LNG is mainly produced for transportation purposes. More economical to transport gas as LNG compared to pipelines over long distances
 Classification: Internal Status: Draft LNG Shipping TEP 10 Gas Processing and LNG - 2008 Trygve G. Egge 2 Topics Why LNG? Historic overview Commercial fundamentals Technical aspects Operational aspects
Prepcom 1 Conservation and sustainable use of marine biological diversity of ABNJ. Policy brief IMO
 Prepcom 1 Conservation and sustainable use of marine biological diversity of ABNJ Policy brief IMO Overview 1 As a specialized agency of the United Nations, the International Maritime Organization (IMO)
LNG BUNKERING. Advancements & Challenges. HHP Summit Jay Gottlieb Houston, TX USA. President Sept 2012 Argent Marine Companies
 LNG BUNKERING Advancements & Challenges HHP Summit 2012 Jay Gottlieb Houston, TX USA President 26-28 Sept 2012 Presentation Topics Maersk-Argent Background LNG as Marine Transport Fuel LNG Bunkering Options
NORWAY: A Look at Recent LNG Marine Fuel Developments. Dr. Michael Parsons with support from Randolph Helland and Carol Wolosz
 NORWAY: A Look at Recent LNG Marine Fuel Developments Dr. Michael Parsons with support from Randolph Helland and Carol Wolosz On August 12-18, 2012, a team of five representatives from the Great Lakes
NAMEPA s Mission protect maritime commitment marine industry Save our Seas Educate
 MARINE POLLUTION NAMEPA s Mission Preserve and protect the marine environment Demonstrate maritime commitment to environmental protection and pollution prevention Support the marine industry Engage maritime
FURTHER DEVELOPMENT OF THE STRUCTURE AND IDENTIFICATION OF CORE ELEMENTS OF THE DRAFT INITIAL IMO STRATEGY ON REDUCTION OF GHG EMISSIONS FROM SHIPS
 E INTERSESSIONAL MEETING OF THE WORKING GROUP ON REDUCTION OF GHG EMISSIONS FROM SHIPS 2nd session Agenda item 2 ISWG-GHG 2/2/14 22 September 2017 ENGLISH ONLY FURTHER DEVELOPMENT OF THE STRUCTURE AND
MARITIME ENVIRONMENT PROTECTION SYSTEMS KTMS. Kloska Technical Marine Sales GmbH
 MARITIME ENVIRONMENT PROTECTION SYSTEMS KTMS Kloska Technical Marine Sales GmbH BILGE WATER GREY/BLACK WATER RECYCLING FOOD WASTE BURNABLE WASTE BALLAST WATER Oily Water Separator Sewage Plants Crusher
LIST OF CERTIFICATES AND DOCUMENTS REQUIRED TO BE CARRIED ON BOARD CARGO SHIPS EXCEPT HIGH SPEED CRAFT
 Certificate or document Reference Applicability Oil tanker Chemical tanker Gas carrier Bulk Carrier container vessel General Cargo vessel International Tonnage Certificate (1969) Tonnage Convention, article
Working Paper as a basis for reviewing and accordingly implementing the measures of the operational plans
 Annex 7: MCD 2014 PSSA Wadden Sea Operational Plans page 1 Annex 7 Working Paper as a basis for reviewing and accordingly implementing the measures of the operational plans PSSA WADDEN SEA OPERATIONAL
ANNEX 25. RESOLUTION MEPC.220(63) Adopted on 2 March GUIDELINES FOR THE DEVELOPMENT OF GARBAGE MANAGEMENT PLANS
 Adopted on 2 March GUIDELINES FOR THE DEVELOPMENT OF GARBAGE MANAGEMENT PLANS") Annex 25, page 1 ANNEX 25 RESOLUTION MEPC.220(63) Adopted on 2 March 2012 2012 GUIDELINES FOR THE DEVELOPMENT OF GARBAGE MANAGEMENT PLANS THE MARINE ENVIRONMENT PROTECTION COMMITTEE, RECALLING Article
Annex 25, page 1 ANNEX 25 RESOLUTION MEPC.220(63) Adopted on 2 March 2012 2012 GUIDELINES FOR THE DEVELOPMENT OF GARBAGE MANAGEMENT PLANS THE MARINE ENVIRONMENT PROTECTION COMMITTEE, RECALLING Article
Maritime Emissions & Impact on Air Quality
 Maritime Emissions & Impact on Air Quality Air PACA Claicity & ClimAERA Alcotra projects, Genova Smart week, 22 Nov. 2017 Photo Photo Photo éventuelle éventuelle éventuelle Air & Ports : context PORTS
The general design of a LNG-terminal. Background
 The general design of a LNG-terminal Project MAGALOG (Marin Gas Logistics) is a contribution to addressing port emission problems in Europe, with a special focus on the Baltic Sea, through the establishment
Petroleum operations and the environment
 Petroleum operations and the environment Emissions to the air Discharges to the sea Relevant international environmental agreements National measures Diffusive emissions Gas turbine exhaust Gas flaring
LNG as fuel for shipping Norsk gassforum Brussels, 15 September 2016
 LNG as fuel for shipping Norsk gassforum Brussels, Maarten Bekaert Head of Section DNVGL Oil & Gas Belgium 1 DNV GL - Industry consolidation 2 Agenda 1. Current status LNG as fuel for shipping 2. Results
Small Scale LNG From Concept to Reality. Chris Johnson, General Manager, LNG New Markets, Shell
 Small Scale LNG From Concept to Reality Chris Johnson, General Manager, LNG New Markets, Shell 0 Table of Contents Table of Contents... 1 Background... 1 Aims... 4 Methods... 5 Results... 11 Conclusions...
HELCOM ENVIRONMENT FOCAL POINT INFORMATION
 HELCOM ENVIRONMENT FOCAL POINT INFORMATION Estimation of atmospheric nitrogen deposition to the Baltic Sea in 2010 based on agreed emission ceilings under the EU NEC Directive and the Gothenburg Protocol:
Developing the Go LNG Blue Corridor Strategy. Josefin Madjidian/Dimitrios Dalaklis Research Associate/Associate Professor
 Developing the Go LNG Blue Corridor Strategy Josefin Madjidian/Dimitrios Dalaklis Research Associate/Associate Professor Outline Background to the Go LNG project and strategy Summary: why LNG for the Baltic
PROCEEDINGS. Air Quality Management at Urban, Regional and Global Scales 4 th International Symposium & IUAPPA Regional Conference
 PROCEEDINGS Air Quality Management at Urban, Regional and Global Scales 4 th International Symposium & IUAPPA Regional Conference 10 13 September 2012 Istanbul Technical University, Istanbul Turkey organized
Green ports policies, coastal shipping and inland waterways November, 2013 Incheon
 Green ports policies, coastal shipping and inland waterways November, 2013 Incheon I. Background / 3 II. Green ports / 6 III. Coastal shipping / 8 IV. Inland waterways / 8 V. Conclusion / 8 1. Background
Sustainability Report 2017
 Sustainability Report 2017 Introduction This report presents the updated results for the year 2017 of the European ports environmental performance. Selected benchmark performance elements are introduced