Data, tables, statistics and maps ENERGY IN DENMARK
|
|
|
- Ashley Bennett
- 6 years ago
- Views:
Transcription

1 Data, tables, statistics and maps ENERGY IN DENMARK 215
2 1 1 GENERAL INFORMATION ON DENMARK Energy in Denmark, 215 Contents General information on Denmark 3 Energy production 4 Imports and exports of energy 8 Electricity and heat 9 Danish energy flows Renewable energy 14 Energy consumption 16 Emissions 19 Energy economy and prices 2 International comparisons 22 Danish key figures 23 Esbjerg Aalborg Aarhus Odense Copenhagen Design Danish Energy Agency Edition Internet Printing Quotations may be made from this publication with appropriate acknowledgement of source. Internet Available at Sources Danish Energy Agency Energy statistics 215 Statistics Denmark Danish Meteorological Institute Danmarks Nationalbank Danish Energy Agency Danish Ministry of Energy, Utilities and Climate Phone: E mail: statistik@ens.dk April 217 Geography Area, km 2 Coastline, km Number of islands Forest area, % Climate (215) Average temperature: January July Sunshine, hours Precipitation, mm Population Population (Jan. 216) By age: -19 years, % 2-59 years, % 6- years, % Population density, per km C 15.5 C Currency (215) 1 Krone (DKK) 1 USD 1 EURO 1 GBP Economics (215) GDP, billion DKK Exports, billion DKK Imports, billion DKK = 1 øre = 6.73 DKK = 7.46 DKK = 1.28 DKK Constitution and Government (217) Denmark is a constitutional monarchy Monarch is Queen Margrethe II The present government consists of: Venstre - The Liberal Party of Denmark The Conservative Party Liberal Alliance Labour Market (215) Labour force, Employed, Employed in industry, % Employed in agriculture and fishing, % Employed in commercial and public services, % Note: Adjusted means adjusted for climate and fuels for net electricity exports 2 3
3 ENERGY PRODUCTION ENERGY PRODUCTION Danish oil and gas fields and pipelines North North Sea Pipeline: Gas Pipeline: Crude oil Oil and gas fields In 215, there were nineteen oil and gas fields of varying size (fifteen oil and four gas fields). Seven fields are situated in the northern part of the Central Graben, while all the other fields are situated in the southern region of the Central Graben. Denmark is the third largest oil producer in Western Europe trailing only UK and Norway. Energy production and energy consumption '95 ' '5 '1 '15 Renewable energy etc. Natural gas Crude oil Gross energy consumption (adjusted) Degree of self-sufficiency 25% 2% 15% 1% 5% % 199 '95 ' '5 '1 '15 Total energy Oil Natural gas Energy production [] Total production Crude oil Natural gas Waste, non-renewable Renewable energy Oil and gas reserves and resources (Ultimo) Renewable energy production by type Consumption of renewable energy share of total energy consumption 3% 25% 2% 15% 1% 5% % 199 '95 ' '5 '1 ' Wind Straw Wood Biogas Waste, renewable Others Share covered by net imports Share covered by indigeneous production Crude Oil, Million m3 Natural Gas, Billion Nm3 4 5
4 ENERGY PRODUCTION ENERGY PRODUCTION 6 7
5 IMPORTS AND EXPORTS OF ENERGY ELECTRICITY AND HEAT Imports and exports of energy products, 215 Imports Exports Crude oil [1 tonnes] Oil products [1 tonnes] Natural gas [million Nm 3 ] Coal [1 tonnes] Electricity [GWh] Imports of coal and exports of crude oil by country, 215 South Africa 15% Norway 5% Imports of coal Other 6% Russia 52% Net exports of electricity Colombia 21% '95 ' '5 '1 '15 Sweden 56% France 2% Exports of crude oil UK 7% Finland 11% Netherlands 8% Germany 14% In Denmark, the foreign trade in electricity varies more than in any other European country. Foreign trade is strongly affected by price trends at the Nordic Electricity Exchange, Nord Pool, which is significantly influenced by the varying precipitation conditions in Norway and Sweden where electricity generation is dominated by water power. In 215, the Danish net imports of electricity totalled It was the result of net imports of 17.8 from Norway and 13.1 net imports from Sweden and net exports of 9.7 to Germany. Number of wind turbines by size Onshore Onshore Offshore Onshore Offshore Total turbines turbines turbines turbines turbines Total Total kw kw kw kw Total capacity of wind turbines by size [MW] Onshore Onshore Offshore Onshore Offshore Total turbines turbines turbines turbines turbines Total kw kw kw kw Number of wind turbines and size of capacity Number '9 '95 ' '5 '1 '15 Number of wind turbines Capacity of wind turbines MW Production of wind power Total '95 ' '5 '1 '15 Production of wind power Total Germany Norway Sweden 8 9
6 ELECTRICITY AND HEAT ELECTRICITY AND HEAT Electricity production by fuel [] Total gross production Oil Natural gas Coal Wind Other Electricity capacity (ultimo) [MW] Total electricity capacity Large-scale units Small-scale units Autoproducers Wind Solar Hydro District heating by fuel [] Total gross production Oil Natural gas Coal Surplus heat Waste, non-renewable Renewable energy of which: - Straw Wood Biofuels Waste, renewable Biogas Other 1 Electricity production by type % Electricity generated by renewables: Share of domestic electricity supply District heating production by type of producer CHP shares of electricity and district heat production 9% 8% 7% 6% 5% 4% 3% % 199 '95 ' '5 '1 '15 CHP Other Wind power 1994 ' '5 '1 '15 Wind power Wood, straw, biogas etc. Waste, renewable Large-scale CHP units Small-scale CHP units Autoproducers District heating units 1% % 199 '95 ' '5 '1 '15 District heating Electricity, shares of thermal production 1 11
7 DANISH ENERGY FLOWS DANISH ENERGY FLOWS 12 13

8 RENEWABLE ENERGY RENEWABLE ENERGY 14 15
9 ENERGY CONSUMPTION ENERGY CONSUMPTION Gross energy consumption by fuel Adjusted [] Total gross energy consumption Oil Natural gas Coal and coke Waste, non-renewable Renewable energy Final energy consumption by sector Climate adjusted [] Total final energy consumption Non-energy use Transport Industry and agriculture Commerce and public services Households Gross energy consumption and final energy consumption (Adjusted) Index 199= GDP, gross energy consumption and energy intensity (Adjusted) Final energy consumption by fuel '95 ' '5 '1 '15 Oil Coal and coke Electricity Gas works gas Final energy consumption Natural gas Renewable energy etc. District heating Final energy consumption by sector Households Commerce and public services Industry and agriculture Transport Non-energy use Electricity consumption '95 ' '5 '1 '15 Transformation and distribution losses Energy sector Final energy consumption 199 '95 ' '5 '1 '15 GDP Gross energy consumption Gross energy consumption/gdp 199 '95 ' '5 '1 '15 Road transport Manufacturing Commerce and public services Households '95 ' '5 '1 '15 Manufacturing Commerce and public services Households 16 17
10 ENERGY CONSUMPTION EMISSIONS Energy consumption for space heating in households Index 199= Heating installations in households 1 Units CO 2 emissions from energy consumption [Million tonnes] Observed CO 2 emissions Energy sector Transformation sector Final energy consumption Adjusted CO 2 emissions Energy sector Transformation sector Final energy consumption '95 ' '5 '1 '15 Energy intensities Heated floor space Final energy consumption Final energy consumption per m2 TJ per DKK million gross value added (21-prices) 1, Oil District Heating Natural gas Others Shares of renewable energy in final energy consumption 3% Total emissions from greenhouse gases CO 2 emissions per fuel unit and per kwh of electricity (Adjusted) Million tonnes CO 2 equivalent Kilogram per GJ Gram per kwh ,9,8,7,6 25% 2% ,5 15% ,4 1,3,2,1 1% 5% * Observed Adjusted '95 ' '5 '1 '15 CO2 emissions per fuel unit [kilogram per GJ] CO2 emissions per kwh electricity sold [gram per kwh], 199 '95 ' '5 '1 '15 Manufacturing Commerce and public services % 199 '95 ' '5 '1 '15 Manufacturing Commerce and public services Households *) Preliminary emission inventory 18 19
 25 2 25 2 DKK per kwh 1,6 1,4 15 15 1,2 1 1 1, 5 5,8,6 '9 '95 ' '5 '1 '14 Commerce and public services Industry and agriculture Energy supply Households GDP index (right axis),4,2, Source:")
11 ENERGY ECONOMY AND PRICES ENERGY ECONOMY AND PRICES Energy expenses by industry and households Billion DKK, current prices Index 199=1 Electricity prices for industrial consumers (Annual consumption 2-2 GWh) DKK per kwh 1,6 1, , , 5 5,8,6 '9 '95 ' '5 '1 '14 Commerce and public services Industry and agriculture Energy supply Households GDP index (right axis),4,2, Source: Statistics Denmark Source: Eurostat Economic key figures [Billion DKK, current prices] Total energy expenditures 142. Revenues from energy, CO 2 and sulphur taxation Expenditures to public service obligations on electricity Value of crude oil and natural gas production Energy prices for households, 215 DKK Euro Gasoline regular [per litre] Heating gas oil [per litre] Natural gas [per Nm 3 ] Electricity [per kwh] Exports of energy technology and equipment Decomposition of the electricity price for households, 215 (%) Billion DKK, current prices Exports of energy technology and equipment, Billion DKK Share of Denmark's total exports of commodities, % 16% 14% 12% 1% 8% 6% 4% 2% % 2 21
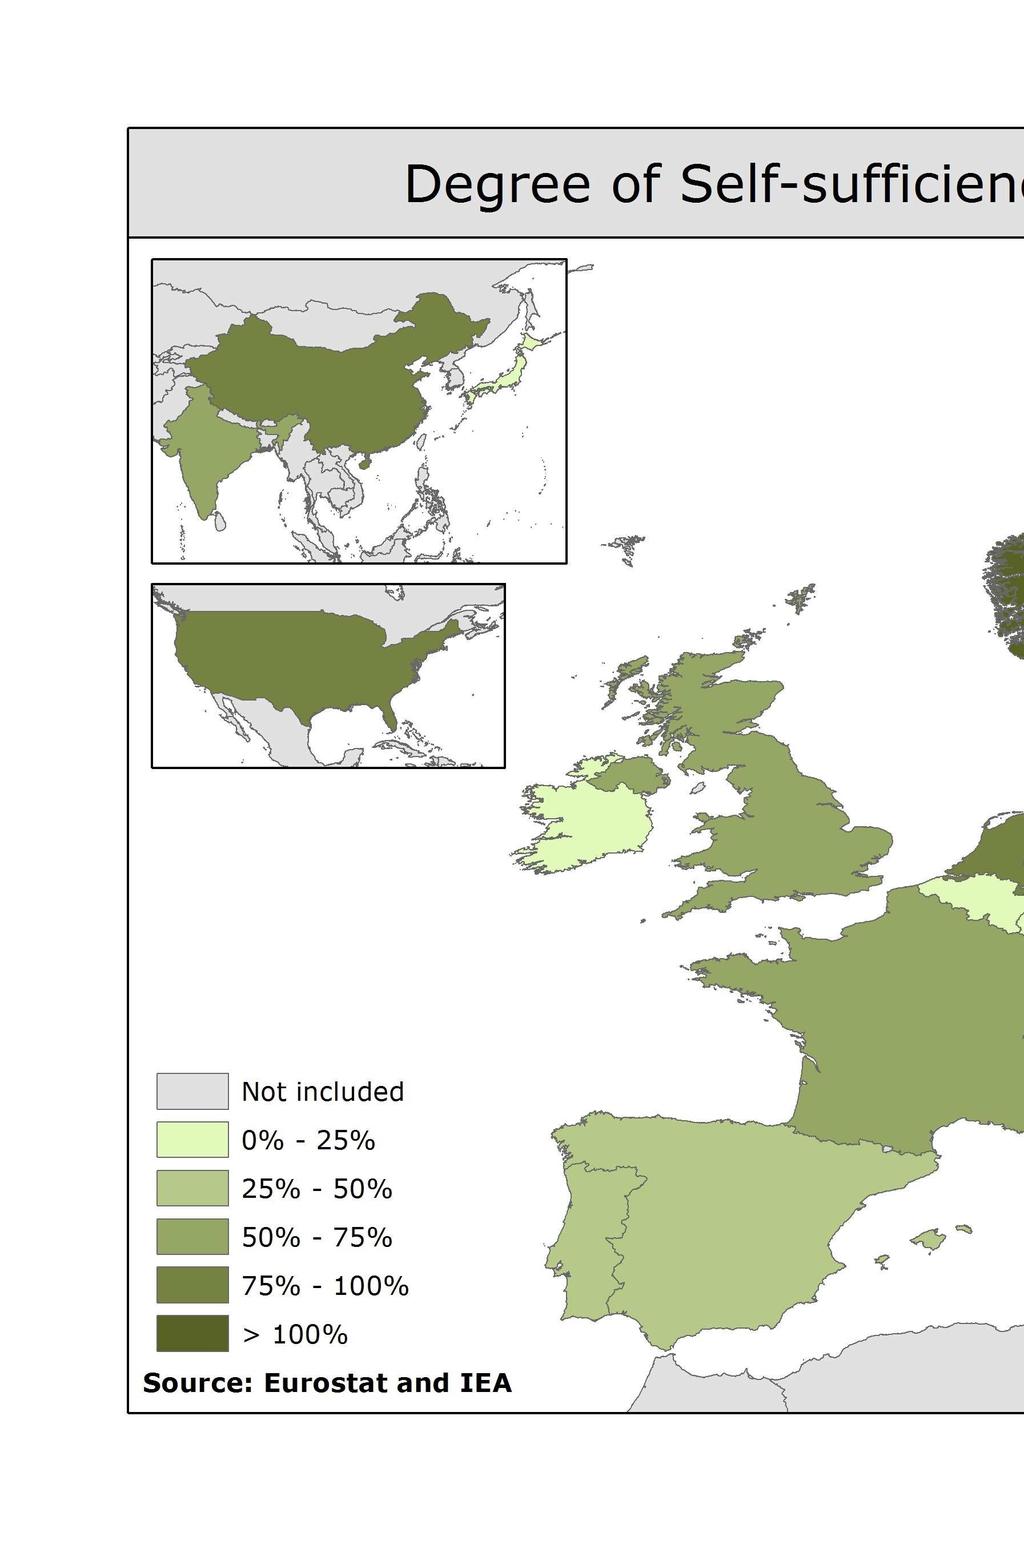
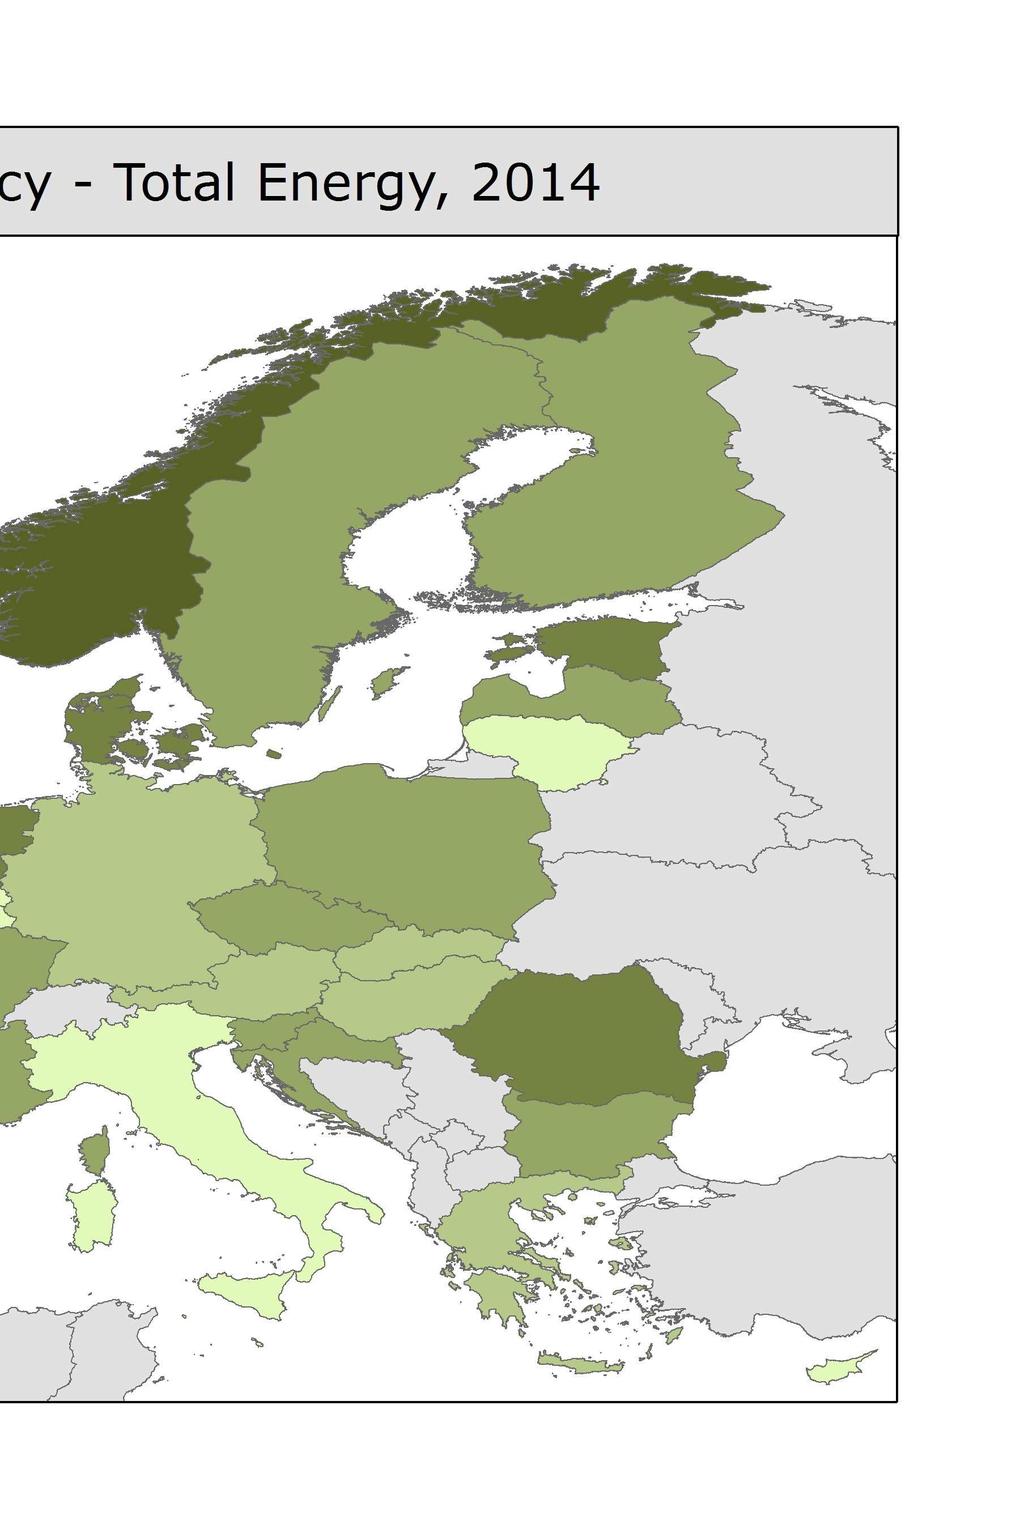
12 INTERNATIONAL COMPARISONS, 214 DANISH KEY FIGURES Degree of selfsufficiency [%] Renewable energy and waste: Share of gross energy consumption [%] Gross energy consumption per capita [GJ] Energy intensity [TOE per million EUR GDP (21 prices)] Denmark Estonia Romania Netherlands Poland Sweden Czech Republic Bulgaria UK Slovenia France Latvia Croatia Finland EU Hungary Slovakia Germany Austria Greece Spain Portugal Italy Belgium Lithuania Ireland Cyprus Luxembourg Malta Norway USA Japan Source: Eurostat and IEA. Gross energy consumption per capita [GJ] Final energy consumption per capita [GJ] Energy intensity, gross energy consumption [TJ per million GDP] Energy intensity, final energy consumption [TJ per million GDP] Degree of self-sufficiency [%] Dependency of oil [%] Renewable energy: Share of gross energy consumption [%] Refinery capacity [million tonnes per year] Electricity capacity [MW] Wind turbine capacity: Share of total electricity capacity [%] Net electricity exports: Share of domestic supply [%] CHP production: Share of thermal electricity production [%] CHP production: Share of district heating production [%] Renewable energy: Share of total domestic electricity supply [%] CO 2 emissions per capita [tonnes] CO 2 emissions per kwh sold [gram per kwh] CO 2 emissions per consumed unit of district heating [kilogram per GJ] CO 2 emissions per GDP [kilogram per DKK] Note: Data on energy consumption and CO 2 emissions are adjusted
13 Do you need more data? Energy Statistics 215 Publication as.pdf Figures in Powerpoint Time series and tables Danish energy flows Data Oil and gas production in Denmark Monthly energy statistics Wind turbine data Maps Key maps showing aspects of the Danish energy sector Danish Energy Agency Amaliegade 44 DK København K Tlf ens@ens.dk CVR-nr:
Data, tables, statistics and maps ENERGY IN DENMARK
 Data, tables, statistics and maps ENERGY IN DENMARK 216 Energy in Denmark, 216 Contents General information on Denmark 3 Energy production 4 Imports and exports of energy 8 Electricity and heat 9 Danish
CAP CONTEXT INDICATORS
 CAP CONTEXT INDICATORS 2014-2020 24. AGRICULTURAL TRAINING OF FARM MANAGERS 2017 update CONTEXT INDICATOR 24: AGRICULTURAL TRAINING OF FARM MANAGERS Learning by doing is still the main form of for the
Quick overview. Energy balance Production of primary energy. Renewable energy. Electricity and district heating. Consumption review 2009
 Energy Statistics29 CONTENTS Quick overview 3 Energy balance 29 4 Production of primary energy 5 Renewable energy 7 www.ens.dk You are welcome to visit the Energy Agency statistics and data web pages,
Data, tables, statistics and maps ENERGY STATISTICS
 Data, tables, statistics and maps ENERGY STATISTICS 215 CONTENTS At a glance 3 www.ens.dk Please feel free to visit the Danish Energy Agency s website for statistics and data www.ens.dk/facts_figures.
Photo: Thinkstock. Wind in power 2010 European statistics. February The European Wind energy association
 Photo: Thinkstock Wind in power 21 European statistics February 211 1 WIND IN POWER: 21 EUROPEAN STATISTICS Contents Executive summary 21 annual installations Wind map 21 Wind power capacity installations
Har du brug for flere data? 2006 Energistatistik 2006 Data Kort
 Gråt felt = foto Energy Statistics 26 www.ens.dk You are welcome to visit the Danish Energy Authority website, Facts & Figures, which features statistics and data from the Danish Energy Authority. The
Electricity and heat statistics
 Electricity and heat statistics Statistics Explained Data extracted in June 2018. Planned article update: June 2019. Gross electricity production by fuel, GWh, EU-28, 2000-2016Source: Eurostat (nrg105a)
Energy demand dynamics and infrastructure development plans in the EU. October 10 th, 2012 Jonas Akelis, Managing Partner - Baltics
 Energy demand dynamics and infrastructure development plans in the EU October 10 th, 2012 Jonas Akelis, Managing Partner - Baltics Forecasted energy demand dynamics of EU-11 will be significantly higher
Photo: Karpov. Wind in power 2009 European statistics. February 2010 THE EUROPEAN WIND ENERGY ASSOCIATION
 Photo: Karpov Wind in power 29 European statistics February 21 1 WIND IN POWER: 29 EUROPEAN STATISTICS Contents Executive summary 29 annual installations Wind map 29 Wind installations 29 Power capacity
ENERGY PRIORITIES FOR EUROPE
 ENERGY PRIORITIES FOR EUROPE Presentation of J.M. Barroso, President of the European Commission, to the European Council of 4 February 2011 Contents 1 I. Why energy policy matters II. Why we need to act
Over the whole year 2011, GDP increased by 1.4% in the euro area and by 1.5% in the EU27, compared with +1.9% and +2.0% respectively in 2010.
 35/2012-6 March 2012 Second estimates for the fourth quarter of Euro area and EU27 down by 0.3% +0.7% and +0.9% respectively compared with the fourth quarter of 2010 decreased by 0.3% in both the euro
Emissions Trading System (ETS): The UK needs to deliver its share of the total EU ETS emissions reduction of 21% by 2020, compared to 2005;
: The UK needs to deliver its share of the total EU ETS emissions reduction of 21% by 2020, compared to 2005;") Emissions Trading System (ETS): The UK needs to deliver its share of the total EU ETS emissions reduction of 21% by 2020, compared to 2005; Non-ETS emissions: The Effort Sharing Decision sets a target
Emissions Trading System (ETS): The UK needs to deliver its share of the total EU ETS emissions reduction of 21% by 2020, compared to 2005; Non-ETS emissions: The Effort Sharing Decision sets a target
Joint owner of the research company Profu Research leader of the waste management group at Chalmers University of Technology , Ph.D
 Joint owner of the research company Profu Research leader of the waste management group at Chalmers University of Technology 1993-2005, Ph.D. 1993. Profu Profu was established 1987 and has since then been
Ørsted transformation
 Ørsted transformation Converting and operating flexible power plants Vice President, Regulatory Affairs Ulrik Stridbæk 15 June 2018 Ørsted today Headquartered in Denmark Listed in the Nasdaq OMX: ORSTED
Energy consumption, GDP and energy intensity '85 '90 '95 '00 '05
 Index 198=1 The Danish example the way to an energy efficient and energy friendly economy February 29 Danish experience shows that through persistent and active energy policy focus on enhanced energy efficiency,
Wind energy in Europe markets
 Wind energy in Europe markets Turkish Wind Energy Congress (TWEC 2012), 7 November 2012, Istanbul Christian Kjaer CEO European Wind Energy Association (EWEA) More than 600 members from almost 60 countries
energy in figures Energy
 EU energy in figures Statistical pocketbook 2015 Energy This publication does not involve the European Commission in liability of any kind. Europe Direct is a service to help you find answers to your questions
Figure 1. Energy dependency of EU member states in 2004 (%)
") The ESTONIAN ENERGY SECTOR IN COMPARISON TO OTHER COUNTRIES Einari Kisel The n energy sector has undergone several significant changes in the past few years. The following article represents an effort
The ESTONIAN ENERGY SECTOR IN COMPARISON TO OTHER COUNTRIES Einari Kisel The n energy sector has undergone several significant changes in the past few years. The following article represents an effort
ISSN energy. in figures. Energy
 ISSN 1977-4559 EU energy in figures STATISTICAL POCKETBOOK 2014 Energy EU ENERGY IN FIGURES POCKETBOOK 2014 1 This publication does not involve the European Commission in liability of any kind. Europe
The need for better statistics for climate change policies
 The need for better statistics for climate change policies Jacqueline McGlade Greenhouse gas emission data: more timely and more spatial data needed EEA annual report on GHG trends and projections in Europe
Figures of Catalonia Generalitat de Catalunya Government of Catalonia
 www.idescat.cat Figures of Generalitat de Catalunya Government of POPULATION POPULATION STRUCTURE 5-9 % 0-4 % 5 4 3 2 1 0 0 1 2 3 4 5 Population (1 000) (1) 7 434 46 508 507 417 men 49.1 49.3 48.8 women
Energy Statistics 2017 edition
 Energy Statistics 2017 edition COMPACT GUIDES Energy Union Lighting, heating, transport, industrial output: without energy we would have none of these essential day-to-day services that make we and our
Energy policy choices of Poland. Marek Wąsiński The Polish Institute of International Affairs Paris, 27 September 2016
 Energy policy choices of Poland Marek Wąsiński The Polish Institute of International Affairs Paris, 27 September 2016 Main Principles of Polish Energy Policy Energy independence Stable and price-efficient
ODYSSEE-MURE, a decision support tool for energy efficiency policy evaluation. Recent energy efficiency trends in the EU
 ODYSSEE-MURE, a decision support tool for energy efficiency policy evaluation Recent energy efficiency trends in the EU Didier Bosseboeuf, ADEME, project coordinator Bruno Lapillonne, Karine Pollier; Enerdata
Background paper. Electricity production from wind and solar photovoltaic power in the EU
 Background paper Electricity production from wind and solar photovoltaic power in the EU February 2018 1 The 2009 Lisbon Treaty gave the European Union (EU) the authority to develop an energy policy containing
IEA data collection on RES
 IEA data collection on RES Samantha Ölz Renewable Energy Unit Workshop on Data Gathering on Renewable Energies for New Member States and Candidate Countries Scientific Technical Reference System on Renewable
DISTRICT HEATING AND COOLING 2005 STATISTICS
 DISTRICT HEATING AND COOLING 2005 STATISTICS 432 2005 unit Austria Bulgaria Czech Russia Croatia Denmark Finland Germany Estonia Hungary Iceland Italy Korea Latvia Lithuania Netherlands Norway Poland Romania
EU Climate and Energy Policy Framework: EU Renewable Energy Policies
 EU Climate and Energy Policy Framework: EU Renewable Energy Policies Buenos Aires 26-27 May 2015 Dr Stefan Agne European Commission DG Climate Action Energy 1 EU Climate and Energy Policy Framework 2 Agreed
NATIONAL RENEWABLE ENERGY ACTION PLAN FOR LITHUANIA
 NATIONAL RENEWABLE ENERGY ACTION PLAN FOR Tomas Garasimavičius Kaunas, 2010 50 45 40 35 30 25 20 15 10 5 0 ENERGY AGENCY EU and national RES targets 49 39,8 32,6 40 38 28,5 34 23,3 31 20,5 25 24 30 25
EUROPE S ENERGY PORTAL
 EUROPE S ENERGY PORTAL METHODOLOGY GAS & ELECTRICTY PRICES Collect Analyze Report EUROPEAN UNION END-USERS Description of the process leading to the determination of end-user prices for natural gas and
CAP CONTEXT INDICATORS
 CAP CONTEXT INDICATORS 2014-2020 44. ENERGY USE IN AGRICULTURE, FORESTRY AND THE FOOD INDUSTRY 2017 update BE BG CZ DK DE EE IE EL ES FR HR IT CY LV LT LU HU MT NL AT PL PT RO SI SK FI SE UK CONTEXT INDICATOR
How to secure Europe s competitiveness in terms of energy and raw materials? The answer, my friend, is blowing in the wind
 How to secure Europe s competitiveness in terms of energy and raw materials? The answer, my friend, is blowing in the wind Iván Pineda Head of Policy Analysis, EWEA PolyTalk 2014, Brussels Around 600 members
Pure Power. Wind energy targets for 2020 and A report by the European Wind Energy Association update
 Pure Power Wind energy targets for 22 and 23 A report by the European Wind Energy Association - 29 update Pure Power Wind energy targets for 22 and 23 A report by the European Wind Energy Association -
FRAMEWORK CONVENTION ON CLIMATE CHANGE - Secretariat CONVENTION - CADRE SUR LES CHANGEMENTS CLIMATIQUES - Secrétariat KEY GHG DATA
 UNITED NATIONS NATIONS UNIES FRAMEWORK CONVENTION ON CLIMATE CHANGE - Secretariat CONVENTION - CADRE SUR LES CHANGEMENTS CLIMATIQUES - Secrétariat KEY GHG DATA Greenhouse Gas Emissions Data for 1990 2003
ENERGY IN FINLAND FOLLOW US NEWS NOTIFICATIONS, SOCIAL MEDIA. tel
 FOLLOW US NEWS NOTIFICATIONS, SOCIAL MEDIA STATISTICS FINLAND Produces statistics on a variety of areas in society Promotes the use of statistical data Supports decision-making based on facts Creates preconditions
International trade related air freight volumes move back above the precrisis level of June 2008 both in the EU area and in the Unites States;
 Statistics Brief Global Trade and Transport October 2017 Air freight volumes increase since the second quarter of 2016 The latest update of global freight data collected by the International Transport
Global Warming Potential increased 6.8% in 2015, above the growth of economic activity
 Economic-environmental Indicators Air emissions accounts 1995-18 October 2017 Global Warming Potential increased 6.8% in, above the growth of economic activity In, the Global Warming Potential increased
The Development of Distributed Generation
 The Development of Distributed Generation Martin Scheepers ECN Policy Studies Int. Conf. Energy in Changing Environment, 13-14-15 December, 2007, Jacobs University Bremen www.ecn.nl Contents What is distributed
Brian Vad Mathiesen,
 The Smart Energy System: Sustuainable Energy Systems can solve more challenges than the Climate Crisis Brian Vad Mathiesen; February 28 2019, Copenhagen, Aalborg University Conference: The Lost Decade?
Environmental statistics in Europe Facts and figures on the environment: from environmental taxes to water resources
 STAT/10/189 10 December 2010 Environmental statistics in Europe Facts and figures on the environment: from environmental taxes to water resources What share of fresh water resources is being abstracted
EUROPEAN POLICIES TO PROMOTE ENERGY CROPS
 EUROPEAN POLICIES TO PROMOTE ENERGY CROPS Hilkka Summa European Commission DG Agriculture and Rural Development Outline 1) EU policy for renewable energy 2) Energy crops production and land use 3) The
Present and future of Renewable Energies in Europe
 Present and future of Renewable Energies in Europe Arnulf Jäger-Waldau and Nicolae Scarlat Scientific Technical Reference System on RE & EEE Renewable Energies Unit 1 The Renewable Energies Unit MISSION:
Energy Efficiency Indicators: The Electric Power Sector
 Energy Efficiency Indicators: 5 Sectors, 5 Challenges Mexico City, Mexico 14-15 March 2011 Energy Efficiency Indicators: The Electric Power Sector Robert Schnapp Head, Coal, Renewables, Electric and Heat
Background and objectives
 Workshop on greenhouse gas emission projections 12-13 December 2006, European Environment Agency, Copenhagen Background and objectives André Jol Head of Group climate change and energy European Environment
Trends and drivers in greenhouse gas emissions in the EU in 2016
 EU greenhouse gas inventory Trends and drivers in greenhouse gas emissions in the EU in 2016 Official data for 2016 confirm the longterm reduction in greenhouse gas emissions across Europe. This briefing
Sea freight data indicate weak import demand both in US and EU27. Data on inland road and rail freight indicate weak domestic activity
 Statistics Brief Global Trade and Transport July 2013 Global Freight Volumes Indicate Increasing Dependency on -led Growth The latest update of global freight data collected by the International Transport
Correlations between energy economy and housing market prices in the EU-impacts on future sustainability
 Correlations between energy economy and housing market prices in the EU-impacts on future sustainability Maria Alexandra MAASSEN The Bucharest University of Economic Studies, Bucharest, Romania maria.nichifor@fabiz.ase.ro
CAP CONTEXT INDICATORS
 CAP CONTEXT INDICATORS 2014-2020 33. FARMING INTENSITY 2017 update CONTEXT INDICATOR 33: FARMING INTENSITY Intensification is an important restructuring process that has characterised European agriculture
Eurostat current work on resource-efficient circular economy Renato Marra Campanale
 Eurostat current work on resource-efficient circular economy Renato Marra Campanale Renato.Marra-Campanale@ec.europa.eu Eurostat Unit E2 'Environmental statistics and accounts; sustainable development'
ANNUAL PUBLICATION: detailed data. VOLUME OF EXPORTS FELL BY 4,7 PER CENT IN 2015 Export prices rose 0,7 per cent. 24 March 2016
 ANNUAL PUBLICATION: detailed data 2 March 216 VOLUME OF EXPORTS FELL BY,7 PER CENT IN 21 Export prices rose,7 per cent According to Finnish Customs preliminary data, the value of Finland s goods exports
International Indexes of Consumer Prices,
 International Indexes of Consumer Prices, July International Labor Comparisons Table of Contents Highlights... 1 Monthly Charts.. Monthly Tables... Annual Charts..... 5 Annual Tables.. 7 Technical Notes..
Recent trends and projections in EU greenhouse gas emissions
 Approximated greenhouse gas emissions Recent trends and projections in EU greenhouse gas emissions Greenhouse gas (GHG) emissions in the European Union (EU) increased by 0.6 % in 2017, according to preliminary
Energy Mapping in Heat Roadmap Europe
 Energy Mapping in Heat Roadmap Europe Susana Paardekooper, Aalborg University 13 June 2017 District Energy in Chile Who are we? Energy planning: Highly renewable energy systems with radical technological
RENEWABLE H&C: BREAK-THROUGH NEEDS?
 RENEWABLE H&C: BREAK-THROUGH NEEDS? Tobias Fleiter, Jan Steinbach, Fraunhofer ISI Brussels, 2017/10/17, EUFORES Based on 3 EU H&C projects Mapping and analyses of the H/C fuel deployment EC tender study
The new Energy Policy. Jean-Arnold Vinois Head of Unit Energy Policy and Security of Supply Directorate General for Energy and Transport
 The new Energy Policy Jean-Arnold Vinois Head of Unit Energy Policy and Security of Supply Directorate General for Energy and Transport 1 The 3 challenges Sustainable Development Competitiveness FULLY
Energy transition in Poland 2017
 Analizy i dialog www.forum-energii.eu Forum Energii is the Polish think tank forging the foundations of an effective, secure, clean and innovative energy system. All Forum Energii analyses may be copied
The EU Renewable Energy Framework for Biogas. Giulio Volpi Renewable Energy and CCS Unit DG Energy, European Commission
 The EU Renewable Energy Framework for Biogas Giulio Volpi Renewable Energy and CCS Unit DG Energy, European Commission The 20-20-20 EU policy, by 2020-20% -20% 100% 20% Greenhouse gas levels Energy consumption
12. Waste and material flows
 1 Environmental signals 22 12. Waste and material flows policy issue indicator assessment decoupling resource use from economic activity decoupling waste generation from economic activity reducing generation
How effective will the EU s largest post-2020 climate tool be?
 Understanding the Climate Action Regulation How effective will the EU s largest post-2020 climate tool be? Carbon Market Watch Policy Brief, April 2018 Introduction The Climate Action Regulation (CAR),
WIND POWER TARGETS FOR EUROPE: 75,000 MW by 2010
 About EWEA EWEA is the voice of the wind industry actively promoting the utilisation of wind power in Europe and worldwide. EWEA members from over 4 countries include 2 companies, organisations, and research
International Gas Union. 23rd World Gas Conference 5th to 9th of June 2006, Amsterdam, NL. Strategic panel Other fuels - biogas
 International Gas Union 23rd World Gas Conference 5th to 9th of June 2006, Amsterdam, NL Strategic panel Other fuels - biogas Jens Bo Holm-Nielsen Head of Department Department of Bioenergy University
(sources: EnergyPLAN cost database)
") Smart Energy Systems or electrification - Infrastructures and paths to 100% Renewable energy studies from the projects RE-INVEST, Heat Roadmap Europe, the 4DH Centre. Brian Vad Mathiesen; Friday 23 February
Smart Energy Systems or electrification - Infrastructures and paths to 100% Renewable energy studies from the projects RE-INVEST, Heat Roadmap Europe, the 4DH Centre. Brian Vad Mathiesen; Friday 23 February
Opportunities in Renewable Energies. World Renewable Energy technology Congress Delhi, 27 th September 2013
 Opportunities in Renewable Energies Franzjosef Schafhausen Deputy Director General Energy Transition Federal Ministry of the Environment, Nature Conservation and Nuclear Safety, Berlin World Renewable
Wind energy and Climate policy Fixing the Emission Trading System
 Wind energy and Climate policy Fixing the Emission Trading System Rémi Gruet Senior Advisor - Climate Change & Environment European Wind Energy Association 1st February 2012 EWEA Members Across entire
State of play of energy efficiency investment and financing scheme Czech Republic
 State of play of energy efficiency investment and financing scheme Czech Republic Vladimír Sochor Director of Department on Energy Efficiency and Savings Ministry of Industry and Trade Financing Energy
Core projects and scientific studies as background for the NREAPs. 9th Inter-Parliamentary Meeting on Renewable Energy and Energy Efficiency
 Core projects and scientific studies as background for the NREAPs 9th Inter-Parliamentary Meeting on Renewable Energy and Energy Efficiency Brussels, 18.11.2009 Mario Ragwitz Fraunhofer Institute Systems
SITUATION, TRENDS AND PROSPECTS OF THE SUPPLY OF FISHERIES AND AQUACULTURE PRODUCTS TO THE EU MARKET
 SITUATION, TRENDS AND PROSPECTS OF THE SUPPLY OF FISHERIES AND AQUACULTURE PRODUCTS TO THE EU MARKET European Commission Seminar Madrid 15 April 2010 Audun Lem, FAO 1 Outline World fish supply and demand
Trends in waste generation and management in Europe. Özgür Saki European Environment Agency
 Trends in waste generation and management in Europe Özgür Saki European Environment Agency The European Environment Agency An EU institution situated in Copenhagen since 1994 Provides the information necessary
Danish and European plans for wind energy deployment
 Chapter 5 Danish and European plans for wind energy deployment By Peter Hjuler Jensen and Søren Knudsen, DTU Wind Energy; Poul Erik Morthorst, DTU Management Engineering Danish and European plans for wind
Success factors of bioenergy for CHG mitigation in Scandinavia
 Success factors of bioenergy for CHG mitigation in Scandinavia Satu Helynen VTT Energy 1. Use of biomass based fuels in Europe 2. Role of forest industry in bionergy sector 3. Combined heat and power (CHP)
Energy Efficiency and Policies in Tertiary Sector (Estonia) INGE ROOS, PhD Tallinn University of Technology Department of Energy Technology
 INGE ROOS, PhD Tallinn University of Technology Department of Energy Technology") Energy Efficiency and Policies in Tertiary Sector (Estonia) INGE ROOS, PhD Tallinn University of Technology Department of Energy Technology Final energy consumption by economic activity in Estonia 2000:
Energy Efficiency and Policies in Tertiary Sector (Estonia) INGE ROOS, PhD Tallinn University of Technology Department of Energy Technology Final energy consumption by economic activity in Estonia 2000:
The Innovation Union Scoreboard: Monitoring the innovation performance of the 27 EU Member States
 MEMO/12/74 Brussels, 7 February 2012 The Innovation Union Scoreboard: Monitoring the innovation performance of the 27 EU Member States This MEMO provides an overview of the research and innovation performance
Wind energy overview. Lauri Ulm
 Wind energy overview Lauri Ulm 14.08.2014 About me Name: Lauri Ulm Work Currently: Renewable energy development manager Past: Asset Management Department network analyst Eletricity network designer Education
Approximated greenhouse gas emissions in 2016
 Approximated greenhouse gas emissions Approximated greenhouse gas emissions in 2016 This briefing presents early approximated (proxy) estimates of greenhouse gas (GHG) emissions for 2016 in the European
10. Demand (light road freight veh shares)
") . Demand (light road freight veh shares) Overview Target The view is intended to calculate the share of light vehicles in total road freight vehicles. The light road freight vehicles are those belonging
. Demand (light road freight veh shares) Overview Target The view is intended to calculate the share of light vehicles in total road freight vehicles. The light road freight vehicles are those belonging
ANNEXES. to the. Proposal for a REGULATION OF THE EUROPEAN PARLIAMENT AND OF THE COUNCIL
 EUROPEAN COMMISSION Brussels, 20.7.2016 COM(2016) 479 final ANNEXES 1 to 6 ANNEXES to the Proposal for a REGULATION OF THE EUROPEAN PARLIAMENT AND OF THE COUNCIL on the inclusion of greenhouse gas emissions
Sectoral Profile - Industry
 Sectoral Profile - Industry Energy consumption Energy consumption trends in EU There is a regular decrease in energy consumption since 2003, although there was growth in industrial activity from 2003 to
Phasing out nuclear power in Europe Rolf Golombek, Finn Roar Aune and Hilde Hallre Le Tissier 39th IAEE International Conference Bergen, June 2016
 Oslo Centre of Research on Environmentally friendly Energy Phasing out nuclear power in Europe Rolf Golombek, Finn Roar Aune and Hilde Hallre Le Tissier 39th IAEE International Conference Bergen, June
Circular Economy and Energy Union
 Circular Economy and Energy Union Dr. Ella Stengler CEWEP Managing Director 16 June 2016, Rotterdam 8 th CEWEP Waste-to-Energy Congress 2016 1 Members CEWEP Confederation of European Waste-to-Energy Plants
Highlights. Figure 1. World Marketed Energy Consumption by Region,
 Highlights World energy consumption is projected to increase by 71 percent from 3 to 23. Fossil fuels continue to supply much of the energy used worldwide, and oil remains the dominant energy source. In
Global Energy Production & Use 101
 Global Energy Production & Use 101 Jean-Sébastien Rioux The School of Public Policy SPP-HEI Summer School on the Geopolitics of Energy & Natural Resources Calgary, AB May 15-20, 2017 Presentation highlights
Options for structural measures in the EU ETS
 CEPS Carbon Market Forum 23 April 2013, Brussels Options for structural measures in the EU ETS Stefan P. Schleicher Wegener Center for Climate and Global Change University of Graz A B B C C D E F F G G
Accounting CO 2 emissions from electricity and district heat used in buildings
 Accounting CO 2 emissions from electricity and district heat used in buildings Jarek Kurnitski, D.Sc. Docent, Research manager Helsinki University of Technology, HVAC-Technology Euroheat & Power 29 2.5.29
RFID Systems Radio Country Approvals
 SIMATIC Ident RFID Systems Radio Approvals 2017-12-17 www.siemens.com/ident Short Range Systems RF200 RF300 RF1060 MOBY D RF210R / RF220R 6GT2821-1AC10,-2AC10 RF210R / RF220R / RF240R/ RF250R/ RF260R IO-Link
Energy and CO 2 emissions in the OECD
 Energy and CO 2 emissions in the OECD With detailed supply and demand data up to 216 1 1. Data based on the 218 preliminary editions of the IEA World energy balances, and the IEA CO 2 Emissions from fuel
European information on climate change impacts, vulnerability and adaptation
 André Jol, EEA Head of Group Climate change impacts, vulnerability impacts, vulnerability and adaptation Conference: Adaptation to climate change: what is the situation in Belgium? Brussels, 23 November
The Cancun Agreements: Land use, land-use change and forestry
 Decision 2/CMP.6 The Cancun Agreements: Land use, land-use change and forestry The Conference of the Parties serving as the meeting of the Parties to the Kyoto Protocol, Affirming that the implementation
Environmental Best Practices, It Begins with Us: Business, Local Governments and International Community Should Work Together
 Environmental Best Practices, It Begins with Us: Business, Local Governments and International Community Should Work Together Jung Wan Lee, PhD Boston University, United States Objectives of the Paper
3. Future wood demand for energy
 UNECE/FAO Workshop on wood resource balances Part II: Future wood resource availability and demands presented by Sebastian Hetsch University of Hamburg Centre of Wood Science Udo Mantau Florian Steierer
CROATIA. Risk Assessment Exercise
 CROATIA Risk Assessment Exercise JRC Institute for Energy Enlargement and Integration Workshop, 5-7 October 211 Hotel Valamar Lacroma, Dubrovnik, Croatia Robert Bošnjak, Energy Institute Hrvoje Požar BASIC
EU 2020 Targets: Managing integration of wind in the Hungarian grid. Tari Gábor CEO. Wind Energy the Facts Tari G. 12 June 2009 Workshop,
 EU 2020 Targets: Managing integration of wind in the Hungarian grid Tari Gábor CEO Wind Energy the Facts Workshop, 12.06.2009 Contents 2 Hungarian Electric Power System the facts Generation mix Consumption
Even implementation of the EU Timber Regulation Harmonizing and improving the implementation of the EUTR in the EUTR countries
 Even implementation of the EU Timber Regulation Harmonizing and improving the implementation of the EUTR in the EUTR countries Thünen Institute, 09 October 2018, Hamburg EUTR EU MS obligations for application
(c) The terms of the agreement are set out in the Annex to this Note Verbale.
 The terms of the agreement are set out in the Annex to this Note Verbale.") Note Verbale No EDD/2018/001 Her Britannic Majesty's Foreign and Commonwealth Office presents its compliments to the Secretariat of the United Nations Framework Convention on Climate Change and has the
Note Verbale No EDD/2018/001 Her Britannic Majesty's Foreign and Commonwealth Office presents its compliments to the Secretariat of the United Nations Framework Convention on Climate Change and has the
ANNEXES. to the COMMUNICATION FROM THE COMMISSION TO THE EUROPEAN PARLIAMENT AND THE COUNCIL
 EUROPEAN COMMISSION Brussels, 23.7.2014 COM(2014) 520 final ANNEXES 1 to 3 ANNEXES to the COMMUNICATION FROM THE COMMISSION TO THE EUROPEAN PARLIAMENT AND THE COUNCIL Energy Efficiency and its contribution
Recent Trends in Energy Prices
 DIRECTORATE GENERAL FOR INTERNAL POLICIES POLICY DEPARTMENT A: ECONOMIC AND SCIENTIFIC POLICY Recent Trends in Energy Prices IN-DEPTH ANALYSIS Abstract After a dramatic fall in 2014, oil and fuel prices
Bioenergy development in Finland and EU: Fatcors affecting the future development
 Bioenergy development in Finland and EU: Fatcors affecting the future development Banska Bystrica 12.10.2010 Dan Asplund Asko Ojaniemi 1 Bioenergy 2009 Dan Asplund Use of Bioenergy Small scale: heating
The European Approach to Decrease Energy Consumption in Buildings Towards ZEB (Zero Energy Buildings)
") The European Approach to Decrease Energy Consumption in Buildings Towards ZEB (Zero Energy Buildings) Professor Bjarne W. Olesen, Ph.d., Dr.h.c., R. Centre for Indoor Environment and Energy Technical University
The European Approach to Decrease Energy Consumption in Buildings Towards ZEB (Zero Energy Buildings) Professor Bjarne W. Olesen, Ph.d., Dr.h.c., R. Centre for Indoor Environment and Energy Technical University
Example of using detailed statistics: The case of poplar markets in EU
 Example of using detailed statistics: The case of poplar markets in EU Arvydas Lebedys FAO Forestry Officer (Statistics) Eurostat Forestry Statistics Working Group Meeting, Luxembourg, 16-17 November 2011
At A Glance Summary of Q highlights
 At A Glance Summary of Q1 214 highlights Economic Bulletin Q1 214 EU food and drink industry evolution during Q1 214 against major economic trends in the EU EVOLUTION OF MAIN AGRICULTURAL RAW MATERIAL
European Commission. Communication on Support Schemes for electricity from renewable energy sources
 European Commission Communication on Support Schemes for electricity from renewable energy sources External Costs of energy and their internalisation in Europe Beatriz Yordi DG Energy and Transport External