Notes: Slide 1 of 20. Long Term World Oil Supply
|
|
|
- Bethanie Lang
- 6 years ago
- Views:
Transcription

1 Long Term World Oil Supply Slide 1 of 20 The following pages summarize a recent EIA presentation on estimates of the world conventional oil resource base and the year when production from it will peak and then begin to decline. A version of this presentation was given by former EIA Administrator Jay Hakes to the April 18, 2000 meeting of the American Association of Petroleum Geologists in New Orleans, Louisiana. Specific information about this presentation may be obtained from John Wood (john.wood@eia.doe.gov), Gary Long (gary.long@eia.doe.gov) or David Morehouse (david.morehouse@eia.doe.gov). [8/10/2000 4:56:23 PM]
2 Slide 2 of 20 [8/10/2000 4:56:24 PM]
3 Slide 3 of 20 [8/10/2000 4:56:25 PM]

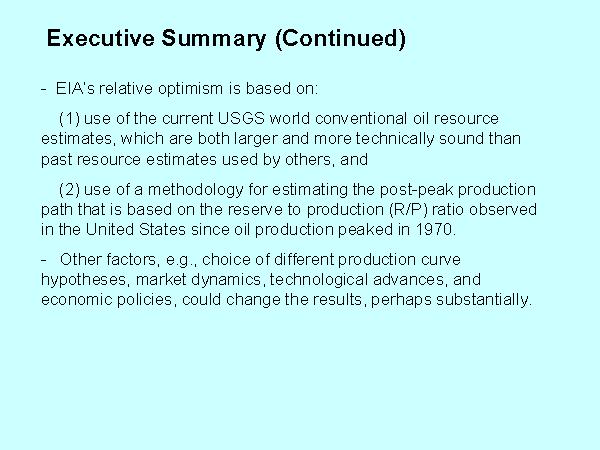
4 Slide 20 of This table summarizes EIA results based on the 3 USGS ultimate recovery volumes, 4 annual production growth rates, and a production decline after the peak at a constant reserves to production ratio of EIA estimates that, based on recent USGS estimates of the global oil resource base, worldwide oil production is likely to continue increasing for more than three decades. 3. EIA s estimated production peaks are generally later in time than those estimated by other analysts. 4. EIA s relative optimism is based on: (1) use of the current USGS world conventional oil resource estimates, which are both larger and more technically sound than past resource estimates used by others, and (2) use of a methodology for estimating the post-peak production path that is based on the reserve to production (R/P) ratio observed in the United States since oil production peaked in [8/10/2000 4:56:26 PM]
5 Long Term World Oil Supply (A Resource Base/Production Path Analysis) Long Term World Oil Supply (A Resource Base/Production Path Analysis) 07/28/2000 Click here to start Table of Contents Long Term World Oil Supply (A Resource Base/Production Path Analysis) Executive Summary Executive Summary (Continued) Executive Summary (Continued) Authors: John Wood, Gary Long Home Page: Download presentation source Overview The Year of Peak Production..When will worldwide conventional oil production peak?... Lower 48 Crude Oil Reserves & Production Texas Oil and Condensate Production, and Texas First Purchase Price (FPP), Published Estimates of World Oil Ultimate Recovery Different Interpretations of a Hypothetical 6,000 Billion Barrel World Original Oil-in-Place Resource Base Campbell-Laherrère World Oil Production (1 of 2) [8/10/2000 4:56:26 PM]
6 Long Term World Oil Supply (A Resource Base/Production Path Analysis) Estimates, Laherrere s Oil Production Forecast, EIA World Oil Production Projections, Annual Production with 2 Percent Annual Growth & Decline Annual Production with 2 Percent Growth Rates and Different Decline Methods Annual Production Scenarios with 2 Percent Growth Rates and Different Resource Levels Annual Production Scenarios for the Mean Resource Estimate and Different Growth Rates Annual Production Scenarios for the Mean Resource Estimate Showing Sharp and Round Peaks 12 EIA World Conventional Oil Production Scenarios World Oil Production Scenarios (2 of 2) [8/10/2000 4:56:26 PM]
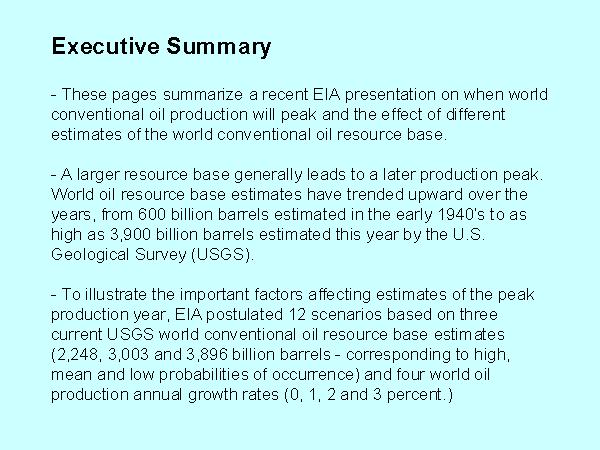
7 Executive Summary - These pages summarize a recent EIA presentation on when world conventional oil production will peak and the effect of different estimates of the world conventional oil resource base. - A larger resource base generally leads to a later production peak. World oil resource base estimates have trended upward over the years, from 600 billion barrels estimated in the early 1940 s to as high as 3,900 billion barrels estimated this year by the U.S. Geological Survey (USGS). - To illustrate the important factors affecting estimates of the peak production year, EIA postulated 12 scenarios based on three current USGS world conventional oil resource base estimates (2,248, 3,003 and 3,896 billion barrels - corresponding to high, mean and low probabilities of occurrence) and four world oil production annual growth rates (0, 1, 2 and 3 percent). Previous slide Next slide Back to first slide View graphic version [8/10/2000 4:56:27 PM]
 and the 3 USGS technically recoverable oil resource volumes")
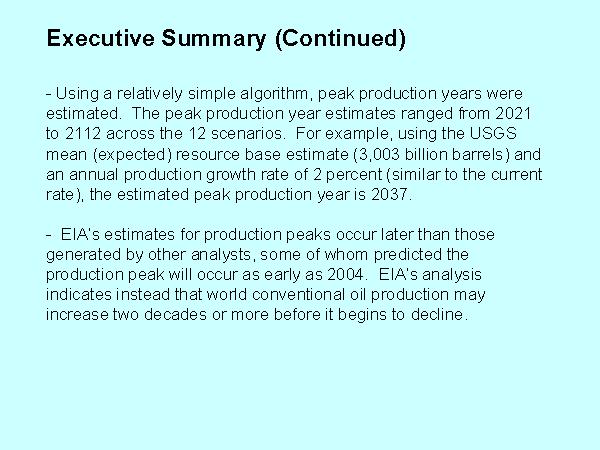
8 Slide 19 of This summary graph shows all 12 long-term production scenarios based on the 4 annual production growth rates (0, 1, 2, and 3 percent) and the 3 USGS technically recoverable oil resource volumes (2,248, 3,003, and 3,896 billion barrels) equivalent to the 95 percent probable, mean (expected value), and a 5 percent probable volumes. 2. The estimated peak year of production ranges from 2021 to 2067 (a span of 46 years) for the 1, 2, and 3 percent per year growth rates and the 3 resources volumes. Including the 0 percent growth rate extends the estimated production peak range to 2112 (a span of 91 years). For the mean resource and 2 percent production growth rate scenario, which reflect the expected resource volume and the recently experienced production growth rate, the peak occurs in Market feedback mechanisms might smooth and flatten the sharp production peaks as the actual production paths play out, moving the peaks earlier in time. 4. The peak year would be delayed by discovery of a larger recoverable conventional resource base than is currently estimated, or it could occur earlier with accelerated production rates. It may also vary as global oil demand varies. For example, if demand for oil weakens for economic reasons or because substitutes for conventional oil gain market share, the conventional oil production growth rate may decline and result in a later peak. [8/10/2000 4:56:32 PM]
9 World Oil Production Scenarios World Oil Production Scenarios Previous slide Back to first slide View graphic version 1. This table summarizes EIA results based on the 3 USGS ultimate recovery volumes, 4 annual production growth rates, and a production decline after the peak at a constant reserves to production ratio of EIA estimates that, based on recent USGS estimates of the global oil resource base, worldwide oil production is likely to continue increasing for more than three decades. 3. EIA s estimated production peaks are generally later in time than those estimated by other analysts. 4. EIA s relative optimism is based on: (1) use of the current USGS world conventional oil resource estimates, which are both larger and more technically sound than past resource estimates used by others, and (2) use of a methodology for estimating the post-peak production path that is based on the reserve to production (R/P) ratio observed in the United States since oil production peaked in [8/10/2000 4:56:33 PM]
10 Slide 4 of 20 [8/10/2000 4:56:34 PM]

11 Overview Slide 5 of A version of this presentation was originally given by former EIA Administrator Jay Hakes at the American Association of Petroleum Geologists on April 18, 2000, in New Orleans, Louisiana. 2. The presentation illustrates the effects of resource and production assumptions on the timing of world conventional oil production and offers a range of EIA scenario estimates on when the production peak might occur. 3. The conventional oil resource base is defined as all oil produced from reservoirs through a wellbore using any primary, secondary, improved, enhanced or tertiary method. It does not include liquids from mined deposits (tar sands, oil shales) or created liquids (gas-to-liquids, coal oil). Canadian and Venezuelan heavy oil and tar sands and similar deposits are also excluded. [8/10/2000 4:56:34 PM]

12 The Year of Peak Production Slide 6 of 20 When world conventional oil production will peak is, of course, the bottom-line question. It has already peaked in the United States, in Some U.S. and European evaluators have put this pivotal world event as early as The prospect that world oil production might actually start to decline in the next ten years is indeed disturbing. 3. The United States experience is illustrative of the typical growth, peak and decline sequence, as shown on the next two pages. [8/10/2000 4:56:35 PM]
, predicted that Lower-48 States oil")
13 Slide 7 of The graph shows proved reserves and production of conventional oil for the lower-48 States and the continental shelf. 2. M. King Hubbert, in his famous 1956 paper Nuclear Energy and the Fossil Fuels (Drilling and Production Practices, American Petroleum Institute, Washington, DC, 1956), predicted that Lower-48 States oil production would peak in 1965 if the assumed ultimate cumulative production were 150 billion barrels or in 1970 if the assumed ultimate cumulative production were 200 billion barrels. 3 For the United States, actual production peaked in Hubbert also predicted that proved reserves of oil would peak before production peaked, and U.S. proved reserves did so in These U.S. reserves and production peaks still look like they will be the all-time peaks. 5. The United States experience conforms to the expected nature of the production cycle of a finite resource - and conventional oil is a finite resource. 6. Although market mechanisms such as higher prices and/or the application of new discovery, production, or end-use technologies might delay the peak and/or slow the decline, eventually production will peak and then fall for any finite resource. (1 of 2) [8/10/2000 4:56:36 PM]
14 7. If one can estimate the ultimate cumulative production (ultimate recovery) and the rates of production increase up to the peak and decline after the peak, then it is straightforward to predict when the production peak will occur. We ll demonstrate this later in the presentation. (2 of 2) [8/10/2000 4:56:36 PM]

15 Slide 8 of 20 Market prices can affect production paths, particularly in the short-run. Texas is a good example: 1. Texas has been producing oil for more than 100 years. 2. In the early 1980 s, Texas oil production had been declining by a couple of percent per year even with relatively high prices and drilling rates. 3. Production was actually increasing slightly at the end of 1985, but in 1986, oil prices fell 51 percent and oil production fell 13 percent. 4. Oil production increased 1 percent in Texas in 1997 at average prices and moderate drilling rates, but in 1998 prices plunged by 44 percent and Texas oil production fell 14 percent. 5. Clearly, market prices have a short-term effect on production rates. [8/10/2000 4:56:37 PM]

16 Slide 9 of This graph shows many estimates of world oil resources made since They have ranged from 600 billion to 3,896 billion barrels. 2. There is an overall increasing trend of ultimate recovery estimates over time. This trend is primarily due to increases in the quantity and quality of geological, geophysical, and reservoir engineering information, and to the development of more rigorous estimation methodologies. 3. For example, by 1959 Weeks' estimate had tripled from his 1948 estimate of 600 billion barrels to 2,000 billion barrels. The same kind of increase is observed in other cases in which the same estimators made successively larger estimates. 4. The largest world oil ultimate recovery estimates are the newly released USGS estimates. The USGS 95 percent probable value is 2,248 billion barrels (meaning there is a 19 out of 20 chance that the value will be greater than 2,248 billion barrels). Similarly, the USGS says there is a 5 percent probability (1 chance out of 20) that the value will exceed 3,896 billion barrels. The USGS mean estimate (the expected value) is 3,003 billion barrels. 5. There are a number of basins, especially in the Arctic and Antarctica, that were not included in the USGS world resource assessment because they were judged unlikely to add proved reserves during the next 30 years. Therefore, there is still some potential for even higher resource assessments. [8/10/2000 4:56:38 PM]
 can be understood by use of the original oil-in-place concept, as shown in the graph. 2.")
17 Slide 10 of One of the primary differences among recent estimates of recoverable oil resources, (e.g., the USGS s 3 trillion barrels and Campbell-Laherrere s 1.8 trillion barrels) can be understood by use of the original oil-in-place concept, as shown in the graph. 2. Original oil-in-place is the total resource base without regard to recoverability; it is essentially geologic in nature. The oil recovery factor (expected ultimate recovery divided by original oil-in-place) indicates what percent of the total resource can be recovered. Ultimately, the actual percentage recovered is significantly driven by complex economic and technological considerations. 3. Recoverable resources include cumulative production, proved reserves, undiscovered reserves, and reserves growth in discovered fields. 4. As a hypothetical illustration, assume that the original world oil-in-place is 6 trillion barrels, as shown in this graph. Campbell and Laherrere s 1.8 trillion barrel recoverable resource estimate (right column) would imply a 30 percent recovery factor, mostly comprised of cumulative production and proved reserves. 5. But the USGS 3 trillion barrel recoverable resource estimate (left column) would imply a recovery factor of 50 percent. Because cumulative production and proved reserves constitute 1.6 trillion barrels, the additional 1.4 trillion barrels comes from reserves growth in discovered fields and from undiscovered resources. (1 of 2) [8/10/2000 4:56:39 PM]
18 6. Application of the original oil-in-place concept shows that recoverable resource estimate variations have corresponding differences in recovery factors, for example. These differences often stem more from differing economic and technological assumptions than from geologic issues. (2 of 2) [8/10/2000 4:56:39 PM]

19 Campbell-Laherrère World Oil Production Estimates, Slide 11 of Since M. King Hubbert accurately predicted the peak in U.S. oil production, it s easy to understand why his methodology has gained a following in predicting the world oil production peak. 2. One of the most recent - and controversial - projections of the world conventional oil resource production path used a Hubbert-like methodology. The estimators were Colin Campbell and Jean Laherrère, whose results were published in Scientific American ( The End of Cheap Oil?, March 1998). 3. As shown in this graph, they predicted that world oil production would peak in 2004, very soon indeed. However, Campbell-Laherrère made assumptions that not all analysts agree with, including their estimate of the world oil resource base (1.8 trillion barrels of recoverable oil).. [8/10/2000 4:56:41 PM]

20 Laherrere s Oil Production Forecast, Slide 12 of There are several other estimates that show the peak production year occurring within the next 10 years. 2. This graph shows Laherrere s 1997 estimate; he predicted the peak would occur around 2010 ( Future Sources of Crude Oil Supply and Quality Considerations, DRI/McGraw-Hill/French Petroleum Institute, June 1997). 3. Other estimates (not shown) within the next ten years are: L. F. Ivanhoe s estimate also showed peak production around 2010 ( Get Ready For Another Oil Shock!, The Futurist, Jan-Feb, 1997). Duncan and Youngquist s estimate of peak production is ( The World Petroleum Life-Cycle: Encircling the Production Peak, [8/10/2000 4:56:42 PM]

21 Slide 13 of EIA s International Energy Outlook 2000 predicts that the global conventional oil production peak will occur after 2020, since production is still growing in The IEO2000 projections were based on the 1994 USGS mean oil resource estimate, which is a little smaller than the 95 percent probable volume in the 2000 USGS assessment, but substantially larger than that used in the Campbell-Laherrere projections. [8/10/2000 4:56:42 PM]

22 Slide 14 of To illustrate the effect of resource and production assumptions on production forecasts, EIA postulated 12 simple long-term world production rate scenarios designed to bracket the range of future production outcomes. The scenarios were based on the 95 percent probable, mean, and 5 percent probable USGS resource estimates (2,248 billion, 3,003 billion, and 3,896 billion barrels) and 4 annual production growth rates prior to the production peak (0, 1, 2, and 3 percent). 2. Each scenario addressed the question of when the peak year would occur for a given resource base and production growth rate. 3. A key assumption in estimating the peak production year is the shape of the production curve after the peak is reached (determined by the decline rate). The graph shows what happens if production both grows and declines at a rate of 2 percent per year until the 3,003 billion barrel mean resource estimate is recovered. In this instance, production is projected to peak in It is unlikely that any single constant growth or decline rate would persist before or after the year of peak production. World oil production has sometimes increased very rapidly in the past (e.g., 7.8 percent per year from ), but the recent growth rate has been slightly less than 2 percent. EIA felt that a different decline rate methodology is called for, and the next page illustrates the decline rate that was used in the EIA scenarios. [8/10/2000 4:56:43 PM]

23 Slide 15 of In this graph, the dotted line curve reflects the EIA methodology in which world oil production is assumed to grow at a rate of 2 percent per year until the ratio of reserves to annual production (R/P) declines to 10. (Reserves are computed from resource estimates using an algorithm which factors in annual finding and production rates.) At that point (the peak), world production is assumed to begin to decline in a way that maintains a constant R/P of 10. The global resource base shown is the mean USGS estimate, 3,003 billion barrels. Because the area under each production curve must be the same (equal to total resource base), a later peak results in a steeper decline rate, and vice versa. The estimated peak using this EIA methodology occurs in The reason for setting R/P equal to 10 is based on the United States experience. The United States is a very mature producing country and has had an R/P ratio between 8 and 12 for the past 50 years. The R/P ratio was around 12 in the 1940 s and 1950 s, dropped below 10 in the 1960 s, was around 8 in the1970 s and 1980 s and has been around 10 in the 1990 s. Therefore, a world R/P of 10 seems a reasonable assumption to reflect a mature state of world oil production, as it does for the United States. 3. For reference, the current world R/P ratio is about 50, nowhere near 10 yet. [8/10/2000 4:56:45 PM]

24 Slide 16 of This graph shows the 2 percent production growth rate with the 3 USGS resource levels. 2. Note that the timing of the estimated production peak is relatively insensitive to variations in the resource base estimate. For example, adding 900 billion barrels - more oil than the world has produced to date - to the mean resource estimate on the 2 percent growth path only delays the estimated production peak by 10 years. Similarly, subtracting 850 billion barrels from the mean resource estimate on the 2 percent growth path accelerates the estimated production peak by 11 years. 3. Note that a R/P ratio of 10 does not imply a 10 percent yearly decline rate because there are additions to reserves each year. For example, the initial decline rates after the peak for the low, mean, and high resource levels are 8.3, 7.5, and 6.7 percent per year respectively. These decline rates eventually slow to 6.5, 5, and 4.3 percent per year, respectively. [8/10/2000 4:56:45 PM]

25 Slide 17 of This graph shows the mean resource volume (3,003 billion barrels) with the 3 different production growth rates. 2. A growth rate decrease of 1 percent (from 2 to 1 percent per year) delays the estimated production peak by 13 years. A growth rate increase of 1 percent (from 2 to 3 percent per year) accelerates the peak by 7 years. 3. Thus, EIA s methodology indicates that a decrease of 1 percentage point in the growth rate has roughly the same effect on the estimated peak production year as adding 900 billion barrels to the resource base. 4. The 3 curves in this graph have initial declines after the peak year of 7.5 to 8.4 percent per year, gradually slowing to a decline of about 5 percent per year. 5. Incidentally, when this methodology is used to extend the reference case production curve in the IEO2000 beyond 2020 (1.9 percent per year growth rate, R/P = 10 decline rate), the estimated year of peak production is 2038 for the USGS mean resource level (3,003 billion barrels). [8/10/2000 4:56:46 PM]

26 Slide 18 of Market forces (such as prices for oil, costs of investment, and the pace of technological advance) may smooth and flatten the sharp peaks of the estimated production profiles. This graph shows the effect on the estimated peak production year when the methodology is altered to produce a rounded peak. (The rounded peak was generated by gradually decreasing the production growth rate from 2 percent to zero and then gradually increasing the production decline rate from zero to 5 percent.) 2. The rounded production peak is estimated by assuming that both production curves recover the same volume of conventional oil and both decline at about the same final rate (5 percent per year.) 3. The rounded peak occurs 7 years earlier and at a lower production rate than the sharp peak case. 4. This is generally true - a rounded peak occurs earlier than a sharp peak for the same resource base and yearly production growth rate. [8/10/2000 4:56:47 PM]
27 Long Term World Oil Supply Long Term World Oil Supply (A Resource Base/Production Path Analysis) Next slide Back to first slide View graphic version The following pages summarize a recent EIA presentation on estimates of the world conventional oil resource base and the year when production from it will peak and then begin to decline. A version of this presentation was given by former EIA Administrator Jay Hakes to the April 18, 2000 meeting of the American Association of Petroleum Geologists in New Orleans, Louisiana. Specific information about this presentation may be obtained from John Wood (john.wood@eia.doe.gov), Gary Long (gary.long@eia.doe.gov) or David Morehouse (david.morehouse@eia.doe.gov). [8/10/2000 4:56:48 PM]
Running out of and into oil: Analyzing global oil depletion to 2050
 Running out of and into oil: Analyzing global oil depletion to 2050 David L. Greene The Q Group Spring 2005 Seminar Key Largo, Florida April 4, 2005 Lost our bearings? Oil prices have broken $50 a barrel.
Black Gold: America and Oil 9/23/08 NOTES 9/18/08 POSTED & ASSIGNMENT #4 INTER/EXTRAPOLATION & EXP. GROWTH?
 Black Gold: America and Oil 9/23/08 NOTES 9/18/08 POSTED & ASSIGNMENT #4 INTER/EXTRAPOLATION & EXP. GROWTH? Questions Is America / world running out of oil? Can the US be energy-independent? U.S. Energy
Chapter 6. Depletable Resource Allocation: The Role of Longer Time Horizons, Substitutes, and Extraction Cost
 Chapter 6 Depletable Resource Allocation: The Role of Longer Time Horizons, Substitutes, and Extraction Cost Chapter 6: Depletable Resource Allocation: The Role of Longer Time Horizons, Substitutes, and
Quantum Change: Part Alpha: Comparative Differentials
 Vancouver & Lexington in Relief: SSP Kentucky 2009 2 10 Planning for 8 10 10 10 Quantum Change: Part Alpha: Comparative Differentials Post Oil Reconfiguration of the Pattern of Community. 7 10 Our Point
Accelerated Depletion: Assessing Its Impacts on Domestic Oil and Natural Gas Prices and Production
 SR/OIAF/2000-04 : Assessing Its Impacts on Domestic Oil and Natural Gas Prices and Production July 2000 Energy Information Administration Office of Integrated Analysis and Forecasting U.S. Department of
R. Parthasarathy. University of Oregon
 Physics 161: Physics of Energy and the Environment November 6, 2008 Prof. Raghuveer Parthasarathy raghu@uoregon.edu Lecture 11: Announcements Reading: Wolfson, Chapter 5 Problem Set 5: Due NEXT Thursday,
Jean Laherrere 20 August North America natural gas discovery & production
 Jean Laherrere 20 August 2007 North America natural gas discovery & production -US From USDOE/EIA-0534 1990 "US oil and gas reserves by year of field discovery" up to 1988 and EIA annual reports using
ME 217: Energy, Environment & Society Fall Fossil resources. Mechanical Engineering ME217 Energy, Environment & Society
 ME 217: Energy, Environment & Society Fall 2015 Fossil resources ME217 Energy, Environment & Society Energy flows on Earth solar radiation 174,000 TW direct reflection 52,000 TW evaporation, precipitation
US Oil and Gas Import Dependence: Department of Energy Projections in 2011
 1800 K Street, NW Suite 400 Washington, DC 20006 Phone: 1.202.775.3270 Fax: 1.202.775.3199 Email: acordesman@gmail.com Web: www.csis.org/burke/reports US Oil and Gas Import Dependence: Department of Energy
Kerry Perkinson V.P., Tennessee Bank & Trust Transit Alliance - Board Member
 Kerry Perkinson V.P., Tennessee Bank & Trust Transit Alliance - Board Member How CONFIDENT are you regarding the WORLD OIL PRICE? Did you know there are two BENCHMARK PRICES? West Texas Intermediate $94.07
Oil Panic: The Global Oil Depletion Debate
 Stanford School of Earth Sciences Lecture at the Meeting of the California Independent Petroleum Association Oil Panic: The Global Oil Depletion Debate Saturday, June 4, 2011 Steven Gorelick Stanford University
Shades of Energy Independence
 Shades of Energy Independence Dr. Nansen G. Saleri President & CEO Quantum Reservoir Impact, LLC November 16, 2012 Energy Forum, Massachusetts Institute of Technology NASA s NanoSail-D Source: sciencenews.org
Annual Energy Outlook 2005
 Page 1 of 5 Home >EIA Brochures > Annual Energy Outlook 2005 Annual Energy Outlook 2005 With Projections to 2025 Figure 1. Energy Prices, 1970-2025 (2003 dollars per million Btu) The Annual Energy Outlook
I think there is a world market for maybe 5 computers (Thomas Watson, IBM chairman, 1943) plateau (Irving Fischer, prof of economics, Yale U.
 plateau (Irving Fischer, prof of economics, Yale U.") The Oil Peak syndrom: Facts and Myths Alain Labastie, 2011 President Society of Petroleum Engineers 1 Forecasts by experts or gurus are often unreliable I think there is a world market for maybe 5 computers
The Oil Peak syndrom: Facts and Myths Alain Labastie, 2011 President Society of Petroleum Engineers 1 Forecasts by experts or gurus are often unreliable I think there is a world market for maybe 5 computers
ARTICLE IN PRESS. Energy Policy
 Energy Policy 36 (28) 4149 4153 Contents lists available at Scienceirect Energy Policy journal homepage: www.elsevier.com/locate/enpol Viewpoint China s oil reserve forecast and analysis based on peak
Analysis of Oil and Gas Production in the Arctic National Wildlife Refuge
 SR/OIAF/2004-04 Analysis of Oil and Gas Production in the Arctic National Wildlife Refuge March 2004 Energy Information Administration Office of Integrated Analysis and Forecasting U.S. Department of Energy
ST98: 2018 ALBERTA S ENERGY RESERVES & SUPPLY/DEMAND OUTLOOK. Executive Summary.
 ST98: 2018 ALBERTA S ENERGY RESERVES & SUPPLY/DEMAND OUTLOOK Executive Summary ST98 www.aer.ca EXECUTIVE SUMMARY The Alberta Energy Regulator (AER) ensures the safe, efficient, orderly, and environmentally
ST98: 2018 ALBERTA S ENERGY RESERVES & SUPPLY/DEMAND OUTLOOK. Executive Summary.
 ST98: 2018 ALBERTA S ENERGY RESERVES & SUPPLY/DEMAND OUTLOOK Executive Summary ST98 www.aer.ca EXECUTIVE SUMMARY The Alberta Energy Regulator (AER) ensures the safe, efficient, orderly, and environmentally
The Need for Strong Caveats on Proved Oil Reserves, and on R/P Ratios
 1 Abstract The Need for Strong Caveats on Proved Oil Reserves, and on R/P Ratios R.W. Bentley, Editor The Oil Age. E-mail: r.w.bentley@reading.ac.uk Website: www.theoilage.org Strong caveats are needed
Transportation Energy: Supply, Demand and the Future
 Transportation Energy: Supply, Demand and the Future Edward Beimborn Center for Urban Transportation Studies University of Wisconsin-Milwaukee Presentation to the District IV Conference Institute of Transportation
Natural Gas Abundance: The Development of Shale Resource in North America
 Natural Gas Abundance: The Development of Shale Resource in North America EBA Brown Bag Luncheon Bracewell & Giuliani Washington, D.C. February 6, 2013 Bruce B. Henning Vice President, Energy Regulatory
A Toy Model of Peak Oil
 A Toy Model of Peak Oil Richard Wiener Research Corporation for Science Advancement & UA Dept of Physics UA Low Energy Seminar December 10, 2009 Acknowledgement Professor Daniel Abrams, Applied Math, Northwestern
U.S. Carbon Dioxide Emissions in 2009: A Retrospective Review
 U.S. Carbon Dioxide Emissions in 2009: A Retrospective Review The U.S. Energy Information Administration (EIA) recently expanded its reporting of energyrelated carbon dioxide emissions starting in the
Evidence for Peak Oil
 Evidence for Peak Oil March 2009 Problems Begin Before Peak There is NO Ready Liquid Fuel Substitute! The Gap Begins Here The Gap Begins Here Congressman Roscoe Bartlett www.bartlett.house.gov/energyupdates
Fossil Fuel Resources Chapter 5
 Fossil Fuel Resources Chapter 5 1. Fossil Fuels provide about 2/3 rd of the planet s electricity and about 85% of Earth s total energy production. 2. Not all fossil fuels are the same. a. Availability
ESA-4. Primary Energy Substitution. World Energy Supply (in Gtoe) Determinants 2: Supply. Keywan Riahi World population (billion)
 Determinants 2: Supply. Keywan Riahi World population (billion)") ESA-4 Determinants 2: Supply Keywan Riahi riahi@iiasa.ac.at World Energy Supply (in Gtoe) World population (billion) 1.6 2.5 5.3 Gtoe 8 6 4 2 World primary energy use (Gtoe) Nuclear Hydro Gas Oil (incl.
ESA-4 Determinants 2: Supply Keywan Riahi riahi@iiasa.ac.at World Energy Supply (in Gtoe) World population (billion) 1.6 2.5 5.3 Gtoe 8 6 4 2 World primary energy use (Gtoe) Nuclear Hydro Gas Oil (incl.
Energy Supply Setting
 2002 AAPG Briefing Energy and Environment: A Partnership that Works Energy Supply Setting Pete Stark IHS Energy Group Washington, D.C. 23 September, 2002 Thesis: Public desires secure, reliable, clean,
The Multi-Cycle Generalized Verhulst Model for Making Production Projections for Nonrenewable Resources
 The Multi-Cycle Generalized Verhulst Model for Making Production Projections for Nonrenewable Resources from Past Production Data and Estimates of Ultimately Recoverable Resources Eric Sander, DOE May
WHAT EVER HAPPENED TO PEAK OIL? Benedikt Unger, February 2015
 WHAT EVER HAPPENED TO PEAK OIL? Benedikt Unger, February 2015 WHAT EVER HAPPENED TO PEAK OIL 2 PART 1 OIL FUNDAMENTALS WHAT EVER HAPPENED TO PEAK OIL 3 WHAT ABOUT PEAK OIL? The discussion about oil running
Production: Industry view. World Oil Reserves and. World Oil Reserves and. Kuwait Energy Company. Ray Leonard. ASPO 2007 Cork Ireland
 World Oil Reserves and World Oil Reserves and Production: Industry view ASPO 2007 Cork Ireland Ray Leonard Kuwait Energy Company November 2006 Hedberg Conference November 2006 Hedberg Conference Gathering
Beyond Hubbert: What down slope can we expect? What will the world down-slope of oil production look like?
 Beyond Hubbert: What down slope can we expect? Gail Tverberg 3 rd Biophysical Economics Conference, April 16, 2011 What will the world down-slope of oil production look like? Individual areas often follow
U.S. natural gas prices after the shale boom
 ENERGY ANALYSIS U.S. natural gas prices after the shale boom Kan Chen / Marcial Nava 9 March 218 Shale production fundamentally altered the relationship between oil and natural gas prices Although most
The World Energy Situation after the Peak in Conventional Oil Production has Passed
 The World Energy Situation after the Peak in Conventional Oil Production has Passed John H. Walsh Energy Advisor Published in the Proceedings of the Canadian Association for the Club of Rome, Series 3,
NATURAL GAS RESOURCES: A COMMUNITY DISCUSSION
 NATURAL GAS RESOURCES: A COMMUNITY DISCUSSION Molly May Research Intern, Clean Energy Action August 29, 2016 Boulder Public Library Boulder, Colorado www.cleanenergyaction.org Outline 1. Background What
ENVIRONMENT AND ENERGY BULLETIN
 ENVIRONMENT AND ENERGY BULLETIN Vol. 3 No. 2 June 2011 Editor: Jock A. Finlayson THE NATURAL GAS STORY Both globally and in North America, natural gas is poised to play a bigger role in meeting the energy
Reading 29 The End of Cheap Oil 1
 1 In 1973 and 1979 a pair of sudden price increases rudely awakened the industrial world to its dependence on cheap crude oil. Prices first tripled in response to an Arab embargo and then nearly doubled
A Different Future? Robert J. Finley Illinois State Geological Survey Champaign, Illinois
 Fossil Fuels, Energy Efficiency, and Carbon Emissions: A Different Future? Robert J. Finley Illinois State Geological Survey Champaign, Illinois Governor s Pollution Prevention Awards October 25, 2007
EIA s Energy Outlook Through 2035
 EIA s Energy Outlook Through 235 ReThink Montgomery Speaker Series Energy March 23, 21 Silver Spring, Maryland A. Michael Schaal, Director, Oil and Gas Division Office of Integrated Analysis and Forecasting
UK Oil and Gas Reserves and Resources. As at end 2016
 UK Oil and Gas Reserves and Resources As at end 2016 Contents 1. Executive summary 3 2. UK Reserves and resources 4 3. Oil and gas reserves and contingent resources progression 6 4. Detailed breakout of
Energy. on this world and elsewhere. Instructor: Gordon D. Cates Office: Physics 106a, Phone: (434)
") Energy on this world and elsewhere Instructor: Gordon D. Cates Office: Physics 106a, Phone: (434) 924-4792 email: cates@virginia.edu Course web site available at www.phys.virginia.edu, click on classes
Energy on this world and elsewhere Instructor: Gordon D. Cates Office: Physics 106a, Phone: (434) 924-4792 email: cates@virginia.edu Course web site available at www.phys.virginia.edu, click on classes
AEO2005 Overview. Key Energy Issues to Economic Growth
 Key Energy Issues to 225 The Energy Information Administration (EIA), in preparing model forecasts for its Annual Energy Outlook 25 (AEO25), evaluated a wide range of current trends and issues that could
Overview. Key Energy Issues to Economic Growth
 Key Energy Issues to 225 The Energy Information Administration (EIA), in preparing model forecasts for its Annual Energy Outlook 25 (AEO25), evaluated a wide range of current trends and issues that could
Energy from Fossil Fuels
 Energy from Fossil Fuels Important energy facts Brief history of energy *1700-1800 Fire wood *1900-1920 Coal *1950- now crude oil production of crude oil = withdrawing it from reserves OPEC (organization
L. David Roper 18 December, 2011
 Crude-Oil Extraction in the United States L. David Roper http://arts.bev.net/roperldavid/ 18 December, 2011 Introduction The amount of crude-oil that can be extracted inside the United States is a crucial
Fuels Used in Electricity Generation
 Fuels Used in Electricity Generation for Energy and Climate Change Research Seminar May 17 th, 2012 Washington, DC by, Office of Electricity, Coal, Nuclear and Renewables Analysis Energy Information Administration
Chapter 1: What Is Peak Oil?
 Chapter 1: What Is Peak Oil? In this chapter, we discuss some of the basic issues relating to peak oil and the expected worldwide decline in oil production. 1. What is peak oil? "Peak oil" is the term
DRAFT FOR PUBLIC COMMENT
 Version 13 June 2016 United Nations Economic Commission for Europe Expert Group on Resource Classification DRAFT FOR PUBLIC COMMENT Draft Bridging Document between the Oil and Fuel Gas Reserves and Resources
Why Investors Should Beware Of The Bakken. By Arthur Berman - Mar 01, 2017, 4:27 PM CST
 Why Investors Should Beware Of The Bakken By Arthur Berman - Mar 01, 2017, 4:27 PM CST It s the beginning of the end for the Bakken Shale play. The decline in Bakken oil production that started in January
Oil Quiz: Test Your Knowledge
 Oil Quiz: Test Your Knowledge Quiz: 1. United States oil production has been increasing at about 2% per year since 1960. 2. Saudi Arabia is currently the largest producer of oil in the world. 3. Each country
Chapter 2: Is This a False Alarm?
 Chapter 2: Is This a False Alarm? As we look at the answers to these questions, we will see that the production decline discussed in Chapter 1: What Is Peak Oil? appears to be nearly immediate. Available
World and U.S. Fossil Fuel Supplies
 World and U.S. Fossil Fuel Supplies Daniel O Brien and Mike Woolverton, Extension Agricultural Economists K State Research and Extension Supplies of fossil fuel resources used for energy production vary
The Future of Oil. Max Willis Energy & the Environment 4/5/10
 The Future of Oil Max Willis Energy & the Environment 4/5/10 Darcy s Law Q = discharge A = cross-sectional area μ = viscosity L = length P = pressure κ = permeability Multiphase flow: Relative permeability
FHWA Forecasts of Vehicle Miles Traveled (VMT): May 2014
: May 2014") FHWA Forecasts of Vehicle Miles Traveled (VMT): May 2014 Office of Highway Policy Information Federal Highway Administration May 22, 2014 Highlights Long-Term Economic Outlook Under the IHS Baseline economic
FHWA Forecasts of Vehicle Miles Traveled (VMT): May 2014 Office of Highway Policy Information Federal Highway Administration May 22, 2014 Highlights Long-Term Economic Outlook Under the IHS Baseline economic
European gas demand and import scenarios: can we connect the future to the present?
 European gas demand and import scenarios: can we connect the future to the present? Professor Jonathan Stern, Chairman and Senior Research Fellow OIES Gas Programme GAC Seminar on Scenarios and Forecasts,
COMPARATIVE ANALYSIS OF MONTHLY REPORTS ON THE OIL MARKET
 COMPARATIVE ANALYSIS OF MONTHLY REPORTS ON THE OIL MARKET AN INTERNATIONAL ENERGY FORUM PUBLICATION MAY 2018 RIYADH, SAUDI ARABIA MAY 2018 SUMMARY FINDINGS FROM A COMPARISON OF DATA AND FORECASTS ON THE
The main issues in this book are the climatic consequences of societal energy policies. I
 Chapter 10 Fossil Fuels The main issues in this book are the climatic consequences of societal energy policies. I subscribe to the thesis that the decision about our future energy mix rests at the bottom
The following are exact quotes. Notable highlights are in Bold.
 Highlights from GAO-07-283: CRUDE OIL - Uncertainty about Future Oil Supply Makes It Important to Develop a Strategy for Addressing a Peak and Decline in Oil Production. EMBARGOED UNTIL 11:30 am Eastern
Annual Energy Outlook 2010 Reference Case
 Annual Energy Outlook 21 Reference Case The Paul H. Nitze School of Advanced International Studies December 14, 29 Washington, DC Richard Newell, Administrator Richard Newell, SAIS, December 14, 29 1 How
Winter Fuels Outlook
 Robert Pirog Specialist in Energy Economics December 5, 2017 Congressional Research Service 7-5700 www.crs.gov R45042 Summary The Energy Information Administration (EIA), in its Short-Term Energy and Winter
Drilling Deeper: A Reality Check on U.S. Government Forecasts for a Lasting Tight Oil & Shale Gas Boom. Web Briefing December 9, 2014
 Drilling Deeper: A Reality Check on U.S. Government Forecasts for a Lasting Tight Oil & Shale Gas Boom Web Briefing December 9, 214 J. David Hughes Post Carbon Institute Global Sustainability Research
A Sustainable Energy Future?
 Slide - 1 We should start by asking what we mean by sustainable energy? We need energy sources that won t run out. We need energy sources that won t degrade our planetary environment. Slide - 2 We need
North American Midstream Infrastructure Through 2035 A Secure Energy Future. Press Briefing June 28, 2011
 North American Midstream Infrastructure Through 2035 A Secure Energy Future Press Briefing June 28, 2011 Disclaimer This presentation presents views of ICF International and the INGAA Foundation. The presentation
Update on U.S. Oil and Gas Proved Reserves, Highlighting the Contribution of the Williston Basin
 Update on U.S. Oil and Gas Proved Reserves, Highlighting the Contribution of the Williston Basin Steven G. Grape Energy Information Administration Office of Oil and Gas Reserves & Production Division Dallas,
OECD TASK FORCE ON THE IMPLEMENTATION OF THE SEEA-CF REPORTING OF STOCKS OF NATURAL RESOURCES IN PHYSICAL UNITS
 OECD TASK FORCE ON THE IMPLEMENTATION OF THE SEEA-CF REPORTING OF STOCKS OF NATURAL RESOURCES IN PHYSICAL UNITS 20th Meeting of the London Group on Environmental Accounting New Delhi, October 15-17, 2014
Crude Oil. The main conventional oil source is crude oil. Crude oil is better known as
 Brianna Kasper February 20, 2006 IDS 102 Energy project Crude Oil The main conventional oil source is crude oil. Crude oil is better known as petroleum. According to the Colliers Dictionary, petroleum
A CHALLENGE FOR THE RENEWABLES
 OIL PEAK A CHALLENGE FOR THE RENEWABLES By Emil Bedi and Gunnar B Olesen SECURITY OF POWER SUPPLY The world s energy consumption has never been as huge as it is now. The use of commercial energy now exceeds
Fossil Fuels. years. Marco Antonellini. CIRSA Environmental Sciences JMA JMA
 Fossil Fuels By Marco Antonellini CIRSA Environmental Sciences What are Fossil Fuels? Fossil fuel" is a term for buried combustible geologic deposits of organic materials, formed from decayed plants and
The Commission's Energy Roadmap 2050
 MEMO/11/914 Brussels, 15 December 2011 The Commission's Energy Roadmap 2050 Why is there a need for the Roadmap 2050? The EU has set itself the goal to reduce greenhouse gas emissions to 80%-95% below
Global Energy Trends and Where Alaska Fits
 Global Energy Trends and Where Alaska Fits for 39 th Annual Alaska Resource Conference November 14, 218 Anchorage, AK by Dr. Ian Mead, Assistant Administrator for Energy Analysis U.S. Energy Information
M. KING HUBBERT CENTER FOR PETROLEUM SUPPLY STUDIES
 HUBBERT CENTER NEWSLETTER # 2002/2 M. KING HUBBERT CENTER FOR PETROLEUM SUPPLY STUDIES M. KING HUBBERT CENTER Petroleum Engineering Department COLORADO SCHOOL OF MINES GOLDEN CO 80401-1887 CANADA S FUTURE
Introduction. Chapter 1. Effects on the Oil Industry. The Origins of Today s Low Oil Prices
 Chapter 1 Introduction The Origins of Today s Low Oil Prices In December 1985, the Kingdom of Saudi Arabia reversed its oil market strategy. During the first half of the 1980s it had been serving as the
How the Shale Boom Has Transformed the US Oil
 How the Shale Boom Has Transformed the US Oil and Gas Industry Richard G. Newell and Brian C. Prest* Introduction The United States has experienced dramatic increases in oil and natural gas production
Peak Oil Theory. Leah Fusco
 Peak Oil Theory Leah Fusco Introduction When oil was first discovered in 1859 it had few uses. As time progressed, it became more and more integrated into society; society became increasingly restructured
Irish Renewable Energy Policy
 The Foundation for the Economics of Sustainability 19 Lower Rathmines Road, Dublin 6. Republic of Ireland. Tel: 33 ()1 4912773 Fax: 33 ()1 491223 E-mail: feasta@anu.ie Web: www.feasta.org March, 24. Irish
U.S. Crude Oil and Natural Gas Proved Reserves, Year-end 2016
 U.S. Crude Oil and Natural Gas Proved Reserves, Year-end 2016 February 2018 Independent Statistics & Analysis www.eia.gov U.S. Department of Energy Washington, DC 20585 This report was prepared by the
Shale Gas. A Game Changer for U.S. and Global Gas Markets? Flame European Gas Conference March 2, 2010, Amsterdam. Richard G. Newell, Administrator
 Shale Gas A Game Changer for U.S. and Global Gas Markets? Flame European Gas Conference March 2, 2010, Amsterdam Richard G. Newell, Administrator Richard Newell, March SAIS, December 2, 2010 14, 2009 1
EXECUTIVE SUMMARY CONTEXT: HISTORY AND FORECASTS METRICS: SIZE, RATE OF SUPPLY, AND NET ENERGY
 EXECUTI VE SUMMARY QDWXUDOð BY J.DAVI D HUGHES FEB 201 3 POST CARBON I NSTI TUTE World energy consumption has more than doubled since the energy crises of the 1970s, and more than 80 percent of this is
Highlights. Figure 1. World Marketed Energy Consumption by Region,
 Highlights World energy consumption is projected to increase by 71 percent from 3 to 23. Fossil fuels continue to supply much of the energy used worldwide, and oil remains the dominant energy source. In
A Decade of Progress in Unconventional Gas
 A Decade of Progress in Unconventional Gas Vello A. Kuuskraa, Advanced Resources International, Arlington, VA Unconventional gas resources - - tight gas sands, coalbed methane and gas shales - - have become
Incorporating Numerical Simulation Into Your Reserves Estimation Process: A Practical Perspective
 Incorporating Numerical Simulation Into Your Reserves Estimation Process: A Practical Perspective Dean C. Rietz, P. E. October 4, 2017 Society of Petroleum Engineers Distinguished Lecturer Program www.spe.org/dl
Bridging Document. between. the Oil and Fuel Gas Reserves and Resources Classification of the Russian Federation of and
 Bridging Document between the Oil and Fuel Gas Reserves and Resources Classification of the Russian Federation of 2013 and the United Nations Framework Classification for Fossil Energy and Mineral Reserves
Outlook for Oil and Gas and Implications for Biomass
 Outlook for Oil and Gas and Implications for Biomass John P. Martin, Ph.D. New York State Energy Research and Development Authority February 17, 2010 Misc. Pictures Here Energy Choices 21 st Century Energy
11/18/2011. Moderate demand increase High depletion rate. Alfa Laval 1. Sammy Hulpiau Segment Manager Energy & Environment. mb/d.
 Oil & Gas Sammy Hulpiau Segment Manager Energy & Environment Oil production investments are rapidly growing mb/d 120 100 80 60 NGLs Unconventional oil Crude oil fields yet to be developed or found Crude
The SPE Foundation through member donations and a contribution from Offshore Europe
 Primary funding is provided by The SPE Foundation through member donations and a contribution from Offshore Europe The Society is grateful to those companies that allow their professionals to serve as
GDP EFFECTS OF AN ENERGY PRICE SHOCK
 Chapter Six GDP EFFECTS OF AN ENERGY PRICE SHOCK This chapter attempts to derive rough estimates of the adverse effects on Chinese GDP growth attendant upon an energy price shock, defined as a substantial
The US shale revolution and its economic impact
 The US shale revolution and its economic impact Sylvie Cornot-Gandolphe Groupe Idées, Rueil Malmaison, 16 mars 2015 1 The US shale revolution and its economic impact 1. Shale gas Coal-to-gas switching
2* World Oil Resources. an estimate of the amount of oil reserves that can be proved from the known
 2* World Oil Resources A. Reserves One method for determining HOW much oil is there? t is to respond with an estimate of the amount of oil reserves that can be proved from the known oil in place. Unfortunately,
Federal Outer Continental Shelf Oil and Gas Overview From the Eastern Gulf of Mexico Perspective
 Federal Outer Continental Shelf Oil and Gas Overview From the Eastern Gulf of Mexico Perspective John Rodi Deputy Regional Director U.S. Minerals Management Service (MMS) Gulf of Mexico Region Presented
Oil Shale and Global Energy Needs
 Oil Shale and Global Energy Needs 28 th Oil Shale Symposium Colorado School of Mines October 13, 28 Ray Charles Area Manager, USA & Mexico ExxonMobil Exploration Company This presentation includes forward-looking
Evaluation of Crude Oil Production Forecast Studies Using Statistical Analysis
 Evaluation of Crude Oil Production Forecast Studies Using Statistical Analysis * Shinichirou MorimotoMasanari Koike Mogi Gento 2008 3 3 2008 6 13 Various evaluations have performed on oil peak forecasting,
WESTERN STATES PETROLEUM ASSOCIATION. Price at the Fuel Pump Facts and Myths
 Price at the Fuel Pump Facts and Myths Legislative Energy Horizon Institute Catherine Reheis-Boyd July 20, 2011 The energy conversation It s complex, it s crucial, it s interconnected 2 Myth: The world
Energy Markets. U.S. Energy Information Administration. for. October 29, 2015 Golden, Colorado. by Adam Sieminski, Administrator
 Energy Markets for The Payne Institute for Earth Resources at the Colorado School of Mines Golden, Colorado by Adam Sieminski, Administrator U.S. Energy Information Administration U.S. Energy Information
PROBABILISTIC ESTIMATION OF POTENTIAL GAS RESERVES FOR THE EMERGING NIGERIAN GAS MARKET
 PROBABILISTIC ESTIMATION OF POTENTIAL GAS RESERVES FOR THE EMERGING NIGERIAN GAS MARKET Lateef Akinpelu and Yetunde Omotosho The University of Ibadan, Ibadan, Nigeria ABSTRACT: Proved reserves for the
H.C. DEDICATION NEWSLETTER
 H.C. DEDICATION NEWSLETTER The M. KING HUBBERT CENTER FOR PETROLEUM SUPPLY STUDIES located in the Department of Petroleum Engineering Colorado School of Mines Golden, Colorado The Hubbert Center has been
U.S. Crude Oil and Natural Gas Proved Reserves, Year-end 2015
 U.S. Crude Oil and Natural Gas Proved Reserves, Year-end 2015 December 2016 Independent Statistics & Analysis www.eia.gov U.S. Department of Energy Washington, DC 20585 This report was prepared by the
Peak Oil: A Detailed and Transparent Analysis
 Peak Oil: A Detailed and Transparent Analysis Phil Hart & Chris Skrebowski Industry professionals and studious observers, through the Association for the Study of Peak Oil (ASPO) and other networks, have
Professor Wumi Iledare, Ph.D. Senior Fellow, U.S. Association for Energy Economics Associate Editor, SPE Economics & Management Journal Professor,
 Global Petroleum Supply and Pricing: Is the World Really Running Out of Oil? Professor Wumi Iledare, Ph.D. Senior Fellow, U.S. Association for Energy Economics Associate Editor, SPE Economics & Management
The Future of Oil. It s a Fossil-Fueled World
 The Future of Oil Roland N. Horne Energy Resources Engineering Stanford University 1 It s a Fossil-Fueled World 6% 6% 29% 35% Oil Natural Gas Coal Nuclear Hydroelectric 24% BP Statistical Review 2008 2
Standardization of the Evaluation Criteria on Petroleum Resources
 Standardization of the Evaluation Criteria on Petroleum Resources Standardization of Korean Petroleum Resources Classification and Definition (Unofficial Report) Contents I. Introduction 1. Significance
U.S. Crude Oil, Natural Gas, and NG Liquids Proved Reserves
 1 of 5 3/14/2013 11:37 PM U.S. Crude Oil, Natural Gas, and NG Liquids Proved Reserves With Data for Release Date: August 1, 2012 Next Release Date: March 2013 Previous Issues: Year: Summary Proved reserves