RFT Annual Conference Florida Solid Waste Management: State of the State June 12 st, 2017 Tim Townsend, Steve Laux, Malak Anshassi, Matthew Morse
|
|
|
- Rafe Morrison
- 6 years ago
- Views:
Transcription


1 RFT Annual Conference Florida Solid Waste Management: State of the State June 12 st, 2017 Tim Townsend, Steve Laux, Malak Anshassi, Matthew Morse Department of Environmental Engineering Sciences Engineering School for Sustainable Infrastructure and Environment University of Florida 1
2 Motivation Hinkley Center Research Project Florida Solid Waste Management: State of the State Motivated by numerous questions on HC 2016 research agenda regarding waste technologies, feasibility, economics, life cycle assessment, and future options for solid waste management in Florida. Additional support: Alachua, Escambia, Palm Beach, Polk and Sarasota Counties 2
3 Presentation Agenda Historic and Current Recycling Rates in Florida; Challenges with Getting to 75% SMM Fundamentals and the Use of SMM tools in Setting Materials Management Priorities Approaches for Using SMM Tools in Conjunction with (or as an alternative to) the 75% Recycling Goal Future Directions 3
4 Management and Disposition of Waste Total tons of MSW generated in Florida in million tons combusted Traditional Recycling Rate: 42% million tons traditionally recycled million tons landfilled 32.5 Million tons 4
5 Management and Disposition of Waste Total Recycling Rate: 54% Total tons of MSW generated in Florida in million tons total recycled 718,977 million tons combusted million tons landfilled 32.5 Million tons 5
6 Recycling Rate Florida Historic Recycling Rates 60% Solid Waste Management Act (SWMA) 50% 40% 30% 20% 10% 0% Traditional Recycling Rate Total Recycling Rate 6
7 Recycling Rate Florida Historic Recycling Rates Changes in how C&D is counted toward recycling 60% 50% 40% 30% 20% 10% 0% Traditional Recycling Rate Total Recycling Rate 7
8 Recycling Rate 60% Florida Historic Recycling Rates 2008 House Bill % goal 50% 40% 30% 20% 10% 0% Traditional Recycling Rate Total Recycling Rate 8
9 Recycling Rate 60% Florida Historic Recycling Rates 2010 House Bill 7242 and FDEP Report to Legislature 50% 40% 30% 20% 10% 0% Traditional Recycling Rate Total Recycling Rate 9
10 Recycling Rate 60% Florida Historic Recycling Rates 2012 House Bill % 40% 30% 20% 10% 0% Traditional Recycling Rate Total Recycling Rate 10
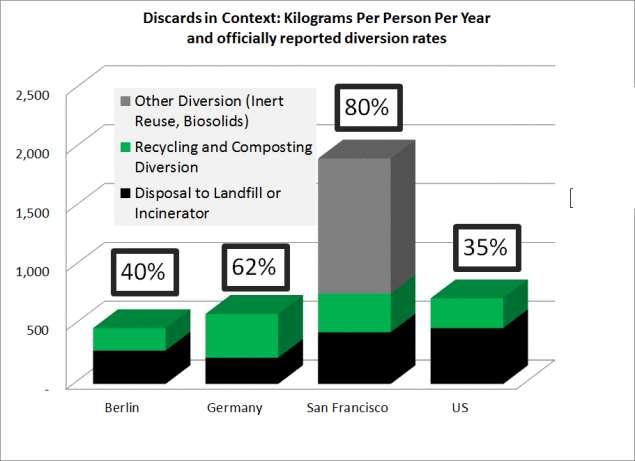
11 Recycling Rates Across the US Location Recycling Rate Comment San Francisco, CA 80% Los Angeles, CA 76% Portland, OR 70% San Antonio, TX 29% NYC, NY 19% Atlanta, GA 12.5% Zero Waste Policies, ban on disposable plastic bas, mandatory recycling and composting Planning and implementation of programs to achieve the 2025 zero waste to landfill goal Aggressive recycling and waste diversion program that requires more labor which increases the cost per ton of collecting MSW Pilot Program for organic waste that focuses on composting Low rate due to inefficiencies related to the performance of private companies New residential recycling programs, Cartlanta Program Chicago, IL 9% Lack of recycling interest and public participation 11
12
13 Let s look more closely at the recycling rate of different waste sources in Florida 13
14 The Four Categories 1. Residential MSW* 2. Non-residential MSW* 3. C&D Debris 4. Yard Trash *Not including yard trash or C&D debris. 14
15 State of Florida Total Waste Generation by Category Categorizing the total 32.5 million tons of collected MSW into the four categories 3.81 million tons yard trash million tons residential 8.95 million tons non-residential 9.64 million tons C&D Debris 32.5 Million tons 15
16 Recycling Rate Recycling Rates by Category 80% 70% 60% 50% 40% 30% 20% 10% 0% Residential Non-Residential C&D Debris Yard Trash Category Traditional Recycling Total Recycling 16
17 Large Counties 2015 Recycling Rate 0% 10% 20% 30% 40% 50% 60% 70% 80% 90% 100% Pinellas Palm Beach Hillsborough Lee Pasco Sarasota Collier Alachua Charlotte Brevard Martin Marion St. Lucie Broward Leon Orange Citrus Manatee Duval Miami-Dade Escambia Bay Seminole Volusia Hernando Santa Rosa Indian River Lake Okaloosa Highlands St Johns Clay Polk Sumter Osceola Flagler 17 Traditional Recycling Rate Total Recyling Rate
18 Small Counties 2015 Recycling Rate 0% 10% 20% 30% 40% 50% 60% 70% 80% 90% 100% Monroe Hendry Madison Putnam Hamilton Bradford Suwannee Columbia Nassau Holmes Franklin Union Taylor Gulf Jackson Wakulla Lafayette Baker Hardee Washington Okeechobee Levy DeSoto Jefferson Gadsden Calhoun Walton Liberty Gilchrist Dixie Glades Traditional Recycling Rate Total Recyling Rate 18
19 Large Counties Recycling Rate 0% 10% 20% 30% 40% 50% 60% 70% 80% 90% 100% Pinellas Palm Beach Hillsborough Lee Pasco Sarasota Collier Alachua Charlotte Brevard Martin Marion St. Lucie Broward Leon Orange Citrus Manatee Duval Miami-Dade Escambia Bay Seminole Volusia Hernando Santa Rosa Indian River Lake Okaloosa Highlands St Johns Clay Polk Sumter Osceola Flagler Traditional Recycling Rate Total Recyling Rate 19
20 Large Counties Recycling Rate 0% 10% 20% 30% 40% 50% 60% 70% 80% 90% 100% Pinellas Palm Beach Hillsborough Lee Pasco Sarasota Collier Alachua Charlotte Brevard Martin Marion St. Lucie Broward Leon Orange Citrus Manatee Duval Miami-Dade Escambia Bay Seminole Volusia Hernando Santa Rosa Indian River Lake Okaloosa Highlands St Johns Clay Polk Sumter Osceola Flagler Traditional Recycling Rate Total Recyling Rate 20
21 Large Counties Recycling Rate 0% 10% 20% 30% 40% 50% 60% 70% 80% 90% 100% Pinellas Palm Beach Hillsborough Lee Pasco Sarasota Collier Alachua Charlotte Brevard Martin Marion St. Lucie Broward Leon Orange Citrus Manatee Duval Miami-Dade Escambia Bay Seminole Volusia Hernando Santa Rosa Indian River Lake Okaloosa Highlands St Johns Clay Polk Sumter Osceola Flagler 0% 20% 40% 60% 80% 100% Pinellas Palm Beach Hillsborough Lee Pasco Sarasota Collier Alachua Charlotte Brevard Martin Traditional Recycling Rate Total Recyling Rate 21
22 Large Counties Recycling Rate 0% 10% 20% 30% 40% 50% 60% 70% 80% 90% 100% Pinellas Palm Beach Hillsborough Lee Pasco Sarasota Collier Alachua Charlotte Brevard Martin Marion St. Lucie Broward Leon Orange Citrus Manatee Duval Miami-Dade Escambia Bay Seminole Volusia Hernando Santa Rosa Indian River Lake Okaloosa Highlands St Johns Clay Polk Sumter Osceola Flagler 0% 20% 40% 60% 80% 100% Pinellas Palm Beach Hillsborough Lee Pasco Sarasota Collier Alachua Charlotte Brevard Martin Traditional Recycling Rate Total Recyling Rate 22
23 Large Counties Recycling Rate 0% 10% 20% 30% 40% 50% 60% 70% 80% 90% 100% Pinellas Palm Beach Hillsborough Lee Pasco Sarasota Collier Alachua Charlotte Brevard Martin Marion St. Lucie Broward Leon Orange Citrus Manatee Duval Miami-Dade Escambia Bay Seminole Volusia Hernando Santa Rosa Indian River Lake Okaloosa Highlands St Johns Clay Polk Sumter Osceola Flagler 0% 20% 40% 60% 80% 100% Pinellas Palm Beach Hillsborough Lee Pasco Sarasota Collier Alachua Charlotte Brevard Martin Traditional Recycling Rate Total Recyling Rate 23


24 Lee County Recycling Rate Breakdown 0% 20% 40% 60% 80% 100% Lee Combusted 33% Recycled 46% Landfilled 21% 24

25 Lee County Recycling Rate Breakdown 0% 20% 40% 60% 80% 100% Lee 1% 15% 6% 9% 4% 2% 5% 7% 3% <1% 1% <1% 6% 6% 1% 2% 1% 1% Newspaper Glass Aluminum Cans Plastic Bottles Steel Cans Corrugated Paper Office Paper Other Plastics Ferrous Metals White Goods Non Ferrous Metal Other Paper Textiles Food Miscellaneous Tires C&D Debris Yard Trash 25


26 Lee County Recycling Rate Breakdown 0% 20% 40% 60% 80% 100% Lee 20% 38% <1% 1% 4% <1% 4% 9% 1% <1% 12% 4% 2% 2% 1% <1% <1% 1% Newspaper Glass Aluminum Cans Plastic Bottles Steel Cans Corrugated Paper Office Paper Other Plastics Ferrous Metals White Goods Non Ferrous Metal Other Paper Textiles Food Miscellaneous Tires C&D Debris Yard Trash 26
27 Lee County Recycling Rate Breakdown 0% 20% 40% 60% 80% 100% Lee 100% 90% 80% 70% 60% 50% 40% 30% 20% 10% 0% Residential Non-Residential Yard Trash C&D Debris Recycled Landfilled Combusted 27
28 Lee County Recycling Rate Breakdown 0% 20% 40% 60% 80% 100% Lee C&D Debris Yard Trash Non-Residential Residential 0% 20% 40% 60% 80% 100% Recycling Rate 28
29 Large Counties Recycling Rate 0% 10% 20% 30% 40% 50% 60% 70% 80% 90% 100% Pinellas Palm Beach Hillsborough Lee Pasco Sarasota Collier Alachua Charlotte Brevard Martin Marion St. Lucie Broward Leon Orange Citrus Manatee Duval Miami-Dade Escambia Bay Seminole Volusia Hernando Santa Rosa Indian River Lake Okaloosa Highlands St Johns Clay Polk Sumter Osceola Flagler 0% 20% 40% 60% 80% 100% Pinellas Palm Beach Hillsborough Lee Pasco Sarasota Collier Alachua Charlotte Brevard Martin Traditional Recycling Rate Total Recyling Rate 29

30 Charlotte County Recycling Rate Breakdown 0% 20% 40% 60% 80% 100% Charlotte Landfilled 41% Recycled 59% 30

31 Charlotte County Recycling Rate Breakdown 0% 20% 40% 60% 80% 100% Charlotte <1% 2% 1% 1% 1% 3% <1% 51% 14% 3% 3% <1% 4% 1% 3% 12% <1% <1% Newspaper Glass Aluminum Cans Plastic Bottles Steel Cans Corrugated Paper Office Paper Other Plastics Ferrous Metals White Goods Non Ferrous Metal Other Paper Textiles Food Miscellaneous Tires C&D Debris Yard Trash 31


32 Charlotte County Recycling Rate Breakdown 0% 20% 40% 60% 80% 100% Charlotte 24% 2% <1% <1% <1% <1% <1% 3% 1% 0% 5% <1% 5% 1% 1% <1% 58% <1% Newspaper Glass Aluminum Cans Plastic Bottles Steel Cans Corrugated Paper Office Paper Other Plastics Ferrous Metals White Goods Non Ferrous Metal Other Paper Textiles Food Miscellaneous Tires C&D Debris Yard Trash 32
33 Charlotte County Recycling Rate Breakdown 0% 20% 40% 60% 80% 100% Charlotte 100% 90% 80% 70% 60% 50% 40% 30% 20% 10% 0% Residential Non-Residential Yard Trash C&D Debris Recycled Landfilled Combusted 33
34 Charlotte County Recycling Rate Breakdown 0% 20% 40% 60% 80% 100% Charlotte C&D Debris Yard Trash Non-Residential Residential 0% 20% 40% 60% 80% 100% Recycling Rate 34


35 Getting to 75% 2/10/
36 Traditional Adjusted % Traditional 54% Adjusted 2/10/
37 Traditional Adjusted Constructed and operated WTE facilities in Orange and Duval Counties 42% Traditional 59% Adjusted 2/10/
38 Traditional Adjusted Established a Bottle Bill and Recycled 80% of Glass, Aluminum Cans, and Plastic Bottles 44.9% Traditional 56.6% Adjusted 2/10/
39 Traditional Adjusted Recycled 80% of Glass, Aluminum Cans, Plastic Bottles, Newspaper, Cardboard and Office Paper 51.4% Traditional 63.0% Adjusted 2/10/
40 Traditional Adjusted Food Waste Recycling (composting) to 80% 47.0% Traditional 57.7% Adjusted 2/10/

41 Traditional Adjusted Recycle 80% of C&D and Yard Trash 52.4% Traditional 64.1% Adjusted 2/10/

42 Traditional Adjusted Recycle 80% of Glass, Aluminum Cans, Plastic Bottles, Newspaper, Cardboard, Office Paper, Yard Trash, C&D and Food Waste 66.0% Traditional 76.7% Adjusted 2/10/
43 The Challenge with Recycling Rates Recycling Rate = Waste Recycled Waste Recycled+Waste Disposed Doesn t track efforts in reduction All materials are treated equal All recycling is treated equal 43
44 The Challenge with Recycling Rates Consider this, A company currently has a heavy emphasis on recycling office paper: Recycling Rate: 40% Recycled Landfilled Recycled 44
45 The Challenge with Recycling Rates Doesn t track efforts in reduction Company institutes a double-sided printing policy Recycled Landfilled Recycled 45
46 The Challenge with Recycling Rates Doesn t track efforts in reduction Recycling Rate: 40% Recycling Rate: 35% Recycled Source Reduction Landfilled Recycled 46
47 Sustainable Materials Management 47

48 Sustainable Materials Management SMM is a systemic approach to using and reusing materials more productively over their entire life cycles. It represents a change in how our society thinks about the use of natural resources and environmental protection. By looking at a product's entire lifecycle we can find new opportunities to reduce environmental impacts, conserve resources, and reduce costs. 48
49
50
51 Tracking Life Cycle Impacts of Alternative Solid Waste Management Strategies Instead of looking at the % of material s mass recycled, why not look at the environmental burden associated with its waste management. Environmental burden categories: Global warming Energy consumption/production Toxicity Acidification Eutrophication Ozone depletion Water consumption SMM tools Open LCA Municipal Solid Waste Decision Support Tool (MSW DST) Waste Reduction Model (WARM) Waste and Resources Assessment Tool for the Environment (WRATE; UK) 51
52 EPA WARM Model 2/10/
 CO 2 CH")
53 Waste and Climate Change The relationship of waste management to climate change Waste management alternatives Source reduction Recycling Biological treatment Thermal treatment Land disposal Assessment tools Potential for outcomes Greenhouse Gases (GHG) CO 2 CH 4 N 2 O
 MTCO 2 E Ton Waste Mass of")
54 GHG Emission Factors Net CO 2, CH 4, N 2 O, Metric Tons of CO 2 Equivalents (MTCO 2 E) MTCO 2 E Ton Waste Mass of Waste
")
55 WARM GHG Emission Factors for Recycling Aluminum Cans Cardboard Newspaper Computer Steel Cans PET Plastic HDPE Plastic Glass Asphalt Shingle Drywall GHG Emissions (MTCO2E/ton) -10
56 Comparison of PET Plastic and Office Paper GHG Emissions (MTCO2E/ton) PET OP

57 Food Waste GHG Emissions (MTCO2E/ton) Landfilling Combustion Composting

58 Landfill Gas Management Choice GHG Emissions (MTCO2E/ton) No recovery Flare Energy Recovery
 to assess which approach provides the overall lower environmental burden.")
59 Opportunities to Apply SMM Tools and Principles to Waste Management Decision Making A state or community could use a life cycle model to evaluate priorities for developing regulations or policies Compare different scenarios (e.g., waste to energy versus SSO) to assess which approach provides the overall lower environmental burden. 59
60 Sarasota County Case Study Town of Long Boat Key City of Sarasota City of Venice City of North Port 60
61 2015 Collection Solid Waste Composition 50% 5% 4% 5% 5% <1% 3% 2% <1% 1% 1% 4% 1% <1% 4% 5% 1% 9% Food Miscellaneous Tires Newspaper Glass Aluminum Cans Plastic Bottles Steel Cans Corrugated Paper Office Paper Yard Trash Other Plastics Ferrous Metals White Goods Non Ferrous Metal Other Paper Textiles C&D Debris 61

62 2015 Solid Waste Disposition Landfilled 41% Recycled (Traditional Rate) 59% 62
63 2015 Sarasota County Total Waste Generation Standard Recycling Rate: 56% Traditional Recycling Rate: 59% Total Recycling Rate: 63% 497,493 tons sent to recycling 520,178 tons sent to recycling 549,041 tons sent to recycling 385,013 tons sent to landfilling 362,328 tons sent to landfilling 333,465 tons sent to landfilling 882,506 tons 882,506 tons 882,506 tons 63
64 Thousand MTCO2E 2015 WARM MTCO2E Savings Material Thousand MTCO2E C&D Debris -234 Ferrous Metals -121 Corrugated Paper Newspaper White Goods Non Ferrous Metal Yard Trash Aluminum Cans Textiles Plastic Bottles Glass Other Paper Steel Cans Other Plastic Tires Office Paper 14.5 Miscellaneous 14.8 Food
65 Thousand mmbtu 2015 WARM Energy Savings Material Thousand mmbtu Ferrous Metals Corrugated Paper -402 White Goods -348 Newspaper -315 Non Ferrous Metal -273 Plastic Bottles -141 Aluminum Cans -136 Other Plastic Textiles Other Paper Steel Cans Glass Office Paper Tires Miscellaneous Food 1.80 Yard Trash 39.1 C&D Debris ,000-1,500-2,000 65
66 Thousand MTCO2E 2015 WARM MTCO2E Scenarios -500 Baseline Scenario 1 Scenario 2 Scenario 3 Scenario Baseline: The carbon dioxide emissions for Sarasota County solid waste management in
67 Thousand MTCO2E 2015 WARM MTCO2E Scenarios -500 Baseline Scenario 1 Scenario 2 Scenario 3 Scenario Scenario 1: WTE facility combusts all waste that is not recycled
68 Thousand MTCO2E 2015 WARM MTCO2E Scenarios -500 Baseline Scenario 1 Scenario 2 Scenario 3 Scenario Scenario 2: All commercial food waste is composted
69 Thousand MTCO2E 2015 WARM MTCO2E Scenarios -500 Baseline Scenario 1 Scenario 2 Scenario 3 Scenario Scenario 3: All commercial food waste is anaerobically digested
70 Thousand MTCO2E 2015 WARM MTCO2E Scenarios -500 Baseline Scenario 1 Scenario 2 Scenario 3 Scenario Scenario 4: All commercial office paper or other paper is recycled 70
71 Thousand mmbtu 2015 WARM Energy Savings Scenarios Baseline Scenario 1 Scenario 2 Scenario 3 Scenario Baseline: The energy expenditure for Sarasota County solid waste in
72 Thousand mmbtu 2015 WARM Energy Savings Scenarios Baseline Scenario 1 Scenario 2 Scenario 3 Scenario Scenario 1: WTE facility combusts all waste that is not recycled
73 Thousand mmbtu 2015 WARM Energy Savings Scenarios Baseline Scenario 1 Scenario 2 Scenario 3 Scenario Scenario 2: All commercial food waste is composted
74 Thousand mmbtu 2015 WARM Energy Savings Scenarios Baseline Scenario 1 Scenario 2 Scenario 3 Scenario Scenario 3: All commercial food waste is anaerobically digested
75 Thousand mmbtu 2015 WARM Energy Savings Scenarios Baseline Scenario 1 Scenario 2 Scenario 3 Scenario Scenario 4: All commercial office paper or other paper is recycled
76 How can SMM be utilized in a similar manner as the 75% goal? With the SMM tools discussed, we can model the environmental burden (e.g., carbon footprint) associated for a solid waste management for the State or for an individual municipality. Or we can compare different solid waste management systems? But to track progress over time, what do you compare the environmental burden to? One possible approach, is to compare to a baseline environmental burden. 76
77 Developing a Baseline for Florida Let s consider the following: The Statute with Florida 75% recycling goal was issued in Let s use 2008 as our baseline. Traditional Recycling Rate = 28.4% Adjusted Recycling Rate = 41.5% MTCO2E Emissions = million MTCO2E Energy usage = -147 million mmbtu 77
78 Developing a Baseline for Florida Let s consider the following: The Statute with Florida 75% recycling goal was issued in Let s use 2008 as our baseline. Traditional Recycling Rate = 28.4% Adjusted Recycling Rate = 41.5% MTCO2E Emissions = million MTCO2E Energy usage = -147 million mmbtu We developed a hypothetical waste management profile that would have corresponded to a 75% recycling in 2008 (included some additional WTE). Traditional Recycling Rate = 59.6% Adjusted Recycling Rate = 75.3% MTCO2E Emissions = million MTCO2E Energy usage = -275 million mmbtu Our Target 78
79 % Traditional 54% Adjusted Target = -26 million MTCO2E 79
80 Constructed and operated WTE facilities in Orange and Duval Counties 42% Traditional 59% Adjusted Target = -26 million MTCO2E 80
81 Established a Bottle Bill and Recycled 80% of Glass, Aluminum Cans, and Plastic Bottles 44.9% Traditional 56.6% Adjusted Target = -26 million MTCO2E 81
82 Recycle 80% of Glass, Aluminum Cans, Plastic Bottles, Newspaper, Cardboard and Office Paper 51.4% Traditional 63.0% Adjusted Target = -26 million MTCO2E 82
83 Food Waste Recycling (composting) to 80% 47.0% Traditional 57.7% Adjusted Target = -26 million MTCO2E 83
84 Recycle 80% of C&D and Yard Trash 52.4% Traditional 64.1% Adjusted Target = -26 million MTCO2E 84
85 Target = -26 million MTCO2E Recycle 80% of Glass, Aluminum Cans, Plastic Bottles, Newspaper, Cardboard, Office Paper, Yard Trash, C&D and Food Waste 66.0% Traditional 76.7% Adjusted 85
86 % Traditional 54% Adjusted Target = -275 million mmbtu 86
87 Constructed and operated WTE facilities in Orange and Duval Counties 42% Traditional 59% Adjusted Target = -275 million mmbtu 87
88 Established a Bottle Bill and Recycled 80% of Glass, Aluminum Cans, and Plastic Bottles 44.9% Traditional 56.6% Adjusted Target = -275 million mmbtu 88
89 Recycle 80% of Glass, Aluminum Cans, Plastic Bottles, Newspaper, Cardboard and Office Paper 51.4% Traditional 63.0% Adjusted Target = -275 million mmbtu 89
90 Food Waste Recycling (composting) to 80% 47.0% Traditional 57.7% Adjusted Target = -275 million mmbtu 90
91 Recycle 80% of C&D and Yard Trash 52.4% Traditional 64.1% Adjusted Target = -275 million mmbtu 91

92 Recycle 80% of Glass, Aluminum Cans, Plastic Bottles, Newspaper, Cardboard, Office Paper, Yard Trash, C&D and Food Waste 66.0% Traditional 76.7% Adjusted Target = -275 million mmbtu 92
93 Lessons Learned With respect to two environmental burden categories (GHG emissions, energy), different recycling approaches result in different progress toward the goal. The materials targeted play a major role. The selection of a baseline is critical. Aluminum Cans Cardboard Newspaper Computer Steel Cans PET Plastic HDPE Plastic Glass Asphalt Shingle Drywall GHG Emissions (MTCO2E/ton) 93
94 Refined Approach Lets assume a hypothetical waste management profile in 2008, Baseline 2, that follows: Combusted, 25% Recycled, 50% Landfilled, 25% 94
95 Refined Approach The Baseline 2 outputs: Traditional Recycling Rate = 52% Adjusted Recycling Rate = 77% MTCO2E Emissions = million MTCO2E Energy usage = -272 million mmbtu Our Target To make it easier to compare, we will normalize the GHG and energy burdens to an equivalent progress toward a recycling goal. 95
96 Applying SMM for Florida SWM in 2020 Progress Towards Baseline 2 0% 20% 40% 60% 80% 100% 120% Expand WTE SMM Scenario A SMM Scenario B Duval, Brevard, Polk, Volusia, and Orange county divert a third of their total collected MSW into WTE. SMM Scenario C SMM Scenario D 2015 Portfolio Baseline 2 Metric Recycling Rate (With WTE) GHG Savings Energy Savings 96
97 Applying SMM for Florida SWM in 2020 Progress Towards Baseline 2 0% 20% 40% 60% 80% 100% 120% Expand WTE SMM Scenario A Enhance Recycling SMM Scenario B SMM Scenario C 75% recycling of residential curbside materials for newspaper, glass, aluminum cans, plastic bottles, steel cans, corrugated paper, and office paper. SMM Scenario D 2015 Portfolio Baseline 2 Metric Recycling Rate (With WTE) GHG Savings Energy Savings 97
98 Applying SMM for Florida SWM in 2020 Progress Towards Baseline 2 0% 20% 40% 60% 80% 100% 120% Expand WTE SMM Scenario A Enhance Recycling SMM Scenario B SSO SMM Scenario C SMM Scenario D Organics recycling program will increase the Florida s food recycling rate to become 75% 2015 Portfolio Baseline 2 Metric Recycling Rate (With WTE) GHG Savings Energy Savings 98
99 Applying SMM for Florida SWM in 2020 Progress Towards Baseline 2 0% 20% 40% 60% 80% 100% 120% Expand WTE SMM Scenario A Enhance Recycling SMM Scenario B SSO SMM Scenario C Focus on C&D & YT SMM Scenario D 2015 Portfolio Bulk recycling programs for with a 75% recycling rate for C&D Debris and yard trash Baseline 2 Metric Recycling Rate (With WTE) GHG Savings Energy Savings 99
100 Applying SMM for Florida SWM in 2020 Progress Towards Baseline 2 0% 20% 40% 60% 80% 100% 120% Expand WTE SMM Scenario A Enhance Recycling SMM Scenario B SSO SMM Scenario C Focus on C&D & YT SMM Scenario D Portfolio Current 2015 Portfolio Baseline 2 Metric Recycling Rate (With WTE) GHG Savings Energy Savings 100
101 Applying SMM for Florida SWM in 2020 Progress Towards Baseline 2 0% 20% 40% 60% 80% 100% 120% Expand WTE SMM Scenario A Enhance Recycling SMM Scenario B SSO SMM Scenario C Focus on C&D & YT SMM Scenario D Portfolio Baseline 2 Metric Recycling Rate (With WTE) GHG Savings Energy Savings 101
102 Discussion SMM could be used as a tool to set alternative targets with respect to solid waste management in Florida. This approach helps identify materials/system targets to reach SMM goals. What is an appropriate SMM metric? Could be community specific. Provides a scientific methodology to recognize WTE and more sustainable landfill practices, but still rewards recycling efforts. Reaching 75% is still a challenge. 102
103 What is the Appropriate SMM Metric? Metric Greenhouse Gases Energy Consumption Water Consumption Acidification Potential Community decides which is the most important to become the objective metric Objective Metric Baselines Reporting Measurements 103
104 Expanded View of SMM as a Tool Composting Food Waste Aerobic Digestion Landfill 104
105 Expanded View of SMM as a Tool Consumption Composting Agriculture Practice Manufacturing Food Waste Anaerobic Digestion Landfill 105
106 Next Steps Our team will keep working throughout the summer to: Refine materials flow estimates Synthesize cost data and refine environmental burden footprint Evaluate feasibility and outcome of alternative waste management strategies Continue to explore SMM metrics as a tool RFT webinar June 28 SWANA Summer Meeting July
107 107
Stakeholder Working Group Meeting Florida Solid Waste Management: State of the State
 Stakeholder Working Group Meeting Florida Solid Waste Management: State of the State October 5, 2017 Department of Environmental Engineering Sciences Engineering School for Sustainable Infrastructure and
Florida. Manufacturing Industry Edition. Source: Florida Department of Economic Opportunity, Bureau of Labor Market Statistics
 L a b o r M a r k e t I n d u s t r y P r o f i l e Florida Manufacturing Industry 2017 Edition Source: Florida Department of Economic Opportunity, Bureau of Labor Market Statistics Florida Manufacturing
Florida. Logistics & Distribution Industry Edition. Source: Florida Department of Economic Opportunity, Bureau of Labor Market Statistics
 L a b o r M a r k e t I n d u s t r y P r o f i l e Florida Logistics & Distribution Industry 2017 Edition Source: Florida Department of Economic Opportunity, Bureau of Labor Market Statistics Florida
$300, law enforcement officers from 39 law enforcement agencies, including 23 sheriff s offices, 10 police
 2016 ANNUAL REPORT FLORIDA S DOMESTIC MARIJUANA ERADICATION PROGRAM A partnership coordinated by the Drug Enforcement Administration (DEA), and the Florida Department of Agriculture and Consumer Services
Likely Voters Oct. 9-13, % 44% 9% * 2% 2% Registered Voters Oct. 9-13, % 40% 10% * 5% 3%
 Florida In Florida, interviews with 1,035 adult Americans conducted by telephone by ORC International on October 9-13, 2014. The margin of sampling error for results based on the total sample is plus or
Florida Sinkholes and Grout Injection Stabilization
 Undergraduate Journal of Mathematical Modeling: One + Two Volume 6 2014 Fall Issue 1 Article 3 Florida Sinkholes and Grout Injection Stabilization Charles Hunt Griffith II University of South Florida Advisors:
Please mail or fax completed applications and all required documentation to:
 Dear Applicant: Thank you for your interest in becoming a Department of Education, Division of Vocational Rehabilitation (DVR) employment network provider (EN). In order to be eligible for registration,
Progress Report on the Implementation of the Strategic Intermodal System (SIS)
") Progress Report on the Implementation of the Strategic Intermodal System (SIS) Supplement to the Review of the Department of Transportation Tentative Work Program FY 2006/07 through 2010/11 Supplement
Progress Report on the Implementation of the Strategic Intermodal System (SIS) Supplement to the Review of the Department of Transportation Tentative Work Program FY 2006/07 through 2010/11 Supplement
Department of Environmental Engineering Sciences Engineering School for Sustainable Infrastructure and Environment. University of Florida 2/10/2017 1
 Stakeholder Working Group Meeting Florida Solid Waste Management: State of the State February 10, 2017 Best Western Gateway Grand San Felasco Conference Room Department of Environmental Engineering Sciences
Division of Emergency Management Shelter Retrofit Report CURRENT SITUATION
 II. CURRENT SITUATION Florida has experienced near catastrophic events with loss of life and property on a massive scale due to hurricanes and a wide array of other disasters. Our 35 coastal counties lie
Florida Department of Environmental Protection Aquatic Plant Management Permits 1
 SS-AGR-132 Florida Department of Environmental Protection Aquatic Plant Management Permits 1 Vernon V. Vandiver, Jr. 2 Excess growth of aquatic plants limits the use of Florida's fresh water resources.
2016 Reuse Inventory ii
 2016 Inventory May 2017 Florida Department of Environmental Protection Division of Water Resource Management Water Program 2016 Inventory ii 2016 Inventory iii 2016 Inventory Water Program Florida Department
Economic Contributions of the Environmental Horticulture Industry in Florida in 2015
 Economic Contributions of the Environmental Horticulture Industry in Florida in 2015 Sponsored Project Report to Florida Nursery, Growers and Landscape Association, Orlando, Florida Alan W. Hodges, PhD*
Using Sustainable Materials Management to Prioritize, Strategically Plan, and Measure Solid Waste Systems
 Using Sustainable Materials Management to Prioritize, Strategically Plan, and Measure Solid Waste Systems Maryland Recycling Network Webinar September 27 th, 2018 Dr. Timothy Townsend, Jones Edmunds Professor
4/21/2011 MOBILITY PLANNING STRATEGIES AND CONCEPTS OVERVIEW. Background Mobility Planning Concept Case Examples Strategies and Resources
 MOBILITY PLANNING STRATEGIES AND CONCEPTS Center for Urban Transportation Research/USF OVERVIEW Background Mobility Planning Concept Case Examples Strategies and Resources 2 BACKGROUND: THE CONCURRENCY
All Citrus Acreage, by Variety and Survey Year, and Changes Between Surveys Florida: Specialty fruit. Total
 CITRUS COMMERCIAL CITRUS INVENTORY PRELIMINARY REPORT Cooperating with the Florida Department of Agriculture and Consumer Services 2290 Lucien Way, Suite 300, Maitland, FL 3275-7058 (407) 648-603 (855)
Dipping Vat Removal--Limiting Liability
 Dipping Vat Removal--Limiting Liability Michael R. Clark Dames & Moore Tallahassee, Florida Introduction In the early 1990s, the State of Florida's environmental agency became aware of the existence of
Annual Report
 Annual Report 2017-2018 TASA Florida Statutes Chapter 427 Contents Message from the Executive Director 1 TASA Requirements 2 Mission Statement 2 Equipment Distribution Program 2 Client Services 3 New Client
Información en español: Sirvase llamar a la oficina del supervisor de elecciones de su condado si le interesa obtener este formulario en español
 Florida Voter Registration Application Part 1 Instructions (DS-DE 39, R1S-2.040, F.A.C.)(eff. 10/2013) Información en español: Sirvase llamar a la oficina del supervisor de elecciones de su condado si
QUARTERLY PROGRESS REPORT II February 28 th, 2015 May 28 th, TEAM MEMBERS: Duygu Yasar, Mehrad Bastani, and Gregory Collins
 QUARTERLY PROGRESS REPORT II February 28 th, 2015 May 28 th, 2015 Assessment and Evaluation of Advanced Solid Waste Management Technologies for Improved Recycling Rates PRINCIPLE INVESTIGATOR: Nurcin Celik,
Sampling & Packaging. Overview. The Laboratory Response Network (LRN) Adapted by the Florida Center for Public Health Preparedness
 Adapted by the Florida Center for Public Health Preparedness") Sampling & Packaging Adapted by the Florida Center for Public Health Preparedness Overview Understand existing state laboratory roles and responsibilities Aware of field sampling and packaging protocols
Sampling & Packaging Adapted by the Florida Center for Public Health Preparedness Overview Understand existing state laboratory roles and responsibilities Aware of field sampling and packaging protocols
QUARTERLY PROGRESS REPORT III May 29 th, 2015 August 28 th, TEAM MEMBERS: Duygu Yasar, Mehrad Bastani, and Gregory Collins
 QUARTERLY PROGRESS REPORT III May 29 th, 2015 August 28 th, 2015 Assessment and Evaluation of Advanced Solid Waste Management Technologies for Improved Recycling Rates PRINCIPLE INVESTIGATOR: Nurcin Celik,
764 CENSUS OF AGRICULTURE-FLORIDA
 CENSUS OF AGRICULTURE-FLORIDA CoUNTY TABLE xm-vegetables HARVESTED FOR SALE.,, AND ; value OF [This table is presented in two sections, I TEll (For definitions: "Farms reporting," etc., see text) TilE
Further Contracting Enhancements Would Help DCF Correct Vendor Noncompliance
 December 2006 Report No. 06-72 Further Contracting Enhancements Would Help DCF Correct Vendor Noncompliance at a glance To address the requirements of Ch. 2005-222, Laws of Florida, the Department of Children
5 Breakdown by County
 5 Breakdown by County The following is the advertising breakdown by county. 5.1 TELEVISION BY COUNTY Television channels typically have a 75 mile radius of broadcasting. The pinpoints on the map below
Justification Review
 May 2002 Report No. 02-29 Florida s Air Quality Is Generally Good, But Ozone and Air Toxics Are Concerns at a glance Florida generally has good outdoor air quality. It meets current state and federal ambient
2016 Shelter Retrofit Report. November 2016
 2016 Shelter Retrofit Report November 2016 Rick Scott Governor Bryan W. Koon Director State of Florida Shelter Retrofit Report TABLE OF CONTENTS EXECUTIVE SUMMARY... i I. INTRODUCTION. 1-1 Purpose 1-1
Environmental and Historical Considerations Informational Guide
 Environmental and Historical Considerations Informational Guide for the Hazard Mitigation Grant Program Flood Mitigation Assistance Program and Project Impact Initiatives Florida Department of Community
2. County Government Structure in Florida
 P Charter P Historically 2. County Government Structure in Florida Aubrey Jewett A county government s structure refers to the political institutions and processes created by the state to legally operate
WHAT HAPPENS AFTER 75% RECYCLING GOAL? 2015 HDR, Inc., all rights reserved.
 WHAT HAPPENS AFTER 75% RECYCLING GOAL? 2015 HDR, Inc., all rights reserved. Karam Singh Project Manager 5+ Years of Solid Waste Experience Landfill Design, Landfill Permitting, LFG Systems, LFGTE Systems,
U.S. DEPARTMENT OF HUD 04/11/2017 STATE: FLORIDA HOUSING TRUST FUND INCOME LIMITS
 Cape Coral-Fort Myers, FL MSA HTF LIMITS 12150 16240 20420 24600 28780 32960 37140 41320 30% Limits 12150 13900 15650 17350 18750 20150 21550 22950 Crestview-Fort Walton Beach-Destin, FL M Crestview-Fort
1 PERSON 2 PERSON 3 PERSON 4 PERSON 5 PERSON 6 PERSON 7 PERSON 8 PERSON
 Cape Coral-Fort Myers, FL MSA HTF LIMITS 13400 16460 20780 25100 29420 33740 38060 42380 30% Limits 13400 15300 17200 19100 20650 22200 23700 25250 Crestview-Fort Walton Beach-Destin, FL M Crestview-Fort
Regional Economic Impacts of Florida s Agricultural and Natural Resource Industries
 Regional Economic Impacts of Florida s Agricultural and Natural Resource Industries by Alan W. Hodges, Assistant-In, and W. David Mulkey, Professor University of Florida, Food & Resource Economics Department
Florida Department of Environmental Protection
 2600 Blair Stone Road Rick Scott Governor Carlos Lopez-Cantera Lt. Governor Jonathan P. Steverson Secretary Electronic Submission Receipt Thank you for submitting a Construction and Demolition Report for
Electronic Submission Receipt
 FLORIDA DEPARTMENT OF 2600 Blair Stone Road Ron DeSantis Governor Jeanette Nuñez Lt. Governor Noah Valenstein Secretary Electronic Submission Receipt Thank you for submitting a Construction and Demolition
Municipal Solid Waste Generation, Recycling, and Disposal in the United States: Facts and Figures for 2011
 Municipal Solid Waste Generation, Recycling, and Disposal in the United States: Facts and Figures for 2011 The U.S. Environmental Protection Agency (EPA) has collected and reported data on the generation
INDEX: Emergency Operations Centers Project Development and Capabilities Assessment
 INDEX: Emergency Operations Centers Project Development and Capabilities Assessment Chapter 1. Chapter 2. Chapter 3. Chapter 4. Chapter 5. Chapter 6. Introduction 1.1 Historical Context 1.2 Purpose of
Climate and Materials Management. SERDC November 3, 2009 Jennifer Brady USEPA Office of Resource Conservation and Recovery
 Climate and Materials Management SERDC November 3, 2009 Jennifer Brady USEPA Office of Resource Conservation and Recovery How are Waste and Climate Connected?? What is the Life Cycle of a material? The
Florida County Government Guide 2014 Update
 Florida County Government Guide 2014 Update a publication of the Florida Association of Counties sponsored by the Florida Counties Foundation University of Florida/IFAS Extension with assistance from the
Table 11: Active C&D Debris Facilities in Florida (November 1998) DISTRICT C&D Disposal Land Clearing Debris Disposal
 DISTRICT C&D Disposal Land Clearing Debris Disposal") Landfill Disposal Overview In 1980, Florida had approximately 500 open dumps. During this time period, it was a common practice to either burn or use one of these open dumps in order to alleviate the solid
Landfill Disposal Overview In 1980, Florida had approximately 500 open dumps. During this time period, it was a common practice to either burn or use one of these open dumps in order to alleviate the solid
#61 Florida s Energy from Waste Industry: Utilizing One of Florida s Indigenous Fuel Sources
 #61 Florida s Energy from Waste Industry: Utilizing One of Florida s Indigenous Fuel Sources Joseph R. Treshler Vice President Business Management & Development FESC Summit Technical Session #2 10 AM Noon
Prepared By: Community Affairs Committee. Community Affairs Committee and Senator Clary. Small Scale Comprehensive Plan Amendments REVISED:
 SENATE STAFF ANALYSIS AND ECONOMIC IMPACT STATEMENT (This document is based on the provisions contained in the legislation as of the latest date listed below.) BILL: CS/SB 2490 Prepared By: Community Affairs
Municipal Solid Waste Generation, Recycling, and Disposal in the United States: Facts and Figures for 2010
 Municipal Solid Waste Generation, Recycling, and Disposal in the United States: Facts and Figures for 2010 The U.S. Environmental Protection Agency (EPA) has collected and reported data on the generation
TRADE ADJUSTMENT ASSISTANCE BY INDUSTRY: FLORIDA. Robert D. Emerson, Orachos Napasintuwong, Lurleen Walters, & John J. VanSickle
 PBTC 04-1 PBTC 02-6 TRADE ADJUSTMENT ASSISTANCE BY INDUSTRY: FLORIDA By Robert D. Emerson, Orachos Napasintuwong, Lurleen Walters, & John J. VanSickle PBTC 04-1 January 2004 POLICY BRIEF SERIES 1 INTERNATIONAL
Calculating the Emissions
 Calculating the Emissions Impact of Recycling August 9, 2016 Sponsored By Presented by GreenBiz.com Today s Speakers Elizabeth Resek Chief Municipal Source Reduction Branch, US EPA @EPAland Susan Robinson
Solid Waste Study Update
 Solid Waste Study Update Mayors Group Meeting September 21, 2012 Presentation Outline Study Progress Operations Review Waste Flow Analysis Preliminary Financial Review Next Steps 2 Study Progress Scope
Emerging Technologies: CCS and Siting Issues 5th Annual National Coal Meeting Washington, D.C. July 16, 2008
 Emerging Technologies: CCS and Siting Issues 5th Annual National Coal Meeting Washington, D.C. July 16, 2008 Suzi Ruhl, JD, MPH Director, Public Health and Law Program Environmental Law Institute* Washington,
Justification Review
 March 2002 Report No. 02-15 Eliminating Recycling Grants and Raising Recycling Rates Could Save Over $2.5 Million at a glance The state and its counties are no longer achieving statutory recycling goals.
Rural Routes to Employment Project Year 4
 Rural Routes to Employment Project Year 4 (Developing Employment Opportunities for Individuals with Developmental Disabilities Residing in Rural Communities) Notice of Opportunity to Apply to Participate
SWOLF Overview and Illustrative Analyses. Jim Levis, PhD Research Assistant Professor Department of Civil, Construction, and Environmental Engineering
 SWOLF Overview and Illustrative Analyses Jim Levis, PhD Research Assistant Professor Department of Civil, Construction, and Environmental Engineering S WOLF http://go.ncsu.edu/swm-lca 1 Research background
The Florida Beaches Habitat Conservation Plan
 The Florida Beaches Habitat Conservation Plan Florida Fish &Wildlife Conservation Commission Jennifer L. McGee, Ph.D., M.Sc. Tom Ostertag, M.S. Discussion Outline Florida Beaches Habitat Conservation Plan
Bradenton Area Convention Center One Haben Boulevard, Palmetto - Expo Hall South 6:00 p.m. - June 14, 2017
 Bradenton Area Convention Center One Haben Boulevard, Palmetto - Expo Hall South 6:00 p.m. - June 14, 2017 June 14, 2017 - Work Session - Charter Governments Agenda Item #1 Subject Charter Governments
Municipal Solid Waste Generation, Recycling, and Disposal in the United States: Facts and Figures for 2008
 Municipal Solid Waste Generation, Recycling, and Disposal in the United States: Facts and Figures for 2008 The U.S. Environmental Protection Agency (EPA) has collected and reported data on the generation
TREASURE COAST REGIONAL PLANNING COUNCIL M E M O R A N D U M. To: Council Members AGENDA ITEM 8
 TREASURE COAST REGIONAL PLANNING COUNCIL M E M O R A N D U M To: Council Members AGENDA ITEM 8 From: Date: Staff June 16, 2017 Council Meeting Subject: Florida Power & Light Company Ten Year Power Plant
Freshwater Use Valuation for the St. Johns River Basin, Florida, USA
 Freshwater Use Valuation for the St. Johns River Basin, Florida, USA Christopher J. Brown, Ph.D., P.E. Associate Professor, University of North Florida & Ms. Cecilia McKeon, former graduate student University
Sumter County Recycling Plan
 Sumter County Recycling Plan INTRODUCTION The amount and type of waste generated by a community, and the strategies employed to manage or treat the waste, contribute to the many facets of a sustainable
Do we have the right goals? Applying lifecycle thinking to materials management goals. Presented to The Evergreen Chapter of SWANA April 27, 2017
 Do we have the right goals? Applying lifecycle thinking to materials management goals Presented to The Evergreen Chapter of SWANA April 27, 2017 Our Recycling Impact WM has 3 MRFs is Washington and recycled
Initiative to Protect Florida s Springs and Significant Water Resources. Contents
 September 17, 2013 Initiative to Protect Florida s Springs and Significant Water Resources Prepared by the Florida Conservation Coalition Contents Priority Springs and Water Bodies Page 2 Background information
2017 Regional Load & Resource Plan
 Regional Load & Resource Plan FRCC-MS-PL-130 Version: 1 3000 Bayport Drive, Suite 600 Tampa, Florida 33607-8410 (813) 289-5644 - Phone (813) 289-5646 - Fax www.frcc.com Classification: Public FRCC-MS-PL-130
FLORIDA DEPARTMENT OF ECONOMIC OPPORTUNITY AGRICULTURAL SERVICES OUTREACH PLAN PROGRAM YEAR 2014
 FLORIDA DEPARTMENT OF ECONOMIC OPPORTUNITY AGRICULTURAL SERVICES OUTREACH PLAN PROGRAM YEAR 2014 (Modification to 2012-2016 State Strategic Workforce Plan) D. WAGNER-PEYSER AGRICULTURAL OUTREACH 1. Assessment
APPENDIX A ELIGIBLE FLORIDA COMMUNITIES Volunteer Florida uses the Governor s rural area of opportunity definition:
 APPENDIX A ELIGIBLE FLORIDA COMMUNITIES Volunteer Florida uses the Governor s rural area of opportunity definition: Florida Statutes: 288.0656 (1)(d) Rural area of opportunity means a rural community,
SECTION A-VEHICLE CRASH/INCIDENT OCCURRENCE SECTION B-DRIVER/VEHICLE INFORMATION
 STATE OF FLORIDA DEPARTMENT OF TRANSPORTATION VEHICLE CRASH/INCIDENT REPORT 500-000-15 SAFETY OGC - 06/12 Page 1 of 10 Please print or type SECTION A-VEHICLE CRASH/INCIDENT OCCURRENCE 1) Report Type 2)
Covanta s Sustainable Waste Management
 Covanta s Sustainable Waste Management Energy-from-Waste World Leader 2 Introduction to Covanta Overview Ownership Publicly traded NYSE (CVA) Waste Disposal 45 Energy from Waste facilities (EfW) Process
STUDY OF THE REPORTED INDOOR RADON MEASUREMENT RESULTS FOR
 STUDY OF THE REPORTED NDOOR RADON MEASUREMENT RESULTS FOR RESDENTAL STRUCTURES AND LARGE BULDNGS N FLORDA Kaiss K. Al-Ahmady, Walter G. Klein, Clark P. Eldredge, Donald M. Phillips, Norman M. Gilley State
Evaluating Cypress Sustainability FIA Data In the Hot Seat
 Evaluating Cypress Sustainability FIA Data In the Hot Seat Mark J. Brown 1 Abstract: The use of cypress (Taxodium species) for mulch boomed during the 1990s, and its growth in popularity created concerns
Overview of Billing Guidelines for Early Intervention Services (EIS) and Targeted Case Management (TCM) Services for Children Ages 0 to 3
 and Targeted Case Management (TCM) Services for Children Ages 0 to 3") Overview of Billing Guidelines for Early Intervention Services (EIS) and Targeted Case Management (TCM) Services for Children Ages 0 to 3 November 30, 2018 12/3/2018 EIS and TCM Services Implementation
Overview of Billing Guidelines for Early Intervention Services (EIS) and Targeted Case Management (TCM) Services for Children Ages 0 to 3 November 30, 2018 12/3/2018 EIS and TCM Services Implementation
WATER LEVELS IN ARTESIAN AND NONARTESIAN AQUIFERS OF FLORIDA, STATE OF FLORIDA STATE-BOARD OF CONSERVATION
 STATE OF FLORIDA STATE-BOARD OF CONSERVATION DIVISION OF GEOLOGY Robert 0. Vernon, Director INFORMATION CIRCULAR NO. 52 WATER LEVELS IN ARTESIAN AND NONARTESIAN AQUIFERS OF FLORIDA, 1963-64 By.Henry G.
Solid Waste Management in Florida
 Expanding Program Plans to Meet Goals Miriam Zimms Recycle Florida Today Summer Conference June 2015 kessler consulting inc. innovative waste solutions Solid Waste Management in Florida Now the 3rd most
From Waste Management to Resource Management
 From Waste Management to Resource Management Florida Sunshine Chapter Conference July 29, 2014 John H. Skinner, Ph.D. Executive Director and CEO The Solid Waste Association of North America The Transition
The Economic Analysis of the FDEP Proposed Numeric Nutrient Criteria in Florida
 Center for Economic Forecasting and Analysis Florida State University 3200 Commonwealth Blvd. Suite 153 Tallahassee, Florida 32306-2770 The Economic Analysis of the FDEP Proposed Numeric Nutrient Criteria
Advancing Sustainable Materials Management: 2013 Fact Sheet
 Advancing Sustainable Materials Management: 2013 Fact Sheet Assessing Trends in Material Generation, Recycling and Disposal in the United States June 2015 Introduction U.S. Environmental Protection Agency
2015 Florida Southern Pine Beetle Forecast
 2015 Florida Southern Pine Beetle Forecast Anthony Ayers, OPS Forester and Christopher Pearce, Survey Coordinator Florida Forest Service, Forest Health Section Summary A pheromone trap survey was conducted
Tampa Bay Energy Summit Benefits of Waste to Energy. May 28, 2015
 Tampa Bay Energy Summit Benefits of Waste to Energy May 28, 2015 Star The Star Program is designed for exemplary worksites with comprehensive, successful safety and health management systems. Companies
Zero Waste Around the World. Rick Anthony Richard Anthony Associates Sustainable Living Symposium Earth Day Festival at Washington Park April 2009
 Zero Waste Around the World Rick Anthony Richard Anthony Associates Sustainable Living Symposium Earth Day Festival at Washington Park April 2009 Norwich, UK Italy Carroll County, Maryland Los Angeles,
Zero Waste in Practice. Presented to the Maryland recycling network 2014 Annual Conference. Charlotte
 Zero Waste in Practice Presented to the Maryland recycling network 2014 Annual Conference Charlotte Matthews Cornelius Unincorporated Mecklenburg County Mint Hill Davidson Who are we? Mecklenburg Stats
Coastal Defense and Climate Change An overview of NatCap work and a plea for help
 Coastal Defense and Climate Change An overview of NatCap work and a plea for help Anne Guerry, Greg Guannel, Greg Verutes, Jess Silver, Joe Faries, Katie Arkema, Rob Griffin, Suzanne Langridge Annual Meeting
WHAT YOU NEED TO KNOW
 Jeremy O Brien, PE, BCEE Director of Applied Research, SWANA Course Title Here FOOD WASTE LESSON TITLE DIVERSION HERE PROGRAMS WHAT YOU NEED TO KNOW LESSON # T R A I N I N G 2 0 1 0 NC SWANA Spring 2016
State of Recycling In Arkansas 2003
 State of Recycling In Arkansas 2003 Arkansas is well on the way to reaching its goal of recycling 40 percent of the municipal solid waste stream by 2005. Nearly 39 percent of the 2003 solid waste stream
Materials Management and Climate Change. An Introduction
 Materials Management and Climate Change An Introduction 1) Consumption patterns 2) Greenhouse gas connection to materials 3) Role of materials management 4) Ways to reduce material-related greenhouse gases
Developing a Zero Waste Implementation Plan, Montgomery County, MD MRN/SWANA-MidAtlantic Annual Conference Maryland Recycling Network
 Developing a Zero Waste Implementation Plan, Montgomery County, MD 2014 MRN/SWANA-MidAtlantic Annual Conference Maryland Recycling Network Bill Davidson, DSWS, June 19, 2014 Key Thoughts Eye on the Ball
2018 Primary Election
 Alachua County District 2 Marihelen Haddock Wheeler Democrat Yes Candidate Won in primary Moving to the General Election 59.88 16,879 Alachua County District 2 Lee Pinkoson Democrat Yes Incumbent Not running
Climate Change, Biomass and Waste Management Chuck White Director of Regulatory Affairs -- WM West California Biomass Collaborative Sacramento, CA --
 Climate Change, Biomass and Waste Management Chuck White Director of Regulatory Affairs -- WM West California Biomass Collaborative Sacramento, CA -- March 28, 2007 What is:? Waste Management = Renewable
STATE OF FLORIDA STATE BOARD OF CONSERVATION DIVISION OF GEOLOGY WATER LEVELS IN ARTESIAN AND NONARTESIAN AQUIFERS OF FLORIDA IN 1960
 STATE OF FLORIDA STATE BOARD OF CONSERVATION DIVISION OF GEOLOGY FLORIDA GEOLOGICAL SURVEY Robert 0. Vernon, Director INFORMATION CIRCULAR NO. 33 WATER LEVELS IN ARTESIAN AND NONARTESIAN AQUIFERS OF FLORIDA
Economic Impact of Recycling in Alabama and Opportunities for Growth. Alabama Department of Environmental Management. Land Division Solid Waste Branch
 Economic Impact of Recycling in Alabama and Opportunities for Growth Alabama Department of Environmental Management Land Division Solid Waste Branch June 2012 Alabama Department of Environmental Management
IWRC. Member Survey Report 1 PROCESSING ~ Making Recycling Work. September 1990 REMANUFACTURING. Waste Recyclers Council
 - IWRC Waste Recyclers Council Member Survey Report 1 PROCESSING ~ REMANUFACTURING Making Recycling Work September 1990 9 Million Tons of Material Handled by WRC In 1989 In 1989, members of the Waste
Valuing the Ecosystem Services of Florida s Forest Conservation Programs: The Economic Benefits of Protecting Water Quality 1
 FOR309 Valuing the Ecosystem Services of Florida s Forest Conservation Programs: The Economic Benefits of Protecting Water Quality 1 Melissa M. Kreye, Francisco J. Escobedo, Damian C. Adams, Taylor Stein,
Zero Waste Implementation Plan August 25 th, 2010
 Zero Waste Implementation Plan August 25 th, 2010 March Zero Waste Workshops Opportunities and constraints April Sustainable Living Symposium June Policies and programs August Draft plan elements November
Florida s Recycling and Litter Programs:
 Florida s Recycling and Litter Programs: Current Status and Potential Future Directions Report to the Governor, President of the Senate and Speaker of the House As Required by HB 9, 2001 Session Florida
(e) Agricultural Outreach Plan (AOP)
 Agricultural Outreach Plan (AOP)") (e) Agricultural Outreach Plan (AOP) (1) Assessment of Need (A) Assessment of Agricultural Activity in the State According to the Florida Department of Agriculture and Consumer Services, the agricultural
(e) Agricultural Outreach Plan (AOP) (1) Assessment of Need (A) Assessment of Agricultural Activity in the State According to the Florida Department of Agriculture and Consumer Services, the agricultural
Program. Mini-FARMS FARMS. Facilitating Agricultural Resource Management Systems. Mini- For More Information
 Balancing Water Needs Protecting Water Resources Mini-FARMS projects are for agricultural operations that are enrolled in an FDACS-adopted best management practices program and located within the District.
Southwest Florida Water Management District. Mini-FARMS. Facilitating Agricultural Resource Management Systems. Program
 Southwest Florida Water Management District Mini-FARMS Facilitating Agricultural Resource Management Systems Program Mini-FARMS Mini-FARMS is a cost-share program that assists agricultural operations of
Status of Managing the Organic Waste in the U.S.: The 2013 Columbia Survey and Beyond Ljupka Arsova Consultant II Gershman, Brickner & Bratton, Inc.
 Status of Managing the Organic Waste in the U.S.: The 2013 Columbia Survey and Beyond Ljupka Arsova Consultant II Gershman, Brickner & Bratton, Inc. Presented at the WTERT Bi-Annual Meeting October 9,
KSA. Govcouncnt31 ConSUlia'lls
 KSA Govcouncnt31 ConSUlia'lls MEMORANDUM TO: FROM: Polk County Charter Review Commission Kurt Spitzer DATE: RE: March 10 th Meeting Information The purpose of this memorandum is to summarize the issues
Classification and Compensation Study Pinellas County, Florida Personnel Board Update
 Classification and Compensation Study Pinellas County, Florida Personnel Board Update IV.2. Presented by: February 1, 2018 Overview Study Goals Project Phases Employee Meetings Current System Review JAT
S WOLF. Life-Cycle Modeling of Solid Waste Processes and Systems.
 Life-Cycle Modeling of Solid Waste Processes and Systems Jim Levis, PhD Research Assistant Professor Department of Civil, Construction, and Environmental Engineering S WOLF http://go.ncsu.edu/swm-lca Model
STATE OF FLORIDA OFFICE OF THE GOVERNOR EXECUTIVE ORDER NUMBER (Emergency Management-Tropical Storm Emily)
") STATE OF FLORIDA OFFICE OF THE GOVERNOR EXECUTIVE ORDER NUMBER 17-204 (Emergency Management-Tropical Storm Emily) WHEREAS, as of 8:00 a.m. on July 31, 2017, the National Hurricane Center has reported a
STATE OF FLORIDA OFFICE OF THE GOVERNOR EXECUTIVE ORDER NUMBER 17-204 (Emergency Management-Tropical Storm Emily) WHEREAS, as of 8:00 a.m. on July 31, 2017, the National Hurricane Center has reported a
CHARACTERIZATION OF MUNICIPAL SOLID WASTE IN THE UNITED STATES: 1998 UPDATE. Prepared for
 CHARACTERIZATION OF MUNICIPAL SOLID WASTE IN THE UNITED STATES: 1998 UPDATE Prepared for U.S. Environmental Protection Agency Municipal and Industrial Solid Waste Division Office of Solid Waste Report
Mecklenburg County Solid Waste Management Plan Public Meeting Tuesday, April 17 th
 Mecklenburg County Solid Waste Management Plan 2012 Public Meeting Tuesday, April 17 th Why do we Plan? A requirement of the North Carolina Solid Waste Management Act of 1996 (NCGS 130A 309.09A) County
Climate Change and Waste Reducing Waste Can Make a Difference
 Climate Change and Waste Reducing Waste Can Make a Difference Climate Change and Municipal Solid Waste: Environmental Issues With an Important Underlying Link Rising levels of gases in the Earth s atmosphere