Nutrient Sources, Fate, Transport, and Effects Study of Galveston Bay, Texas Rachel Windham,
|
|
|
- Daniel Watson
- 6 years ago
- Views:
Transcription

1 Nutrient Sources, Fate, Transport, and Effects Study of Galveston Bay, Texas Rachel Windham, Department of Marine Biology Texas A&M University at Galveston


2 2 Acknowledgements: Dr. Antonietta Quigg Members of the Phytoplankton Dynamics Laboratory Tyra Booe Dr. Jamie Steichen Rachel Windham Allyson Lucchese Dr. Allison McInnes Sam Dorado Hannah Preischel Alicia Shepard
 Highly productive; source of 1/3 of the state s commercial")
3 3 Galveston Bay Galveston Bay is an estuary located on the Texas coast (northwest Gulf of Mexico) 600 square miles (1,500 square kilometers) of open water Largest estuary in Texas and 7 th largest in the nation Freshwater sources: Trinity River and San Jacinto River Supports multi-billion dollar fisheries industry (crab, shrimp, oyster) Highly productive; source of 1/3 of the state s commercial fisheries revenue
 maintain salinity gradients, nutrient loads, and sediment inputs contributing to the health of Galveston Bay Nutrient loading can positively impact the ecosystem")
4 4 Watershed Watershed spans area of 24,000 square miles (62,000 square kilometers) Trinity River and San Jacinto River have origins in highly-urbanized Dallas- Fort Worth metroplex and Houston area respectively Freshwater inflows (FWI) maintain salinity gradients, nutrient loads, and sediment inputs contributing to the health of Galveston Bay Nutrient loading can positively impact the ecosystem in appropriate quantities; however, in excessive amounts, nutrients can contribute to harmful algal blooms which further impact the system by contributing to hypoxia and fish kills
 Important to monitor current nutrient loads and assess impacts on the ecosystem Legend Red Developed Land Other Colors Crop and Natural Land")
5 5 Urbanization Houston and Dallas populations expected to double by 2050 Recent changes in land use and development could affect nutrient influx via freshwater inflows into Galveston Bay especially considering increased flow from Houston (wastewater) Important to monitor current nutrient loads and assess impacts on the ecosystem Legend Red Developed Land Other Colors Crop and Natural Land Legend Red Developed Land Other Colors Crop and Natural Land
6 6 Objectives Support continued research to understand nutrient fluxes in Galveston Bay Determine nutrient budget for ecosystem Examine the effect of nutrient loading associated with freshwater inflows on the phytoplankton community Particular focus on freshwater inflows from the Trinity River and to a lesser degree, those associated with the San Jacinto River Perform intensive resource limitation assays (RLAs) across six locations in the Trinity-San Jacinto Estuary during March and July (representative of high-flow and low-flow periods) Use the resulting data and conclusions to develop the next generation of predictive models relating freshwater inflows to bay health

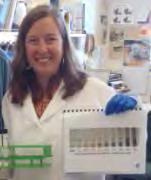
7 7 Nutrient and sediment loading Assessment of phytoplankton response to nutrient loading through resource limitation assays in concert with assessment of water quality Treat seawater with nutrient additions and incubate for one week in ambient conditions Analyze phytoplankton community health by observing parameters such as chlorophyll-a concentration, pigment composition and fluorescence response
8 8 Project Evolution : Early RLA studies in Galveston Bay involved monthly analyses of two stations in Galveston Bay (north: freshwater influence, south: marine influence) Included nutrient addition treatments of nitrogen, phosphorous, and a combination of nitrogen and phosphorous Yielded three notable insights: Phytoplankton response to nutrient additions higher in periods of low-flow Different responses in scale and species composition of phytoplankton communities at different stations Phytoplankton frequently co-limited by nutrients, typically nitrogen and phosphorous
9 9 More Intensive Study : Examined phytoplankton community response to nutrient additions on a finer spatial scale Investigated response to different nitrogen sources (nitrate vs. ammonium) Nitrate, ammonium, phosphate, nitrate & phosphate, nitrate & ammonium, silicate, all Note that 2011 was among the warmest and driest years on record for Texas since the record s origin in 1871 (one of the top five driest years on record for the watershed) Extreme conditions in 2011 presented opportunity to observe seasonal responses with freshwater inflow influence turned off Comparing 2011 data to higher flow years (2010 and 2012) could inform system function in normal, drought, and recovery stages

 2010")
10 10 FWI During Study Period Discharge (cfs)* Gage Height (ft)
11 11 Nutrient Limitation DIN:P Trinity River Mostly N-limited J M M J S N F A J A O D J M M J S N Average monthly Trinity Discharge (cfs) DIN:P Mid-Bay Mostly N-limited J M M J S N F A J A O D J M M J S N Average monthly Trinity Discharge (cfs) DIN:P Gulf of Mexico Mostly N-limited J M M J S N F A J A O D J M M J S N Dissolved inorganic nitrogen (DIN):phosphorus (P) ratios calculated from 2010 to The secondary y-axis is the average monthly Trinity River discharge (cfs) data collected from the USGS. With a few exceptions, DIN:P ratios were always < 1 at Stations 1, 3 and 5 suggesting phytoplankton were N limited at these locations for most of the study period (especially during 2011) switching to P limited in the winter Average monthly Trinity Discharge (cfs)
12 12 Nutrient Limitation DIN:P San Jacinto River Mostly Not limited Average monthly Trinity Discharge (cfs) 0 J M M J S N F A J A O D J M M J S N 0 Dissolved inorganic nitrogen (DIN):phosphorus (P) ratios calculated from 2010 to The secondary y-axis is the average monthly Trinity River discharge (cfs) data collected from the USGS. By contrast, at the San Jacinto River influenced station, we found DIN:P ratios were frequently in the range of 7:1 to 12:1 (neither N or P limited), especially from April-May to December. In the winter time, from January to March, DIN:P ratios were greater than 14 indicative of P limitation at this station.

13 13 Chlorophyll-a Concentrations of RLA Treatments Example: SJR Mid1 TR Mid2 Mid3 Gulf


14 14 Chlorophyll-a Concentrations of RLA Treatments SJR Mid1 TR Mid2 Mid3 Gulf SJR Mid1 TR Mid2 Mid3 Gulf SJR Mid1 TR Mid2 Mid3 Gulf SJR Mid1 TR Mid2 Mid3 Gulf SJR Mid1 TR Mid2 Mid3 Gulf SJR Mid1 TR Mid2 Mid3 Gulf
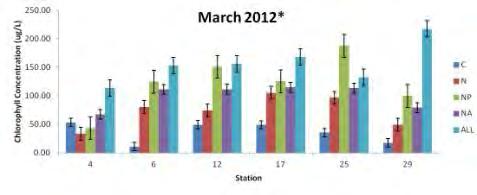
15 15 Chlorophyll Concentration (ug/l) Chlorophyll Concentration (ug/l) Chlorophyll Concentration (ug/l) Upper Trinity Basin C N A P Si NA NP ALL G S March July Mid Bay C N A P Si NA NP ALL G S March July Lower Bay C N A P Si NA NP ALL G S March July Bioassay in 2012 March (blue) high flow July (green) low flow N-nitrate, A-ammonium, NA, NP, All treatments responded significantly more than the control consistent with previous findings of N limitation and/or NP co-limitation Sediment treatments revealed alleviation of light-limitation in March (higher chlorophyll) but not in July
16 16 Bioassays in 2012 plus water quality values (A) Clusters A & B dominated by samples from Feb-May & Oct-Nov = periods of higher flows, more nutrients and sediments Cluster C dominated by samples from June-Sep = periods of lower flows and warmer temperatures and more chlorophyll
17 17 Bioassays in 2012 plus water quality values (B) Clusters A & B had the highest fucoxanthin, alloxanthin and peridinin concentrations =diatoms, cryptophytes & dinoflagellates Cluster C had the highest chlorophyll b and zeaxanthin =greens and cyanobacteria

 Preliminary evaluations reveal that phytoplankton biomass is")


18 18 Progress Summary Completed Bioassays through 2013 Ammonium elicited similar response to the addition of nitrate in terms of chlorophyll-a biomass, but a different part of the phytoplankton community responded (will follow up) Preliminary evaluations reveal that phytoplankton biomass is either nitrogen or nitrogen and phosphorus co-limited in the bay; as most GOM estuaries are N limited with recent studies pointing to N-P co-limitation, important to investigate link to freshwater inflows With more droughts and population increases predicted to occur, the necessity of freshwater inflow studies is great


19 19 Other Projects Findings are being used to develop intense process-based understanding of the linkages between the magnitude of freshwater inflows and nutrient loading on primary productivity for the Galveston Bay ecosystem Particularly important given water rights issues which are currently being debated in Texas (Senate Bill 3)


20 20 Phytoplankton Monthly surveys completed to mid 2013 Multi-year data reveals patterns of when specific genera are observed
21 21 Station Near Trinity River Station in Mid-Bay Taxonomic Distinctness of Phytoplankton and Station 1 has greatest diversity while Stations 2 & 6 have less -Drop is observed at all stations in 2010 & May be associated with development and presence of a drought Station Near Gulf of Mexico

, and dissolved organic matter (DOM;")

22 22 Mapping Monthly 2-day sampling trips conducted using a Dataflow to measure surface water quality Concurrently measures temperature, ph, dissolved oxygen (DO), salinity, water clarity (beam transmittance), chlorophyll a (in situ fluorescence), and dissolved organic matter (DOM; in situ fluorescence). GPS on board allows for geo-referencing for all measurements for each variable Can map water quality over temporal and spatial scales
 and November (high flow; after freshet)")

23 23 Example from 2009 Salinity in August (low flow) and November (high flow; after freshet) Discharge (cfs)* Following slide: quarterly salinity interpolations for the years 2010, 2011, and 2012


24 Jan Mar Jun Oct 2011 Jan Mar Jun Oct 2012 Jan Mar Jun Oct

25 25 Freshwater Inflow Bioindicators Vallisneria americana (Wild Celery) Commonly studied as a bioindicator in other bays Continuing surveys this spring In terms of a bioindicator for Galveston Bay, perhaps best only to show impact of extremely low flows and provide caution

26 26 Freshwater Inflow Bioindicators Ruppia maritima (widgeongrass, ditch-grass or tassel pondweed) Seagrass tolerant of lower salinities Utilized by birds and aquatic animals Potential as a bioindicator???
 Pattern of decline")


27 27 Freshwater Inflow Bioindicators Rangia cuneata (Atlantic Rangia) Pattern of decline in populations since 1980 s observed in Galveston Bay, Sabine Lake and San Antonio Bay Bioindicator suitability for Galveston Bay still to be determined adults tolerant of higher salinities, but larvae hard to identify Additional data will be collected across 2014 TPWD/SWG funding
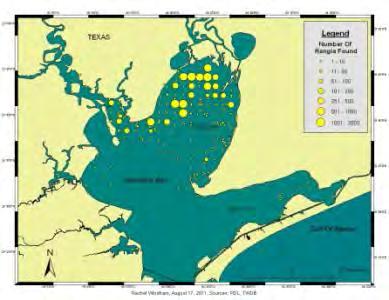
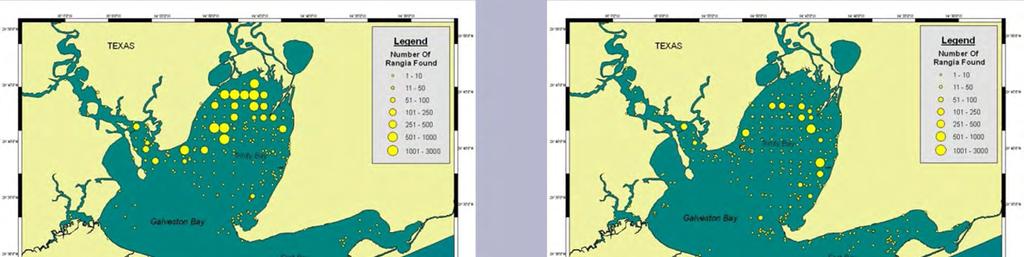
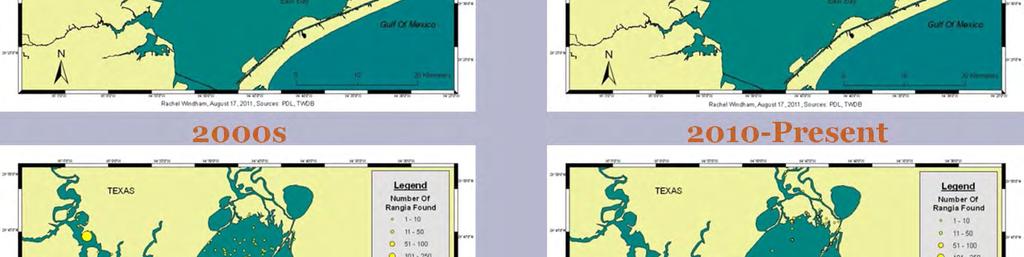
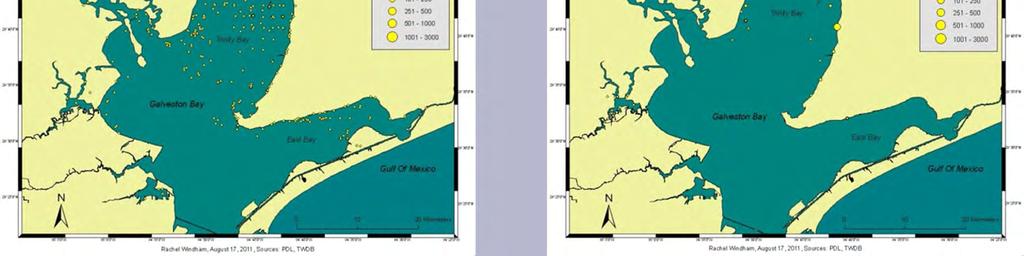
28 28 Rangia Distribution in Galveston Bay 1980s 1990s 2000s 2010-Present

29 29 Updated TxBLEND Model TxBLEND is a two-dimensional, depth-averaged hydrodynamic and salinity transport model used to simulate salinity conditions in bays (TWDB) The model allows a comparison between observed and simulated data We* updated the TxBLEND model outputs for * (with Mr. Joe Trungale; Trungale Engineering and Science)
 compared to modeled salinity at the nearest TxBLEND Node (1833;")
30 30 Daily average salinities predicted by TxBLEND compared with dataflow measured salinities -August 16, Time series of salinity measured with the dataflow at station 21 (red) compared to modeled salinity at the nearest TxBLEND Node (1833; blue) - June 2008 to December 2012.
31 31 The objectives of future efforts: Examine and analyze the phytoplankton and water quality samples collected up to the present day, Continue the high spatial and temporal resolution mapping of Galveston Bay water quality parameters, Investigate the paired distribution of Vallisneria and Ruppia plants as well as that of Rangia clams in relation to salinity gradients in Galveston Bay, and Using the data collected, develop a better understanding of the use of phytoplankton, flora and fauna as biological indicators of the effects of freshwater inflows in Galveston Bay. Define influence of nutrient and sediment load on the phytoplankton, flora and fauna in Galveston Bay,
32 32 Applications These data will be critical to the understanding of estuarine dynamics at various levels of stress Understanding nutrient impacts and their relationships with freshwater inflows will help to prepare for additional stressors such as expanding population and increased drought Ultimately, knowledge gained from these studies will help to inform management plans for the watershed


33 33 December 2013 sampling day Thanks for the continued support!
Environmental Flows for the Galveston Bay Estuary. Scott A. Jones Environmental Policy & Outreach Galveston Bay Foundation
 Environmental Flows for the Galveston Bay Estuary Scott A. Jones Environmental Policy & Outreach Galveston Bay Foundation Galveston Bay Foundation Mission: To preserve, protect, and enhance the natural
Nutrient Response to Sewage Abatement in Hong Kong
 Nutrient Response to Sewage Abatement in Hong Kong Prof. Paul J. Harrison Atmospheric, Marine & Coastal Environment Program Institute for the Environment HK University of Science & Technology Outline Background
Little Bay Water Quality Report Card Spring 2014
 Little Bay Water Quality Report Card Spring 2014 Little Bay is a small, semi-enclosed estuary located in the heart of Rockport, Texas. Estuaries, where freshwater from rivers and streams mixes with salt
Relationships of water age with chlorophyll a concentrations in the eutrophic Lower Alafia River estuary. Michael S. Flannery Xinjian Chen
 Relationships of water age with chlorophyll a concentrations in the eutrophic Lower Alafia River estuary Michael S. Flannery Xinjian Chen Chlorophyll a (µg/l) Kilometers from river mouth KM = 16.47-1.96(Ln
PRESS RELEASE. LOUISIANA UNIVERSITIES MARINE CONSORTIUM July 28, Abstract
 PRESS RELEASE LOUISIANA UNIVERSITIES MARINE CONSORTIUM July 28, 2013 Abstract The 2013 area of low oxygen, commonly known as the Dead Zone, measured 15,120 square kilometers (= 5,800 square miles) in this
Texas: Water For Wildlife. Cappy Smith
 Texas: Water For Wildlife Cappy Smith Texas water resources Understanding wildlife s connection Who owns the water? Why care? What can I do? How Wet Is Our Planet? Image Woods Hole Oceanographic Institution
Nutrients, Algal Blooms and Red Tides in Hong Kong Waters. Paul J. Harrison and Jie XU
 Nutrients, Algal Blooms and Red Tides in Hong Kong Waters Paul J. Harrison and Jie XU Division of Environment, Hong Kong University of Science & Technology 1. Introduction The Pearl River is China's second
Environmental flow requirements (EFRs) related to preference of phytoplankton in the Yellow River Estuary (YRE) based on an ecohydrodynamic model
 related to preference of phytoplankton in the Yellow River Estuary (YRE) based on an ecohydrodynamic model") Environmental flow requirements (EFRs) related to preference of phytoplankton in the Yellow River Estuary (YRE) based on an ecohydrodynamic model R. Zhao, Z. F. Yang*, T. Sun State Key Laboratory of Water
Environmental flow requirements (EFRs) related to preference of phytoplankton in the Yellow River Estuary (YRE) based on an ecohydrodynamic model R. Zhao, Z. F. Yang*, T. Sun State Key Laboratory of Water
Science of the Causes of Hypoxia Nancy Rabalais et al.
 Science of the Causes of Hypoxia Nancy Rabalais et al. In support of overview of diversions and hypoxia, and context for refining science needs; July 14, 2014 Scientific Curiosity Hypothesis Testing Management
Submersed Aquatic Vegetation Restoration and Management from the Biologist and Resource Perspective
 Submersed Aquatic Vegetation Restoration and Management from the Biologist and Resource Perspective Carol Franze, LA Sea Grant/LSU AgCenter cfranze@agcenter.lsu.edu and Michael Poirrier, University of
Hypoxia in the Gulf of Mexico: Benefits and Challenges of Using Multiple Models to Inform Management Decisions
 Hypoxia in the Gulf of Mexico: Benefits and Challenges of Using Multiple Models to Inform Management Decisions Multiple Models for Management (M3.2) in the Chesapeake Bay February 25, 2013 Annapolis MD
5.0 PHYTOPLANKTON PHYSIOLOGY. Luke Twomey Christopher P. Buzzelli Hans W. Paerl. 5.1 Introduction
 5. PHYTOPLANKTON PHYSIOLOGY Luke Twomey Christopher P. Buzzelli Hans W. Paerl 5.1 Introduction Phytoplankon production is the primary source of organic carbon in the water column of the NRE (Matson and
Georgica Pond Progress: Executing a Sustainable Plan for Remediation. Christopher J. Gobler, PhD
 Georgica Pond Progress: Executing a Sustainable Plan for Remediation Christopher J. Gobler, PhD Outline of presentation Background on Georgica Pond 2016 status and trends Options for improving the conditions
How global warming and climate change may be accelerating losses of Chesapeake Bay seagrasses.
 How global warming and climate change may be accelerating losses of Chesapeake Bay seagrasses. Dr. Ken Moore The Virginia Institute of Marine Science School of Marine Science College of William and Mary
AGENDA CHANNEL ISLANDS HARBOR TASK FORCE SPECIAL MEETING
 A. Roll Call B. Pledge of Allegiance C. New Business AGENDA CHANNEL ISLANDS HARBOR TASK FORCE SPECIAL MEETING Monday, October 22, 2018, 6:00pm Performing Arts Center, Ventura Room 800 Hobson Way, Oxnard,
PRESS RELEASE. LOUISIANA UNIVERSITIES MARINE CONSORTIUM August 4, 2013
 PRESS RELEASE LOUISIANA UNIVERSITIES MARINE CONSORTIUM August 4, 2013 The 2014 area of low oxygen, commonly known as the Dead Zone, measured 13,080 square kilometers (= 5,052 square miles) as of Aug 1,
The Hypoxic Zone in the Gulf of Mexico
 The Hypoxic Zone in the Gulf of Mexico References Council Committee on Environmental and Natural Resources. 2003. An Assessment of Coastal Hypoxia and Eutrophication in U.S. Water. National Science and
A Vision for a Healthy, Productive, and Sustainable Galveston Bay
 A Vision for a Healthy, Productive, and Sustainable Galveston Bay Bob Stokes, President Preserving, protecting, and enhancing Galveston Bay for 29 years A bit about our Bay Largest bay in Texas (660 square
7.9 Nitrogenous Nutrients and Plankton Production in Jamaica Bay, NY
 7.9 Nitrogenous Nutrients and Plankton Production in Jamaica Bay, NY Ray Sambrotto 7.9.1 SUMMARY Two blooms characterize phytoplankton growth in Jamaica Bay: the winter/spring bloom, between February and
Annual Report on Clam Bay Numeric Nutrient Concentration (NNC) Criteria
 Criteria") March 7, 2018 Tim Hall, Turrell, Hall and Associates, Inc. David Tomasko, Ph.D. Emily Keenan, M.S. Annual Report on Clam Bay Numeric Nutrient Concentration (NNC) Criteria Executive Summary Water quality
March 7, 2018 Tim Hall, Turrell, Hall and Associates, Inc. David Tomasko, Ph.D. Emily Keenan, M.S. Annual Report on Clam Bay Numeric Nutrient Concentration (NNC) Criteria Executive Summary Water quality
MODELING NUTRIENT LOADING AND EUTROPHICATION RESPONSE TO SUPPORT THE ELKHORN SLOUGH NUTRIENT TOTAL MAXIMUM DAILY LOAD
 MODELING NUTRIENT LOADING AND EUTROPHICATION RESPONSE TO SUPPORT THE ELKHORN SLOUGH NUTRIENT TOTAL MAXIMUM DAILY LOAD Martha Sutula Southern California Coastal Water Research Project Workshop on The Science
Hobcaw Barony and the USC Baruch Marine Field Laboratory
 Hobcaw Barony and the USC Baruch Marine Field Laboratory James L. Pinckney Marine Science Program and Department of Biological Sciences School of the Earth, Ocean, and Environment University of South Carolina
Causes of Gulf of Mexico Hypoxia
 Causes of Gulf of Mexico Hypoxia Nancy N. Rabalais 1 R. Eugene Turner 2 1 Louisiana Universities Marine Consortium 2 Louisiana State University Center for Sponsored Coastal Ocean Research, Coastal Ocean
l ake Biology terc.ucdavis.edu
 l ake Biology Algae growth (primary productivity) Yearly since 1959 Primary productivity (PPr) is a measure of the rate at which algae produce biomass through photosynthesis. At Lake Tahoe, it has been
PRESS RELEASE. LOUISIANA UNIVERSITIES MARINE CONSORTIUM August 2, 2017 SUMMARY
 PRESS RELEASE LOUISIANA UNIVERSITIES MARINE CONSORTIUM August 2, 2017 SUMMARY The 2017 area of low oxygen, commonly known as the Dead Zone, measured 22,720 square kilometers (= 8,776 square miles) is the
Chesapeake Bay. report card
 Chesapeake Bay report card 2010 C- C Healthy water quality provides better habitat conditions for crabs, fish, and other aquatic species. issolved oxygen is essential to the survival of all these organisms;
Analysis of Chlorophyll-a and other data collected in the Illinois River Watershed from
 Analysis of Chlorophyll-a and other data collected in the Illinois River Watershed from 1996-2003 By W.J. Andrews and D.N. Mott USGS Oklahoma Water Science Center For the Oklahoma Clean Lakes and Watersheds
Instream Flows in the San Antonio River Basin From Science to Environmental flow Standards. Steven J. Raabe, P.E
 Instream Flows in the San Antonio River Basin From Science to Environmental flow Standards Steven J. Raabe, P.E October 26, 2012 Keys to Success Mandated Processes Science Compatible Schedules Stakeholder
EUTROPHICATION. Student Lab Workbook
 EUTROPHICATION Student Lab Workbook THE SCIENTIFIC METHOD 1. Research Background literature research about a topic of interest 2. Identification of a problem Determine a problem (with regards to the topic)
Dog River Watershed Management Plan
 Dog River Watershed Management Plan Preliminary Water Quality Data Analysis Doug Robison, PWS ESA is where solutions and service meet. Water Quality - Regulatory Primer Designated Use Categories Swimming
PREDICTED EFFECTS OF EXTERNAL LOAD REDUCTIONS AND IN-LAKE TREATMENT ON WATER QUALITY IN CANYON LAKE A SUPPLEMENTAL SIMULATION STUDY
 PREDICTED EFFECTS OF EXTERNAL LOAD REDUCTIONS AND IN-LAKE TREATMENT ON WATER QUALITY IN CANYON LAKE A SUPPLEMENTAL SIMULATION STUDY FINAL REPORT Submitted to: Lake Elsinore-San Jacinto Watershed Authority
Environmental Flows Process in Texas
 Environmental Flows Process in Texas Suzy Valentine, P.E., CFM Association of Western States Engineers Spring Workshop May 2011 Texas Water Rights Historical Background Key Milestones Recent Initiatives
HYPOXIA Definition: ~63 µm; 2 mg l -1 ; 1.4 ml l -1 ; 30 %
 HYPOXIA Definition: ~63 µm; 2 mg l -1 ; 1.4 ml l -1 ; 30 % Consequences of hypoxia Reduce habitat for living resources Change biogeochemical processes P released from sediments Denitrification reduced
Channel Islands Harbor. Water Quality Event June & July, 2018
 Channel Islands Harbor Water Quality Event June & July, 2018 Dr. David A. Caron Presented by: Professor of the Department of Biological Sciences, USC (since 1999) Chief Science Officer of Aquatic EcoTechnologies,
Long-Term Volunteer Lake Monitoring in the Upper Woonasquatucket Watershed
 Long-Term Volunteer Lake Monitoring in the Upper Woonasquatucket Watershed Linda Green URI Watershed Watch 1-87-95, lgreen@uri.edu WATER QUALITY IS A REFLECTION OF THE ACTIVITIES IN THE LANDS AND WATERS
Instream Flows in the San Antonio River Basin From Science to Environmental flow Standards. Steven J. Raabe, P.E
 Instream Flows in the San Antonio River Basin From Science to Environmental flow Standards Steven J. Raabe, P.E October 26, 2012 Keys to Success Mandated Processes Science Compatible Schedules Stakeholder
Chemical and Physical Analysis of the Cape Fear Estuary
 The Cape Fear River Chemical and Physical Analysis of the Cape Fear Estuary The Cape Fear River (CFR), the most industrialized of all North Carolina s rivers, winds for over miles through the heart of
Upper Mississippi River Lake Pepin Modeling Lake Pepin Municipal Sector Meeting August 6, 2008
 Upper Mississippi River Lake Pepin Modeling Lake Pepin Municipal Sector Meeting August 6, 2008 Lake Pepin Photo by Guy Schmickle Overview Fundamentals Why model? What is a model? Model Development How
Seagrass Health in Texas
 Seagrass Health in Texas A Comprehensive Monitoring Program Florida Museum of Natural History Harte Institute Florida Museum of Natural History Prepared by Susan E. Linn Marine Science Department University
Dead-Zones and Coastal Eutrophication: Case- Study of Chesapeake Bay W. M. Kemp University of Maryland CES Horn Point Laboratory Cambridge, MD
 Dead-Zones and Coastal Eutrophication: Case- Study of Chesapeake Bay W. M. Kemp University of Maryland CES Horn Point Laboratory Cambridge, MD Presentation to COSEE Trends Orientation at UMCES HPL 4 August
Nutrients & Algal Blooms Developing water quality standards for the James River.
 Nutrients & Algal Blooms Developing water quality standards for the James River. Dr. Paul A. Bukaveckas and Dr. Joseph Wood Department of Biology Center for Environmental Studies http://wp.vcu.edu/jamesriver/
The Dead Zone. Use the notes provided (attached to this sheet) to answer the following questions.
 to answer the following questions.") The Dead Zone Use the notes provided (attached to this sheet) to answer the following questions. 1. Re-define Eutrophication: 2. What are the risks associated with an excess of Nitrogen? 3. What is a Dead
The Dead Zone Use the notes provided (attached to this sheet) to answer the following questions. 1. Re-define Eutrophication: 2. What are the risks associated with an excess of Nitrogen? 3. What is a Dead
St. Lucie Estuary: Analysis of Annual Cycles and Integrated Water Column Productivity
 St. Lucie Estuary: Analysis of Annual Cycles and Integrated Water Column Productivity Tom Gallo, Malcolm Pirnie Inc. Clifton Bell, Malcolm Pirnie Inc. Peter Doering, South Florida Water Management District
Big Bend Model. Wayne Magley Watershed Evaluation and TMDL Section FDEP. March 7, 2016
 Big Bend Model Wayne Magley Watershed Evaluation and TMDL Section FDEP March 7, 2016 BACKGROUND As outlined in the EPA November 30, 2012 document Methods and Approaches for Deriving Numeric Criteria for
THE HARMFUL IMPACT ON ALGAL BLOOMS BY NUTRIENT SOURCES AND CONSEQUENCES FOR EUTROPHICATION
 International Journal of Production Technology and Management (IJPTM) Volume 6, Issue 2, July-Dec 2015, pp. 21-25, Article ID: IJPTM_06_02_004 Available online at http://www.iaeme.com/ijptm/issues.asp?jtype=ijptm&vtype=6&itype=2
Spatio-Temporal Dynamics of SAV Abundance and Water Quality in the Mangrove Lakes Region of Florida Bay
 Spatio-Temporal Dynamics of SAV Abundance and Water Quality in the Mangrove Lakes Region of Florida Bay Thomas A. Frankovich 1, James W. Fourqurean 1, Douglas Morrison 2 1 Florida International University
Protecting & Restoring Local Waters and the Chesapeake Bay
 Protecting & Restoring Local Waters and the Chesapeake Bay Restore America s Estuaries National Conference Gregory Barranco Chesapeake Bay Program Office November 2010 The Chesapeake Bay and Watershed
Development of Nutrient Criteria for Wyoming Streams and Lakes
 Development of Nutrient Criteria for Wyoming Streams and Lakes Eric Hargett Wyoming Department of Environmental Quality Water Quality Division Watershed Protection Program Monitoring Program Wyoming Nutrient
The Role of Midwestern Agriculture in Gulf of Mexico Hypoxia. Peter Scharf Nutrient Management Specialist MU Agronomy Extension
 The Role of Midwestern Agriculture in Gulf of Mexico Hypoxia Peter Scharf Nutrient Management Specialist MU Agronomy Extension What is hypoxia? Hyp = low Oxia = oxygen Hypoxia = low oxygen defined as less
Long Island Sound Nitrogen Reduction Strategy Overview Public Webinar November 8, 2017
 Long Island Sound Nitrogen Reduction Strategy Overview Public Webinar November 8, 2017 Photo Credit: CTDEEP/Hammonasset Beach State Park, CT Presentation Overview Nitrogen strategy overview Outline technical
Using GIS to Visualize Impaired Dissolved Oxygen Conditions in Texas and Hypothesize Potential Contributing Factors
 Using GIS to Visualize Impaired Dissolved Oxygen Conditions in Texas and Hypothesize Potential Contributing Factors Jennifer Wang CE 394K: GIS in Water Resources Dr. David Maidment 1 I. Background A. Texas
Water Supply Discussion - Demands Inflows/Pass-Thru Requirements of Agreed Order. Council Presentation August 30, 2016
 Water Supply Discussion - Demands Inflows/Pass-Thru Requirements of Agreed Order Council Presentation August 30, 2016 1 Today s Presentation Alternative Demand Projection Kristi Shaw (HDR) Fresh Water
Chromophoric Dissolved Organic Matter (CDOM) in United States Estuaries. Robert F. Chen, Bernie Gardner, Wei Huang & Francesco Peri
 in United States Estuaries. Robert F. Chen, Bernie Gardner, Wei Huang & Francesco Peri") Chromophoric Dissolved Organic Matter (CDOM) in United States Estuaries Robert F. Chen, Bernie Gardner, Wei Huang & Francesco Peri CDOM in Coastal Waters Chromophoric Dissolved Organic Matter (CDOM) Absorbs
Chromophoric Dissolved Organic Matter (CDOM) in United States Estuaries Robert F. Chen, Bernie Gardner, Wei Huang & Francesco Peri CDOM in Coastal Waters Chromophoric Dissolved Organic Matter (CDOM) Absorbs
Southern California Bight 2008 Regional Monitoring Program: Volume VIII. Estuarine Eutrophication
 Technical Report 0711 Southern California Bight 2008 Regional Monitoring Program: Volume VIII. Estuarine Eutrophication K. McLaughlin 1, M. Sutula 1, L. Busse 2, S. Anderson 3, J. Crooks 4, R. Dagit 5,
Environmental Flows Allocation Process in Texas. Kevin Mayes Texas Parks and Wildlife Department March 2010
 Environmental Flows Allocation Process in Texas Kevin Mayes Texas Parks and Wildlife Department March 2010 Senate Bill 3-2007 Environmental Flow Regime A schedule of flow quantities that reflects seasonal
 Atmospheric Nitrogen Deposition: An increasingly Important Source of new Nitrogen Supporting Coastal Eutrophication H Paerl 1, D. Whitall 2 and R. Dennis 3 1 UNC-CH CH Institute of Marine Sciences, Morehead
Environmental Flow Regimes. Joe Trungale s presentation to the Science Advisory Committee March 4, 2009
 Overlays to Hydrology-Based Environmental Flow Regimes Joe Trungale s presentation to the Science Advisory Committee March 4, 2009 Overlays - Definition Application of analysis to validate or refine flow
Nitrogen Management through Land Use. Holly Greening, Tampa Bay Estuary Program July 2010
 Nitrogen Management through Land Use Holly Greening, Tampa Bay Estuary Program July 2010 Importance of Water Quality Management Eutrophication (excess nutrients) common to many estuaries, streams and lakes
Fig. 1. Map for location
 The Asian Journal of Biology Education (2002) Number 1 3 Faculty of Education, Shiga University 2--1 Hiratsu, Otsu, 20-0862. Japan. Introduction Lake Biwa (Fig. 1) is the largest lake in Japan and one
Numeric Nutrient Criteria Update
 Numeric Nutrient Criteria Update Kevin Carter South Florida Water Management District Office Of Everglades Policy and Coordination 561-682-6949, kecarter@sfwmd.gov Palm Beach County Water Resources Task
Linking Ecosystem Indicators to Ecosystem Services
 Linking Ecosystem Indicators to Ecosystem Services Christine Davis* G. Van Houtven, C. Mansfield, M. Cutrofello, and M. O Neil *Health and Environmental Impacts Division, OAQPS U.S. Environmental Protection
Understanding Agriculture And Clean Water
 1 IOWA CHAPTER Understanding Agriculture And Clean Water Clean Water Act Established in 1972, the Clean Water Act (CWA) created the basic structure for regulating discharges of pollutants into water bodies
EXECUTIVE SUMMARY LEGISLATIVE REPORT 2011
 EXECUTIVE SUMMARY LEGISLATIVE REPORT 2011 January, 2012 2011 RiverNet Program RIVERNET: Continuous Monitoring of Water Quality in the Neuse River Basin Dr. William J. Showers Dept. of Marine, Earth & Atmospheric
Climate Change Impacts for the Central Coast and Hunter Regions
 Climate Change Impacts for the Central Coast and Hunter Regions http://www.ozcoasts.gov.au/climate/ima ges/f1_risks.jpg Peter Smith 1 Climate change will have increasing impacts on a wide range of natural
The Lower Galveston Bay Watershed: Potential Oil Spill Impacts
 The Lower Galveston Bay Watershed: Potential Oil Spill Impacts Lisa Gonzalez Jim Lester Houston Advanced Research Center July 13, 2010 Oil Near Mississippi Delta, July 4 Source: NASA MODIS Local Perspective
ONLINE SUPPORTING MATERIAL
 ONLINE SUPPORTING MATERIAL for the paper bg-22-78: Simulating the effects of phosphorus limitation in the Mississippi and Atchafalaya River plumes by A. Laurent, K. Fennel, J. Hu and R. Hetland. 5 Patterns
BIOLOGY TERC.UCDAVIS.EDU
 10 Algae growth (primary productivity) Yearly since 1959 Primary productivity is a measure of the rate at which algae produce biomass through photosynthesis. It was first measured at Lake Tahoe in 1959
Chapter Seven: Factors Affecting the Impact of Nutrient Enrichment on the Lower Estuary
 Chapter Seven: Factors Affecting the Impact of Nutrient Enrichment on the Lower Estuary As presented in Chapter Six, the water quality data for the upper stations of the tidal freshwater Potomac Estuary
Joint Cruise Methodology
 Joint Cruise Methodology Alexander Mikaelyan & Tamara Shiganova Batumi, 22 May The main goal of the Joint Cruises To provide ecosystem monitoring of the open waters of the Black Sea on inter-annual and
2010 DEAD ZONE ONE OF THE LARGEST EVER. 1 August 2010, from Cocodrie, Louisiana
 2010 DEAD ZONE ONE OF THE LARGEST EVER 1 August 2010, from Cocodrie, Louisiana The area of hypoxia, or low oxygen, in the northern Gulf of Mexico west of the Mississippi River delta covered 20,000 square
What Characterizes the Taninim Estuary in Relation to Other Mediterranean Microestuaries in Israel and Implications for the River rehabilitation
 What Characterizes the Taninim Estuary in Relation to Other Mediterranean Microestuaries in Israel and Implications for the River rehabilitation Sarig Gafny (sarig@ruppin.ac.il) The RIME team: Gitai Yahel,
Nutrient Dynamics at the Estuarine Sediment-Water Interface during Large Pulses of High Nitrate Mississippi River Water
 Nutrient Dynamics at the Estuarine Sediment-Water Interface during Large Pulses of High Nitrate Mississippi River Water ERIC ROY, JOHN WHITE, SIBEL BARGU, EMILY SMITH, & NATHAN NGUYEN LOUISIANA STATE UNIVERSITY
CHAPTER 15 WATER POLLUTION. INTO THE GULF Researchers try to pin down what s choking the Gulf of Mexico
 CHAPTER 15 WATER POLLUTION INTO THE GULF Researchers try to pin down what s choking the Gulf of Mexico SAVING THE BAY Teams of researchers try to pin down what s choking the Chesapeake Water pollution
Technical Tasks to Support Revision of the TMDL 1) Update lake models to account for slow decay rate for phosphorus (Anderson) 2) Update Lake
 Update lake models to account for slow decay rate for phosphorus (Anderson) 2) Update Lake") Technical Tasks to Support Revision of the TMDL 1) Update lake models to account for slow decay rate for phosphorus (Anderson) 2) Update Lake Elsinore model to include interaction between zooplankton and
Technical Tasks to Support Revision of the TMDL 1) Update lake models to account for slow decay rate for phosphorus (Anderson) 2) Update Lake Elsinore model to include interaction between zooplankton and
Monitoring Update April 1, Northeast Aquatic Research George Knoecklein Hillary Kenyon Sabina Perkins
 Monitoring Update April 1, 215 Northeast Aquatic Research George Knoecklein Hillary Kenyon Sabina Perkins Lake Monitoring Approach for 214 Tonight's discussion will focus on in-lake aspects: Assessment
Coastal Ecosystems: Saving Chesapeake Bay. Note the highest pigment concentrations (red) in coastal regions, especially estuaries
 in coastal regions, especially estuaries") Coastal Ecosystems: Saving Chesapeake Bay Note the highest pigment concentrations (red) in coastal regions, especially estuaries Coastal Ecosystems: human impacts Humans severely impact the coastal zone
Coastal Ecosystems: Saving Chesapeake Bay Note the highest pigment concentrations (red) in coastal regions, especially estuaries Coastal Ecosystems: human impacts Humans severely impact the coastal zone
Watershed and Water Quality Modeling to Support TMDL Determinations Lake Oologah
 Watershed and Water Quality Modeling to Support TMDL Determinations Lake Oologah 26 th Annual Conference Oklahoma Clean Lakes and Watersheds Association (OCLWA) April 5-6, 2017 Stillwater, Oklahoma Lake
Nitrogen Cycling, Primary Production, and Water Quality in the New River Estuary. Defense Coastal/Estuarine Research Program (DCERP)
") Nitrogen Cycling, Primary Production, and Water Quality in the New River Estuary Defense Coastal/Estuarine Research Program (DCERP) Introduction: A key theme of the ongoing DCERP program is monitoring
Nitrogen Cycling, Primary Production, and Water Quality in the New River Estuary Defense Coastal/Estuarine Research Program (DCERP) Introduction: A key theme of the ongoing DCERP program is monitoring
Little Cypress Bayou Special Study - Subwatershed 1.10
 - Subwatershed 1.1 Sabine River Authority of Texas August 31, 21 Prepared in Cooperation with the Texas Natural Resource Conservation Commission Under the Authorization of the Texas Clean Rivers Act Table
Inside of forest (for example) Research Flow
 Research Flow") Study on Relationship between Watershed Hydrology and Lake Water Environment by the Soil and Water Assessment Tool (SWAT) Shimane University Hiroaki SOMURA Watershed degradation + Global warming Background
Study on Relationship between Watershed Hydrology and Lake Water Environment by the Soil and Water Assessment Tool (SWAT) Shimane University Hiroaki SOMURA Watershed degradation + Global warming Background
Cooperative Monitoring Program nutrient monitoring results
 Cooperative Monitoring Program nutrient monitoring results Nutrient Water Quality Symposium, Santa Maria Central Coast Water Quality Preservation, Inc. Executive Director: Kirk Schmidt (831-750-5449, kschmidt@ccwqp.org)
Cultural accelerated by anthropogenic activities
 EUTROPHICATION IMPLICATIONS OF N & P Intent of this lecture? Link our discussions of terrestrial N & P dynamics with its influences on receiving water bodies How the relative amounts of N & P can influence
Narrative Water Quality Objective
 Narrative Water Quality Objective Waste discharges shall not contribute to excessive algal growth in inland surface receiving waters. (Basin Plan, 1995, pg. 4-5) Excessive is not defined No numeric standard
ECOLOGICAL DISTURBANCES IN THE ST. LUCIE ESTUARY AND THE SOUTHERN INDIAN RIVER LAGOON, EASTERN FLORIDA, ELUCIDATED THROUGH MACROBENTHIC MONITORING
 ECOLOGICAL DISTURBANCES IN THE ST. LUCIE ESTUARY AND THE SOUTHERN INDIAN RIVER LAGOON, EASTERN FLORIDA, ELUCIDATED THROUGH MACROBENTHIC MONITORING Bjorn Tunberg Scott Jones, Sherry Reed, Michelle Stephens
Texas Environmental Flows Process Pursuant to SB3. Sam Vaugh, P.E. August 18, 2010
 Texas Environmental Flows Process Pursuant to SB3 Sam Vaugh, P.E. August 18, 2010 Topics of Discussion 1) Structure and products of Texas Environmental Flows Process established in 2007 by SB3 of the 80
Real time Water Quality Monitoring
 Real time Water Quality Monitoring Robert Schuster New Jersey Department of Environmental Protection Water Monitoring and Standards Bureau of Marine Water Monitoring Presented at NJWMCC Meeting September
1.1 BACKGROUND AND OVERVIEW OF THE PROJECT
 EXECUTIVE SUMMARY 1.1 BACKGROUND AND OVERVIEW OF THE PROJECT This project investigated phytoplankton chlorophyll a (chl-a) concentration and community composition along a spatio-temporal scale in two temporarily
2009/2010 Water Column Overview, Red Tide Update, and Bay Eutrophication Model 2010 Results. OMSAP Meeting June 30, 2011.
 29/21 Water Column Overview, Red Tide Update, and Bay Eutrophication Model 21 Results OMSAP Meeting June 3, 211 Scott Libby Contributions from D. Anderson, D. Borkman, C.S. Chen, R. Geyer, and C. Oviatt
Water Monitoring in Spa Creek: A Summary
 Water Monitoring in Spa Creek: A Summary Written by: Alexis Jones & Blake Harden Edited by: Hannah Krauss Water monitoring is very important in order to determine the health of the Chesapeake Bay and its
Human nutrient over-enrichment in coastal waterways and deltas; There s a long history
 www.marine.unc.edu/paerllab Human nutrient over-enrichment in coastal waterways and deltas; There s a long history Salomon van Ruysdael 1648 1 RN (ton/yr) Mississippi R. Basin Choptank R, Chesapeake Bay
Figure 1. Platte River Sub-Watersheds and Monitoring Locations.
 Figure 1. Platte River Sub-Watersheds and Monitoring Locations. 10 2 1 9 7 BL Pond 8 Hatchery 6 3 5 4 1 Platte River at Fewins Rd 6 B. Creek to Hatchery Spring 2 Platte River at Stone Bridge 7 Platte River
RIVER SEDIMENTS AND COASTAL FISH PRODUCTION: WHAT ABOUT THE MEKONG?
 people Ÿ science Ÿ environment Ÿ partners! RIVER SEDIMENTS AND COASTAL FISH PRODUCTION: WHAT ABOUT THE MEKONG? Eric BARAN Eric GUERIN Project A Climate Resilient Mekong: Maintaining the Flows that Nourish
The relevance of sediments in eutrophic systems: a comparison of two European coastal lagoons (Óbidos and Lesina)
") The relevance of sediments in eutrophic systems: a comparison of two European coastal lagoons (Óbidos and Lesina) Carlos Vale 1,3, Patrícia Pereira 1, M. João Botelho 1, Elisabetta Ballarini 2 and Athanasios
The relevance of sediments in eutrophic systems: a comparison of two European coastal lagoons (Óbidos and Lesina) Carlos Vale 1,3, Patrícia Pereira 1, M. João Botelho 1, Elisabetta Ballarini 2 and Athanasios
Linking Water Quality and Migratory Fish Passage to Economic Contributions of Fisheries and Water Use
 Insert Your Image Here Linking Water Quality and Migratory Fish Passage to Economic Contributions of Fisheries and Water Use Project/Grant Objective 1. Delineate impacts to drinking water quality from
Lake & Watershed Resource Management Associates P O Box 65; Turner, ME
 Lake & Watershed Resource Management Associates P O Box 65; Turner, ME 207-336-2980 LWRMA@megalink.net 2008 Baseline Water Quality Monitoring and Assessment of Pemaquid and Biscay Ponds At the request
Bolton Town Hall February 24, George Knoecklein Northeast Aquatic Research Mansfield, CT
 Bolton Town Hall February 24, 214 George Knoecklein Northeast Aquatic Research Mansfield, CT Working Hypothesis 1. Deep drawdowns of Middle Bolton Lake fueled high growth rates of naiad in Lower Bolton
Impacts of Rainfall Events on Water Quality in the Houston Metro Area
 Impacts of Rainfall Events on Water Quality in the Houston Metro Area Hanadi Rifai and Anuradha Desai Civil and Environmental Engineering University of Houston, Houston, TX Acknowledgments TCEQ EPA Houston
Concepts of Coastal Deltaic Floodplain as Newly Emergent Ecosystems
 Concepts of Coastal Deltaic Floodplain as Newly Emergent Ecosystems Robert R. Twilley Department of Oceanography and Coastal Sciences Director of Louisiana Sea Grant College Program LSU Ecosystems of Coastal
MONITORING RECOMMENDATIONS
 MONITORING RECOMMENDATIONS 9 The purpose of this section is to provide general guidance on proposed monitoring activities to provide information for several of the recommended indicators and key uncertainties
Younjoo Lee and Walter Boynton. Horn Point Laboratory and Chesapeake Biological Laboratory University of Maryland Center for Environmental Science
 Younjoo Lee and Walter Boynton Horn Point Laboratory and Chesapeake Biological Laboratory University of Maryland Center for Environmental Science 1 Data and Method Summer Hypoxia Dissolve Oxygen Patterns