ANNUAL PLATTE RIVER SURFACE WATER FLOW SUMMARY
|
|
|
- Andrea McLaughlin
- 6 years ago
- Views:
Transcription


1 ANNUAL PLATTE RIVER SURFACE WATER FLOW SUMMARY 4/3/213 Platte River Recovery Implementation Program 213 ANNUAL SURFACE WATER FLOW SUMMARY DRAFT Prepared by staff of the Platte River Recovery Implementation Program th Avenue, Suite 6 Kearney, NE 68845
2 PLATTE RIVER RECOVER IMPLEMENTATION PROGRAM ANNUAL PLATTE RIVER SURFACE WATER FLOW SUMMARY DRAFT Contents 1. INTRODUCTION CENTRAL PLATTE RIVER SURFACE WATER SUMMARY BACKGROUND CURRENT YEAR ANNUAL SUMMARY GRAND ISLAND FLOW SUMMARY, 27 TO PRESENT GRAND ISLAND HISTORICAL FLOW SUMMARY, LAKE MCCONAUGHY ENVIRONMENTAL ACCOUNT SUMMARY, 27 TO PRESENT SHORT DURATION HIGH FLOW SUMMARY, 27 TO PRESENT APPENDIX A: CENTRAL PLATTE RIVER SURFACE WATER SUMMARY, 27 TO ANNUAL SUMMARY ANNUAL SUMMARY ANNUAL SUMMARY ANNUAL SUMMARY ANNUAL SUMMARY APPENDIX B: COMPARISON OF ANNUAL HYDROLOGIC CONDITION FLOW THRESHOLDS APPENDIX C: GAGE LOCATION MAP APPENDIX D: GLOSSARY OF TERMS Page 2 of 38
3 1. INTRODUCTION This document provides a summary of Central Platte River flows through the Platte River Recovery Implementation Program (PRRIP or the Program) associated habitat, spanning from Lexington to Chapman, Nebraska, through the current calendar year. A one page report follows a brief overview of the annual flow and peak flow events, United States Fish and Wildlife Service (USFWS)target flow accounting, and the Lake McConaughy Environmental Account (EA or McConaughy EA) for the current year. Annual summaries for previous years can be found in the APPENDIX A. In addition to the annual summary, an overview of river flow at the Grand Island gage, Lake McConaughy Environmental Account operation, and Short Duration High Flow (SDHF) events is provided from the Program s beginning in 27 through the Present. The purpose of this document is to provide an overview of the surface water behavior in the Central Platte River and to inform management decisions related to flow releases. This document is not intended to be used to calculate or track the Program s Water Action Plan (WAP) project scoring. This document will be kept as a working draft and will be updated annually or more frequently if needed. 2. CENTRAL PLATTE RIVER SURFACE WATER SUMMARY BACKGROUND The various aspects of the surface water report are explained below. ANNUAL FLOW AND PEAK FLOW EVENTS Annual flow is summarized for three gages in the associated habitat, located near Overton, Kearney, and Grand Island, Nebraska. See APPENDIX C for a map of gage locations. The Overton gage captures the flow in the Platte River near the upstream end of the associated habitat, the Kearney gage indicates flow in the middle of the area, and the Grand Island gage captures flow toward the downstream end of the reach. Flow at the Grand Island gage is shown in the GRAND ISLAND GAGE HYDROGRAPH AND USFWS TARGET FLOWS figure. Average daily flow data from all three gages are provided by the United States Geological Survey (USGS) on the website Provisional data will be updated as approved data becomes available. Average annual flow at each gage is shown in the AVG ANNUAL FLOW column. The average annual flow is calculated by averaging daily flows over the calendar year (Equation 1). The highest instantaneous flow recorded at each gage during the course of the year is shown in the INSTANTANEOUS PEAK FLOW column along with date the peak flow occurred in the DATE OF PEAK FLOW column. The TYPE OF YEAR DESIGNATION column indicates the annual hydrologic condition designation. It is determined by the average annual flow at the Grand Island gage and is discussed in more detail in the TARGET FLOW ACCOUNTING section below. Page 3 of 38
4 TARGET FLOW ACCOUNTING The United States Fish and Wildlife Service (USFWS) developed target flows for the associated habitat, shown in the Water Plan Reference Materials of the Program Document 1, that vary based on hydrologic condition designations. The USFWS flow targets were developed for the Grand Island gage near the end of the Program s associated habitat. Hydrologic condition designations were developed by the USFWS and are determined on an annual and real time basis with the possibility of a wet, normal, or dry designation. Annual designations are based on the average annual Grand Island gage flow from 1947 to 1994, where years with the highest 33% of average annual flow are designated as wet, years with the lowest 25% of average annual flow are designated as dry, and years with flows between these ranges are designated as normal. For further discussion of annual hydrologic condition designation, see APPENDIX B. Comparing the average annual Grand Island gage flow for the year with the wet, normal, and dry thresholds determines the target flow regime for the year. The methodology behind real time designations is described in the JAWRA paper 2 by Anderson & Rodney, with target flow periods lasting for as little as seven days to as long as three months. Real time designations may vary between wet, normal, and dry over the course of the year, and the corresponding real time target flows are adjusted accordingly. The Program calculates real time hydrologic designations according to the Anderson & Rodney paper, with the methodology specifically described in the Program s Executive Director s (ED) office memo titled Hydrologic Conditions Calculations 3. Deficits to target flows are calculated by comparing flow at the Grand Island gage to the USFWS target flows. The USFWS estimated a mean annual historic deficit to target flows of 417, af/year during wet and normal years and 333,1 af/year during dry years 4. By the end of the first increment in 219, the Program aims to reduce deficits to target flows an average of 13, to 15, acre feet (af) per year. This summary describes deficits to both the annual and real time 5 target flows for each year, identified in the TARGET CATEGORY column. The total amount of water that flowed by each gage location over the year is shown in the TOTAL FLOW column and is calculated by summing the average daily flow (Equation 2). The total flow provides the basis for the calculations of deficits to target flows. A summation of the daily target flows over the year provides the total annual volume of target flow, shown in the TARGET VOLUME column (Equation 3). Deficits are calculated by comparing the average daily flow at the Grand Island gage with the target flow for that date. If the flow is below the target flow, a deficit exists (Equation 4). The annual sum of daily deficits is shown in the TOTAL DEFICIT column (Equation 5). The total deficit is broken down into two 1 Table A 5 in Attachment 5 Section 11 in the Platte River Recovery Implementation Program Document dated December 7, Characterization of Hydrologic Conditions to Support Platte River Species Recovery Efforts by Don Anderson (formerly with the U.S. Fish and Wildlife Service) and Mark Rodney; published in the October 26 Journal of the American Water Resources Association 42(5): This methodology was published before an August September period methodology was developed. 3 PRRIP Executive Directors Office Memorandum, Hydrologic Conditions Calculations, updated May 3, Table A 4 in Attachment 5 Section 11 in the Platte River Recovery Implementation Program Document dated December 7, The semi monthly to monthly target flows in column 4 of Table A5 were used to develop the figures and deficits in this summary rather than the monthly target flows in column 8 of Table A5, which are averages of the semimonthly flows in column 4. The target flows in column 8 of Table A5 are used with a modeled hydrograph to calculate project scores. Page 4 of 38
5 types of deficits: deficits due to shortages in annual flow and deficits that could be avoided by retiming available annual flow. The VOLUME DEFICIT column shows the deficits resulting from shortages in annual flows and is calculated by subtracting the TOTAL FLOW from the TARGET VOLUME column (Equation 6). The TIMING DEFICIT column shows the deficits that could theoretically be avoided by retiming flows. It is calculated by subtracting the VOLUME DEFICIT from the TOTAL DEFICIT (Equation 7). The GRAND ISLAND GAGE HYDROGRAPH AND USFWS TARGET FLOWS figure shows the annual and real time target flows overlying the Grand Island hydrograph. Periods of excess to target flows occur when the hydrograph extends above the target flows and periods of deficits to target flows occur when the hydrograph falls below the target flows. The amount of flow from the McConaughy Environmental Account is shown in purple. If data is provisional, such as when ice or equipment errors are present, no flow is shown on the Grand Island gage hydrograph. LAKE MCCONAUGHY ENVIRONMENTAL ACCOUNT A portion of the water in Lake McConaughy is reserved in an environmental account which is managed by the USFWS and can be used to reduce deficits to target flows. Environmental Account operations are described in the Water Plan Reference materials in the Program Document 6. The account receives a portion of the natural inflows into Lake McConaughy and is subject to evaporation and seepage losses. Data for the McConaughy EA is provided by the Central Nebraska Public Power and Irrigation District (CNPPID) and is assumed to be provisional data. Adjustments to the volume of the EA are calculated monthly based on accruals, losses, and releases. Water from the previous year is carried over in the EA; however, the total EA volume cannot exceed 2, af. If Lake McConaughy fills to capacity, the EA is automatically reset to 1, af, regardless of that year s releases, contributions, or carryover from previous years. In the annual summaries, the losses for the EA are not shown if the account resets. The CHANGE IN VOLUME of the EA is the VOLUME AT START OF YEAR subtracted from the VOLUME AT END OF YEAR (Equation 8). The ACCRUALS column shows additions to the account that include storable natural inflows (SNI) and other water, such as transfers from the Pathfinder Environmental Account and Net Controllable Conserved Water (NCCW) credits. SNI is calculated as 1% of the storable natural inflows to Lake McConaughy but cannot exceed 1% of the available storage space in the reservoir. The EA does not receive SNI from May through September. Transfers into the EA come from the Pathfinder Environmental Account or the Pathfinder Municipal Account, typically occur in September, reflect the amount of water that reaches Lake McConaughy, and may be subject to transit losses from their original location. Net Controllable Conserved Water (NCCW) is credited to the EA on October 1 st of each year. LOSSES include both evaporation and seepage losses and are calculated monthly based on the percentage of the total reservoir volume the EA comprises (Equation 9). Seepage gains to the reservoir are not counted toward EA accruals. RELEASES from the EA are determined by the USFWS and are usually aimed at reducing deficits to target flows or to achieve short duration high flows (SDHF). 6 Attachment 5 Section 5 in the Platte River Recovery Implementation Program Document dated December 7, 25. Page 5 of 38
6 The MCCONAUGHY EA AND REAL TIME DEFICITS AT GRAND ISLAND GAGE figure shows the EA volume, the releases made from the EA, and the deficits to target flows at the Grand Island gage. The volume changes in the EA at the end of each month are a result of the monthly adjustment to the account. EA information in this section is presented by calendar year and can be compared with the Grand Island hydrograph and deficit calculations. It cannot be directly compared with EA information in Section 5, LAKE MCCONAUGHY ENVIRONMENTAL ACCOUNT SUMMARY, 27 TO PRESENT, which presents EA information by water year (WY). ANNUAL FLOW AND PEAK FLOW EVENTS (rate based calculations) AVERAGE ANNUAL FLOW = AVERAGE(AVERAGE DAILY GAGE FLOW) (Equation 1) TARGET FLOW ACCOUNTING (volume based calculations) TOTAL FLOW = SUM(AVERAGE DAILY GAGE FLOW) (Equation 2) TARGET VOLUME = SUM(DAILY TARGET FLOW) (Equation 3) DAILY DEFICIT= DAILY TARGET FLOW AVERAGE DAILY GAGE FLOW (Equation 4) TOTAL DEFICIT = SUM(DAILY DEFICITS) (Equation 5) VOLUME DEFICIT = TARGET VOLUME TOTAL FLOW (Equation 6) TIMING DEFICIT= TOTAL DEFICIT VOLUME DEFICIT (Equation 7) LAKE MCCONAUGHY ENVIRONMENTAL ACCOUNT (volume based calculations) CHANGE IN VOLUME=VOLUME AT START OF YEAR VOLUME AT END OF YEAR (Equation 8) LOSSES=SUM(SEEPAGE LOSSES)+SUM(EVAPORATION LOSSES) (Equation 9) Page 6 of 38
7 3. CURRENT YEAR ANNUAL SUMMARY The annual summary for the current year is presented in this section. Refer to APPENDIX A for annual summaries of previous years. 212 ANNUAL SUMMARY ANNUAL FLOW PEAK FLOW EVENTS The annual average gage flow at Grand Island based on current provisional data is 11 cfs, resulting in a NORMAL annual hydrologic condition designation. The NORMAL designation is largely a result of high flows during the first part of the year. The flow conditions from June through December were extremely low, as reflected by the real time hydraulic conditions, shown in Table 1. The real time designations matched the annual designation 33% of the year. The peak instantaneous flow at the Grand Island gage occurred on January 26 during the early high flows. The peak flows for the Overton and Kearney gages have not been provided by the USGS at this time; however, they are expected to occur near the same time as the Grand Island peak. Peak event volumes at all three gages correspond to this event. Table Real time hydrologic condition designations Period Condition Target Flow Period Condition Target Flow Jan 1 Jan 31 NORMAL 1 May 2 May 26 DRY 8 Feb 1 Feb 14 NORMAL 18 May 27 June 2 DRY 8 Feb 15 Mar 15 NORMAL 335 June 21 Sept 15 DRY 8 Mar 16 Mar 22 NORMAL 18 Sept 16 Sept 3 DRY 6 Mar 23 May 1 NORMAL 24 Oct 1 Nov 15 DRY 13 May 11 May 19 DRY 8 Nov 16 Dec 31 DRY 6 ICE GAGE READINGS The Grand Island gage had Ice readings from December 9 through December 31. No flow is shown on the Grand Island gage hydrograph during this time and these flows are not accounted for in the annual average flow. The gage data is provisional and will be updated when approved data becomes available. ENVIRONMENTAL ACCOUNT Several releases were made from the McConaughy EA over the course of the year, with releases in February, March, April, July, August, September, and October. The account received 314 af from Net Controllable Conserved Water (NCCW) and 24,3 af from Wyoming Pathfinder transfers, including water from the Pathfinder EA Account and the Pathfinder Municipal Account. Refer to SECTION 6 for more information on McConaughy EA releases. Page 7 of 38
8 212 FLOW AND PEAK FLOW EVENTS GAGE AVG ANNUAL FLOW (CFS) INSTANTANEOUS PEAK FLOW (CFS) DATE OF PEAK FLOW TYPE OF YEAR DESIGNATION OVERTON* 1,14 3,5 Jan. 2 *Povisional KEARNEY* 1,31 3,43 Jan. 26 data GRAND ISLAND* 1,1 3,59 Jan. 26 NORMAL TARGET FLOW ACCOUNTING AT GRAND ISLAND TARGET CATEGORY TOTAL FLOW TARGET VOLUME TOTAL DEFICIT VOLUME DEFICIT TIMING DEFICIT ANNUAL 686,881 1,298,597 71, ,716 9,249 REAL TIME 686, ,51 374,99 262,62 111,479 ICE MCCONAUGHY ENVIRONMENTAL ACCOUNT VOLUME AT START OF YEAR 114,42 ACCRUALS 68,158 VOLUME AT END OF YEAR 9,69 LOSSES 11,135 CHANGE IN VOLUME 24,333 RELEASES 8,969 EA VOLUME, AF 16, 14, 12, 1, 8, 6, 4, 2, 212 MCCONAUGHY EA AND REAL TIME DEFICITS AT GRAND ISLAND GAGE Jan Feb Mar Apr May Jun Jul Aug Sep Oct Nov Dec EA VOLUME ANNUAL DEFICIT REAL TIME DEFICIT EA RELEASES 7, 6, 5, 4, 3, 2, 1, RELEASES AND DEFICITS, AF Page 8 of 38
9 4. GRAND ISLAND FLOW SUMMARY, 27 TO PRESENT Annual Grand Island flow is summarized for each year from the beginning of the Program through the present. The AVG ANNUAL FLOW, INSTANTANEOUS PEAK FLOW, DATE OF PEAK FLOW, and TYPE OF YEAR DESIGNATION all correspond to the same columns described in Section 2. INSTANTANEOUS MIN FLOW column shows the lowest flow of the year and the DATE OF MIN FLOW column shows the corresponding date the minimum flow occurred. The GRAND ISLAND GAGE HYDROGRAPH AND USFWS TARGET FLOWS figure shows the Grand Island gage hydrograph from 27 to the present and the annual USFWS target flows. Both the summary table and figure are included to provide year to year flow comparisons as well as indicate general flow trends over the course of the Program s existence. Hydrographs for individual years from 27 to the current year are included for further comparison. Page 9 of 38
10 ANNUAL FLOW AND PEAK FLOW EVENTS YEAR AVG ANNUAL FLOW (CFS) INSTANTANEOUS PEAK FLOW (CFS) DATE OF PEAK FLOW INSTANTANEOUS MIN FLOW (CFS) DATE OF MIN FLOW TYPE OF YEAR DESIGNATION 27 1,121 7,3 Feb Jan. 13 NORMAL 28 1,3 13,6 May Sep. 28 NORMAL 29 1,39 3,54 Apr Sep. 6 NORMAL 21 2,289 8,84 Jun Aug. 31 WET 211 4,224 1,4 Jun. 27 2,75 Mar. 4 WET 212 1,1 3,59 Jan. 26 Jul. 2 NORMAL AVERAGE 1,83 7,878 Apr Jun. 17 NORMAL FLOW, CFS 14, 12, 1, 8, 6, 4, 2, GRAND ISLAND GAGE HYDROGRAPH AND USFWS TARGET FLOWS GAGE FLOW TARGET FLOW* Jan 7 Jan 8 Jan 9 Jan 1 Jan 11 Jan 12 Jan 13 *Target flow based on annual hydrologic condition designation Page 1 of 38
11 FLOW, CFS 12, 1, 8, 6, 4, 2, 27 GRAND ISLAND GAGE HYDROGRAPH AND USFWS TARGET FLOWS, YEAR TYPE: NORMAL GAGE ANNUAL REAL TIME Jan Feb Mar Apr May Jun Jul Aug Sep Oct Nov Dec FLOW, CFS 12, 1, 8, 6, 4, 2, 28 GRAND ISLAND GAGE HYDROGRAPH AND USFWS TARGET FLOWS, YEAR TYPE: NORMAL GAGE ANNUAL REAL TIME Jan Feb Mar Apr May Jun Jul Aug Sep Oct Nov Dec Page 11 of 38
12 12, 1, 29 GRAND ISLAND GAGE HYDROGRAPH AND USFWS TARGET FLOWS, YEAR TYPE: NORMAL GAGE FLOW, CFS 8, 6, 4, 2, ANNUAL REAL TIME Jan Feb Mar Apr May Jun Jul Aug Sep Oct Nov Dec 12, 1, 21 GRAND ISLAND GAGE HYDROGRAPH AND USFWS TARGET FLOWS, YEAR TYPE: WET GAGE FLOW, CFS 8, 6, 4, 2, ANNUAL REAL TIME Jan Feb Mar Apr May Jun Jul Aug Sep Oct Nov Dec Page 12 of 38
13 12, 1, 211 GRAND ISLAND GAGE HYDROGRAPH AND USFWS TARGET FLOWS, YEAR TYPE: WET GAGE FLOW, CFS 8, 6, 4, 2, ANNUAL REAL TIME Jan Feb Mar Apr May Jun Jul Aug Sep Oct Nov Dec FLOW, CFS 12, 1, 8, 6, 4, 212 GRAND ISLAND GAGE HYDROGRAPH AND USFWS TARGET FLOWS, YEAR TYPE: NORMAL GAGE ANNUAL REAL TIME 2, Jan Feb Mar Apr May Jun Jul Aug Sep Oct Nov Dec ICE Page 13 of 38
14 5. GRAND ISLAND HISTORICAL FLOW SUMMARY, Flow at the USGS Grand Island gage was analyzed from 1942, the year that the Kingsley dam became operational, until the present. Both average daily flow and peak instantaneous flow have been recorded over this period. The instantaneous peak flow, as determined by the USGS, is calculated by water year, which spans from October 1 of the previous calendar year through September 3. For example, the water year 211 began on October 1, 21, and ended September 3, 211. For some water years, the instantaneous peak flow occurred in the beginning of the water year (October through December), resulting in two peak flow records for the calendar year and no recorded peak flow for the following calendar year. For these instances, the first peak flow in the calendar year is used for that year and no peak flow is used for the following year. The years without peak flow records are 1966, 2, and data is currently provisional and will be added as it becomes approved by the USGS. PEAKS AND AVERAGES INSTANTANEOUS PEAK FLOWS are evaluated over the period of record and divided according to their annual hydrologic designation in the YEAR TYPE column. The AVERAGE PEAK column shows the average peak flows for the year types alongside the average month the peak occurred in the AVERAGE MONTH OF PEAK column. The MAXIMUM PEAK shows the highest annual peak for the year types alongside the DATE the peak occurred. The smallest annual peak for the year types is shown in the MINIMUM PEAK column with the corresponding DATE of occurrence. Average flow for two different periods is shown in the AVERAGE DAILY FLOW section. The period represents the flow period from the construction of Kingsley dam through the present and the period corresponds to the flow period used for the USFWS annual hydrologic target flows and in the Central Platte River OPSTUDY Model. A difference of only 18 cfs in average daily flow indicates the period closely approximates the behavior of the period. The GRAND ISLAND ANNUAL AVERAGE DAILY FLOW figure shows the average daily flows from 1942 to 211, with the period set off by a separate color scheme. The figure also includes the annual average daily flow for the and the thresholds used by the USFWS for determining annual hydrologic conditions, with wet years falling above the 1,575 cfs line, dry years falling below the 939 cfs line, and normal years falling between the two lines. The GRAND ISLAND GAGE EXCEEDENCE PROBABILIBTY figure shows the probability of flow at Grand Island exceeding various flows along with the corresponding return periods next to the data points. The probabilities range from to 1, with higher numbers indicating a higher probability of flow exceedence, and the flows are calculated from the instantaneous peak flow. The return period is the inverse of the exceedence probability with a 2 year return period corresponding to an exceedence probability of.5 and a 1 year return period corresponding to and exceedence probability of.1. Flow associated with the return period indicates the flow that is likely to occur over the return period, for example, a flow of Page 14 of 38
15 1,821 cfs is likely to occur every 5 years, and a flow of 28,55 cfs is likely to occur every 1 years. The exceedence probability and return periods were calculated using the flood frequency analysis spreadsheet developed by NRCS and based on USGS Bulletin 17B ( ). Page 15 of 38
16 PEAKS AND AVERAGES INSTANTANEOUS PEAK FLOWS AVERAGE DAILY FLOW YEAR TYPE AVERAGE PEAK (CFS) AVERAGE MONTH OF PEAK MAXIMUM PEAK (CFS) DATE MINIMUM PEAK (CFS) DATE PERIOD FLOW (CFS) ALL 7,81 April 23,9 6/3/83 1,41 3/31/ ,579 WET 11,156 May 23,9 6/3/83 4,75 5/6/ ,597 NORMAL 7,385 May 2,3 6/23/47 2,65 5/25/82 DRY 3,72 April 7,51 5/12/5 1,41 3/31/6 FLOW, CFS AVERAGE WET THRESHOLD DRY THRESHOLD GRAND ISLAND ANNUAL AVERAGE DAILY FLOW PROBABILITY OF EXCEEDENCE GRAND ISLAND GAGE EXCEEDENCE PROBABILITY AND RETURN PERIOD 1.1 YR: 2,644 CFS 1.5 YR: 4,764 CFS 2 YR: 6,299 CFS 5 YR: 1,821 CFS 1 YR: 14,354 CFS 25 YR: 19,397 CFS 5 YR: 23,557CFS 1 YR: 28,55 CFS 5, 1, 15, 2, 25, 3, FLOW, CFS Page 16 of 38
17 6. LAKE MCCONAUGHY ENVIRONMENTAL ACCOUNT SUMMARY, 27 TO PRESENT ENVIRONMENTAL ACCOUNT ANNUAL TOTALS AND AVERAGES The McConaughy Environmental Account is operated on a water year (WY) basis, beginning on October 1 of the previous year and ending on September 3, and all averages and totals shown in this section are based on water year, shown in the WATER YEAR column, not calendar year. The AVERAGE VOLUME column shows the average volume of the environmental account over the water year. The YEAR START VOLUME column shows the EA volume on October 1, the start of the water year, the YEAR END VOLUME shows the EA volume on September 3, the end of the water year, and the Δ VOLUME column shows the change in EA volume over the water year. The ACCRUALS column indicates the total amount of water added to the EA during the water year and includes storable natural inflows (SNI), water transfers, and water credits to the account. The EA receives 1% of the SNI coming into Lake McConaughy during the non irrigation season and the account does not receive inflows from May through September. The account cannot store SNI if they exceed 1% of the total available storage capacity of Lake McConaughy. The NATURAL LOSSES column contains the combined water year total of seepage and evaporation losses. Evaporative and seepage losses are calculated as the total McConaughy evaporative and seepage multiplied by the percentage of the total McConaughy volume the EA represents, for example, if the total evaporation and seepage loss for McConaughy in a given month is 1, af and the EA volume is 2% of the total McConaughy volume, then the natural losses for the EA that month would be 2, af. The EA does not accrue water if seepage occurs into Lake McConaughy rather than as a loss out of the lake. The total water year releases are shown in the RELEASES column. The OPERATION LOSSES column shows losses to the EA that result from two types of operational constraints: the inability to store SNI due to available SNI exceeding 1% of Lake McConaughy s total available storage capacity and a reset of the EA resulting from Lake McConaughy reaching effective capacity. The EA is reset to a volume of 1, af if Lake McConaughy reaches its effective capacity. Operation losses in WY211 resulted from SNI exceeding available storage in October, November, and March, as well as the account resetting in March. Operation losses in WY212 resulted from SNI exceeding available storage in October. The LAKE MCCONAUGHY EA MONTHLY AVERAGES, figure show the average monthly values of accruals, releases, natural losses, and operational losses (OP. LOSSES). The accruals column appears alongside a column containing releases, natural losses, and operational losses stack vertically, allowing for a comparison of average gains and losses to the account each month. On average, accruals are high during the first part of the water year (October through April) and little to no accruals occur during the irrigation season (May through September). September accruals are mostly due to water transfers. Natural losses are fairly constant throughout the year while operational losses generally occur in October and March. Page 17 of 38
18 ENVIRONMENTAL ACCOUNT RELEASES Releases from the McConaughy Environmental Account are summarized by release event in this section. The START and STOP dates are shown alongside the release s duration (# OF DAYS). The total RELEASE VOLUME is shown for each release event (note, this differs from the RELEASES column described on the previous page, which shows the annual volume released from the account). The volume of EA water arriving at the three gages in the habitat area is tracked in the VOLUME column under each gage location and the percentage of the total release volume arriving at each gage location is shown in the % OF RELEASE column. The amount of the release that served to reduce deficits to annual target flows at Grand Island is shown in the DEFICIT REDUCTION columns, with the VOLUME column showing the volume of deficit reduction and the % OF RELEASE column showing the percent of the total release volume that served to reduce deficits. The PURPOSE column shows the USFWS stated purpose for the EA release, see Table 2 for descriptions of the abbreviations used in this column. Table 2. EA release purpose abbreviation descriptions Abbreviation Description Explanation WC Whooping Crane Increase flows during whooping crane migration PP Piping Plover Increase predator barrier and macroinvertabrate populations LT Least Tern Increase predator barrier and forage fish populations SP System processes Test and analyze system flows, including flow routing tests, channel maintenance, and wet meadow recharge The EA RELEASES AND VOLUMES AT OVERTON, KEARNEY, AND GRAND ISLAND figure displays the volumes of EA water at the three gage locations alongside the total release volume and the volume of EA water that caused a reduction in deficits to target flows. Page 18 of 38
19 WATER YEAR AVERAGE VOLUME ENVIRONMENTAL ACCOUNT WATER YEAR TOTALS AND AVERAGES YEAR START VOL YEAR END VOL Δ VOLUME ACCRUALS NATURAL LOSSES RELEASES OPERATION LOSSES , ,182 97,49 16,692 32,84 15,122 34, ,894 97,84 84,712 13,92 35,665 18,321 3, ,559 85,26 87,366 2,34 38,116 11,9 22, ,263 87,68 12,6 32,38 42,716 1, ,75 12,6 1, 2,6 53,832 2,43 65, ,542 1, 7,79 29,921 71,354 9,919 78,242 12,783 AVERAGE: 17,591 1,792 93,285 7,58 45,748 11,281 27,615 13,225 14, 12, 1, LAKE MCCONAUGHY EA MONTHLY AVERAGES, ACCRUALS NATURAL LOSSES RELEASES OP. LOSSES VOLUME, AF 8, 6, 4, 2, OCT NOV DEC JAN FEB MAR APR MAY JUN JUL AUG SEP Page 19 of 38
20 RELEASE DATE ENVIRONMENTAL ACCOUNT RELEASES OVERTON KEARNEY GRAND ISLAND DEFICIT REDUCTION START STOP # OF DAYS RELEASE VOL VOLUME % OF RELEASE VOLUME % OF RELEASE VOLUME % OF RELEASE VOLUME % OF RELEASE PURPOSE 6/28/27 8/12/ ,374 29, % 27, % 24,46 71.% 12, % PP,LT 7/2/28 8/5/ ,123 25, % 24, % 17, % 13, % PP,LT 4/9/29 4/16/ ,953 14, % 13, % 13, % 8, % SP 2/22/212 3/6/ ,525 16, % 15, % 14, % 14, % SP 3/29/212 5/1/ ,91 26,85 9.2% 24, % 22, % 22, % WC 7/18/212 7/21/ ,76 1,91 64.% 1, %.%.% PP, LT 8/8/212 9/15/ ,13 2, % 18, % 4, % 4, % PP, LT AVERAGE 25 23,671 19, % 17, % 13, % 1, % VOLUME, AF 35, 3, 25, 2, 15, 1, 5, EA REALEASES AND VOLUMES AT OVERTON, KEARNEY, AND GRAND ISLAND RELEASE VOL OVERTON VOLUME KEARNEY VOLUME GRAND ISLAND VOLUME DEFICIT REDUCTION VOLUME 6/28/27 7/2/28 4/9/29 2/22/212 3/29/212 7/18/212 8/8/212 AVERAGE Page 2 of 38
21 7. PEAK FLOW AND SHORT DURATION HIGH FLOW COMPARISON, 27 TO PRESENT The following summary compares actual peak flow events to the Short Duration High Flow (SDHF) requirements at the Overton gage. SDHF events are defined in the Program s Water Plan 7 as flows of approximately three to five days duration with magnitudes approaching but not exceeding bankfull channel capacity in the habitat reach. The bankfull capacity in the associated habitat is between 5, cfs and 8, cfs. River flow in 27, 29, and 212 did not exceed the lower SDHF threshold. Peak flow in 28 exceeded the 5, cfs threshold for three days and exceeded the 8, cfs threshold for one day. Flows in 21 remained between the 5, cfs and 8, cfs thresholds for 14 consecutive days. In 211, flows exceeded the 5, cfs threshold for a total of 7 days and flows exceeded the 8, cfs threshold for 9 days. The DAYS > 5, CFS column shows the number of days in the YEAR that exceed 5, cfs and the DAYS > 8, CFS column shows the number of days in the YEAR that exceeded 8, cfs. The DATES column provides the dates when flows were above 5, cfs. The 3 DAY MEAN PEAK column provides the highest 3 day average daily flow during the peak flow event, the EVENT VOLUME column shows the total flow during events where flow exceeded 5, cfs, and the YEAR TYPE column provides the annual hydrologic condition designation. The OVERTON ANNUAL AVERAGE DAILY FLOW figure shows the Overton gage hydrograph from 27 through the present. The amount of flow coming from the McConaughy Environmental account is shown in purple. The gage data during most of 212 is provisional and contains several equipment errors. The figure will be updated as approved data becomes available. The 5, cfs line on the figure indicates the SDHF event threshold; flow events that exceed 5, cfs are seen in 28, 21, and 211. The 8, cfs line shows the upper SDHF event threshold. 7 Attachment 5 Section 5 in the Platte River Recovery Implementation Program Document dated December 7, 25. Page 21 of 38
22 OVERTON GAGE YEAR DAYS > 5, CFS DAYS > 8, CFS DATES 3 DAY MEAN PEAK (CFS) EVENT VOLUME YEAR TYPE 27 3,183 NORMAL /24 5/26 7,597 45,24 NORMAL 29 3,447 NORMAL /15 6/28 7,23 183,176 WET /24 8/13 8,613 1,37,87 WET 212 3,77 NORMAL AVERAGE ,52 422,62 Page 22 of 38
23 APPENDIX A: CENTRAL PLATTE RIVER SURFACE WATER SUMMARY, 27 TO ANNUAL SUMMARY HYDROLOGIC CONDITION The annual average gage flow at Grand Island was 1,121 cfs, resulting in a NORMAL annual hydrologic condition designation. The real time hydraulic conditions ranged between dry and normal as seen in Table A1. Table A Real time hydrologic condition designations Period Condition Target Flow Period Condition Target Flow Jan 1 Jan 31 1 May 2 May 26 DRY 8 Feb 1 Feb May 27 June 2 NORMAL 34 Feb 15 Mar June 21 Sept 15 NORMAL 12 Mar 16 Mar Sept 16 Sept 3 NORMAL 1 Mar 23 May 1 24 Oct 1 Nov 15 NORMAL 18 May 11 May 19 DRY 8 Nov 16 Dec 31 NORMAL 1 ENVIRONMENTAL ACCOUNT Releases from the McConaughy Environmental Account (EA) were made during the summer nesting period from June 28 through August 12, with a total volume of 34,374 af. This release was to support flows for forage fish and provide a degree of predator barrier. The account received 314 af from Net Controllable Conserved Water (NCCW) in addition to storable natural inflows. Page 23 of 38
24 27 FLOW AND PEAK FLOW EVENTS GAGE AVG ANNUAL FLOW (CFS) INSTANTANEOUS PEAK FLOW (CFS) DATE OF PEAK FLOW TYPE OF YEAR DESIGNATION OVERTON 8 4,42 Jun. 2 KEARNEY 857 5,43 Feb. 25 GRAND ISLAND 1,121 7,3 Feb. 23 NORMAL TARGET FLOW ACCOUNTING AT GRAND ISLAND TARGET CATEGORY TOTAL FLOW TARGET VOLUME TOTAL DEFICIT VOLUME DEFICIT TIMING DEFICIT ANNUAL 811,42 1,291, ,983 48,55 63,432 REAL TIME 811,42 1,112, ,754 31, ,512 VOLUME AT START OF YEAR VOLUME AT END OF YEAR CHANGE IN VOLUME MCCONAUGHY ENVIRONMENTAL ACCOUNT 125,473 ACCRUALS 34,794 18,612 LOSSES 17,282 16,861 RELEASES 34,374 EA VOLUME, AF 16, 14, 12, 1, 8, 6, 4, 2, 27 MCCONAUGHY EA AND REAL TIME DEFICITS AT GRAND ISLAND GAGE Jan Feb Mar Apr May Jun Jul Aug Sep Oct Nov Dec EA VOLUME ANNUAL DEFICIT REAL TIME DEFICIT EA RELEASES 7, 6, 5, 4, 3, 2, 1, RELEASES AND DEFICITS, AF Page 24 of 38
25 28 ANNUAL SUMMARY HYDROLOGIC CONDITION The annual average gage flow at Grand Island was 1,3 cfs, resulting in a NORMAL annual hydrologic condition designation. The real time hydraulic conditions ranged between dry, normal, and wet, matching the annual designation 67% of the year, shown in Table A2. Table A2. 28 Real time hydrologic condition designations Period Condition Target Flow Period Condition Target Flow Jan 1 Jan 31 DRY 6 May 2 May 26 DRY 8 Feb 1 Feb 14 DRY 12 May 27 June 2 WET 34 Feb 15 Mar 15 DRY 225 June 21 Sept 15 NORMAL 12 Mar 16 Mar 22 NORMAL 18 Sept 16 Sept 3 NORMAL 1 Mar 23 May 1 NORMAL 24 Oct 1 Nov 15 NORMAL 18 May 11 May 19 DRY 8 Nov 16 Dec 31 NORMAL 1 ENVIRONMENTAL ACCOUNT Releases from the McConaughy Environmental Account (EA) were made from July 9 through August 3, totaling 3,123 af, with the intent of assisting in flows fo forage fish during observed nesting activity. The releases served to reduce deficits to target flows by a total of 7,997 cfs. The EA followed a drought mode of operation in 28 due to well below average carry over in Lake McConaughy and anticipated below normal water supply on the North Platte River. The account received 314 af from Net Controllable Conserved Water (NCCW) in addition to storable natural inflows. Page 25 of 38
26 28 FLOW AND PEAK FLOW EVENTS GAGE AVG ANNUAL FLOW (CFS) INSTANTANEOUS PEAK FLOW (CFS) DATE OF PEAK FLOW TYPE OF YEAR DESIGNATION OVERTON ,2 May. 25 KEARNEY ,4 May. 26 GRAND ISLAND 1,3 13,6 May. 27 NORMAL TARGET FLOW ACCOUNTING AT GRAND ISLAND TARGET CATEGORY TOTAL FLOW TARGET VOLUME TOTAL DEFICIT VOLUME DEFICIT TIMING DEFICIT ANNUAL 944,81 1,298, ,55 354, ,538 REAL TIME 944,81 1,141,73 445, , ,612 VOLUME AT START OF YEAR VOLUME AT END OF YEAR CHANGE IN VOLUME MCCONAUGHY ENVIRONMENTAL ACCOUNT 18,612 ACCRUALS 37,681 97,911 LOSSES 17,65 1,71 RELEASES 3,123 EA VOLUME, AF 16, 14, 12, 1, 8, 6, 4, 2, 28 MCCONAUGHY EA AND REAL TIME DEFICITS AT GRAND ISLAND GAGE Jan Feb Mar Apr May Jun Jul Aug Sep Oct Nov Dec 7, 6, 5, 4, 3, 2, 1, RELEASES AND DEFICITS, AF EA VOLUME ANNUAL DEFICIT REAL TIME DEFICIT EA RELEASES Page 26 of 38
27 29 ANNUAL SUMMARY HYDROLOGIC CONDITION The annual average gage flow at Grand Island was 1,39 cfs, resulting in a NORMAL annual hydrologic condition designation. The real time hydraulic condition was normal for the majority of the year, only varying from the annual designation for a dry designation from October 1 to November 15. Real time and annual designations matched 83% of the year, as seen in Table A 3. Table A3. 29 Real time hydrologic condition designations Period Condition Target Flow Period Condition Target Flow Jan 1 Jan 31 NORMAL 1 May 2 May 26 NORMAL 34 Feb 1 Feb 14 NORMAL 18 May 27 June 2 NORMAL 34 Feb 15 Mar 15 NORMAL 335 June 21 Sept 15 NORMAL 12 Mar 16 Mar 22 NORMAL 18 Sept 16 Sept 3 NORMAL 1 Mar 23 May 1 NORMAL 24 Oct 1 Nov 15 WET 24 May 11 May 19 NORMAL 12 Nov 16 Dec 31 WET 1 ENVIRONMENTAL ACCOUNT Releases from the McConaughy Environmental Account (EA) were made during a Flow Routing Test associated with the Program s Short Duration High Flows from April 9 through April 16 and totaled 22,953 af. The EA followed a drought mode of operation in 29 due to well below average carry over in Lake McConaughy and anticipated below normal water supply on the North Platte River. The account received 314 af from Net Controllable Conserved Water (NCCW) in addition to storable natural inflows. Page 27 of 38
28 29 FLOW AND PEAK FLOW EVENTS GAGE AVG ANNUAL FLOW (CFS) INSTANTANEOUS PEAK FLOW (CFS) DATE OF PEAK FLOW TYPE OF YEAR DESIGNATION OVERTON 942 3,7 Apr. 19 KEARNEY 916 3,35 Apr. 2 GRAND ISLAND 1,39 3,54 Apr. 22 NORMAL TARGET FLOW ACCOUNTING AT GRAND ISLAND TARGET CATEGORY TOTAL FLOW TARGET VOLUME TOTAL DEFICIT VOLUME DEFICIT TIMING DEFICIT ANNUAL 752,38 1,291, ,82 539,915 92,887 REAL TIME 752,38 1,346, , ,659 76,999 MCCONAUGHY ENVIRONMENTAL ACCOUNT VOLUME AT START OF YEAR 97,911 ACCRUALS 4,15 VOLUME AT END OF YEAR 15,775 LOSSES 9,199 CHANGE IN VOLUME 7,865 RELEASES 22,953 EA VOLUME, AF 29 MCCONAUGHY EA AND REAL TIME DEFICITS AT GRAND ISLAND GAGE 16, 14, 12, 1, 8, 6, 4, 2, Jan Feb Mar Apr May Jun Jul Aug Sep Oct Nov Dec 7, 6, 5, 4, 3, 2, 1, RELEASES AND DEFICITS, AF EA VOLUME ANNUAL DEFICIT REAL TIME DEFICIT EA RELEASES Page 28 of 38
29 21 ANNUAL SUMMARY HYDROLOGIC CONDITION The annual average gage flow at Grand Island was 2,289 cfs, resulting in a WET annual hydrologic condition designation. The real time hydraulic condition varied between normal and wet over the year, matching the annual designation 98% of the year and only differing from May 2 through May 27, as seen in Table A4. For several periods during the year, the normal and wet target flows are the same; for these periods a real time designation of normal was considered to match the annual designation of wet. Table A4. 21 Real time hydrologic condition designations Period Condition Target Flow Period Condition Target Flow Jan 1 Jan 31 NORMAL 1 May 2 May 26 NORMAL 34 Feb 1 Feb 14 NORMAL 18 May 27 June 2 WET 34 Feb 15 Mar 15 NORMAL 335 June 21 Sept 15 NORMAL 12 Mar 16 Mar 22 NORMAL 18 Sept 16 Sept 3 NORMAL 1 Mar 23 May 1 NORMAL 24 Oct 1 Nov 15 WET 24 May 11 May 19 NORMAL 12 Nov 16 Dec 31 WET 1 ENVIRONMENTAL ACCOUNT No releases were made to the McConaughy Environmental Account (EA) and the EA followed a conservation mode of operation in 21. The account received 314 af from Net Controllable Conserved Water (NCCW) in addition to storable natural inflows; however, most of the large flows did not result in EA accruals because they fell during the May September period when the EA does not accrue storable natural inflows (SNI). The EA was not able to capture additional SNI during October and November because the available SNI exceeded 1% of the available storage space in the Kingsley reservoir, resulting in 6,848 af less SNI in October and 34 af less SNI in November. Page 29 of 38
30 21 FLOW AND PEAK FLOW EVENTS GAGE AVG ANNUAL FLOW (CFS) INSTANTANEOUS PEAK FLOW (CFS) DATE OF PEAK FLOW TYPE OF YEAR DESIGNATION OVERTON 2,157 7,5 Jun. 27 KEARNEY 2,69 8,51 Jun. 17 GRAND ISLAND 2,289 8,84 Jun. 24 WET TARGET FLOW ACCOUNTING AT GRAND ISLAND TARGET CATEGORY TOTAL FLOW TARGET VOLUME TOTAL DEFICIT VOLUME DEFICIT TIMING DEFICIT ANNUAL 1,657,385 1,367, , ,463 REAL TIME 1,657,385 1,346, , ,636 VOLUME AT START OF YEAR VOLUME AT END OF YEAR CHANGE IN VOLUME MCCONAUGHY ENVIRONMENTAL ACCOUNT 15,775 ACCRUALS 46, ,383 LOSSES 1,95 28,67 RELEASES EA VOLUME, AF 16, 14, 12, 1, 8, 6, 4, 2, 21 MCCONAUGHY EA AND REAL TIME DEFICITS AT GRAND ISLAND GAGE Jan Feb Mar Apr May Jun Jul Aug Sep Oct Nov Dec 7, 6, 5, 4, 3, 2, 1, RELEASES AND DEFICITS, AF EA VOLUME ANNUAL DEFICIT REAL TIME DEFICIT EA RELEASES Page 3 of 38
31 211 ANNUAL SUMMARY HYDROLOGIC CONDITION The annual average gage flow at Grand Island was 4,275 cfs, resulting in a WET annual hydrologic condition designation. The real time hydraulic condition remained consistently wet throughout the year, matching the annual designation 1% of the time, as seen in Table A5. Table A Real time hydrologic condition designations Period Condition Target Flow Period Condition Target Flow Jan 1 Jan 31 NORMAL 1 May 2 May 26 WET 49 Feb 1 Feb 14 NORMAL 18 May 27 June 2 WET 34 Feb 15 Mar 15 NORMAL 335 June 21 Sept 15 NORMAL 12 Mar 16 Mar 22 NORMAL 18 Sept 16 Sept 3 NORMAL 1 Mar 23 May 1 NORMAL 24 Oct 1 Nov 15 WET 24 May 11 May 19 WET 12 Nov 16 Dec 31 WET 1 ENVIRONMENTAL ACCOUNT The McConaughy Environmental Account (EA) was reset to 1, af from March through November of 211 due to the Kingsley Reservoir reaching and remaining at its effective capacity for most of the year. No releases were made as minimal shortages to target flows were seen over the course of the year. While the account received 314 af from Net Controllable Conserved Water (NCCW), this water was lost when the account was reset. The EA was reduced by 39,644 af in March when it was reset and it was not able to capture storable natural inflows when the Kingsley Reservoir was at effective capacity. Page 31 of 38
32 211 FLOW AND PEAK FLOW EVENTS GAGE AVG ANNUAL FLOW (CFS) INSTANTANEOUS PEAK FLOW (CFS) DATE OF PEAK FLOW TYPE OF YEAR DESIGNATION OVERTON 3,877 8,82 Jun. 2 KEARNEY 3,972 9,46 Jun. 25 GRAND ISLAND 4,224 1,4 Jun. 27 WET TARGET FLOW ACCOUNTING AT GRAND ISLAND TARGET CATEGORY TOTAL FLOW TARGET VOLUME TOTAL DEFICIT VOLUME DEFICIT TIMING DEFICIT ANNUAL 3,57,736 1,367,524 18,197 18,197 REAL TIME 3,57,736 1,367,524 18,197 18,197 VOLUME AT START OF YEAR VOLUME AT END OF YEAR CHANGE IN VOLUME MCCONAUGHY ENVIRONMENTAL ACCOUNT 134,383 ACCRUALS 59, ,42 LOSSES 2,333 19,98 RELEASES EA VOLUME, AF 16, 14, 12, 1, 8, 6, 4, 2, 211 MCCONAUGHY EA AND REAL TIME DEFICITS AT GRAND ISLAND GAGE Jan Feb Mar Apr May Jun Jul Aug Sep Oct Nov Dec 7, 6, 5, 4, 3, 2, 1, RELEASES AND DEFICITS, AF EA VOLUME ANNUAL DEFICIT REAL TIME DEFICIT EA RELEASES Page 32 of 38
33 APPENDIX B: COMPARISON OF ANNUAL HYDROLOGIC CONDITION FLOW THRESHOLDS The Program currently uses the FWS annual flow thresholds to determine annual hydrologic condition designations. These thresholds were developed by taking the annual average of the average daily flows from the Grand Island gage over the period 1947 through The years with the highest 33% annual average daily flows were designated wet, the years with the 25% lowest annual average daily flows were designated dry, and the years between the two ranges were designated normal. The threshold for wet years is 1,575 cfs and the threshold for dry years is 939 cfs. To ensure that these thresholds still adequately describe the hydrologic conditions in the associated habitat, they were compared with flow thresholds developed from the annual average daily flows at the Grand Island gage over the period 1947 through 211. The same highest 33% and lowest 25% cutoffs were used, resulting in thresholds of 1,657 cfs for wet years and 939 cfs for dry years. The differences between the thresholds are shown in Table C1. Annual hydrologic conditions were assigned to each year from 1947 through 211 using both the thresholds and the thresholds. The thresholds only caused the hydrologic condition to change for two years, 197 and 1972, with both years designations changing from a wet designation by the thresholds to a normal designation by the thresholds. Table C and Thresholds Period Wet threshold (cfs) Dry threshold (cfs) , , Difference 82 Page 33 of 38


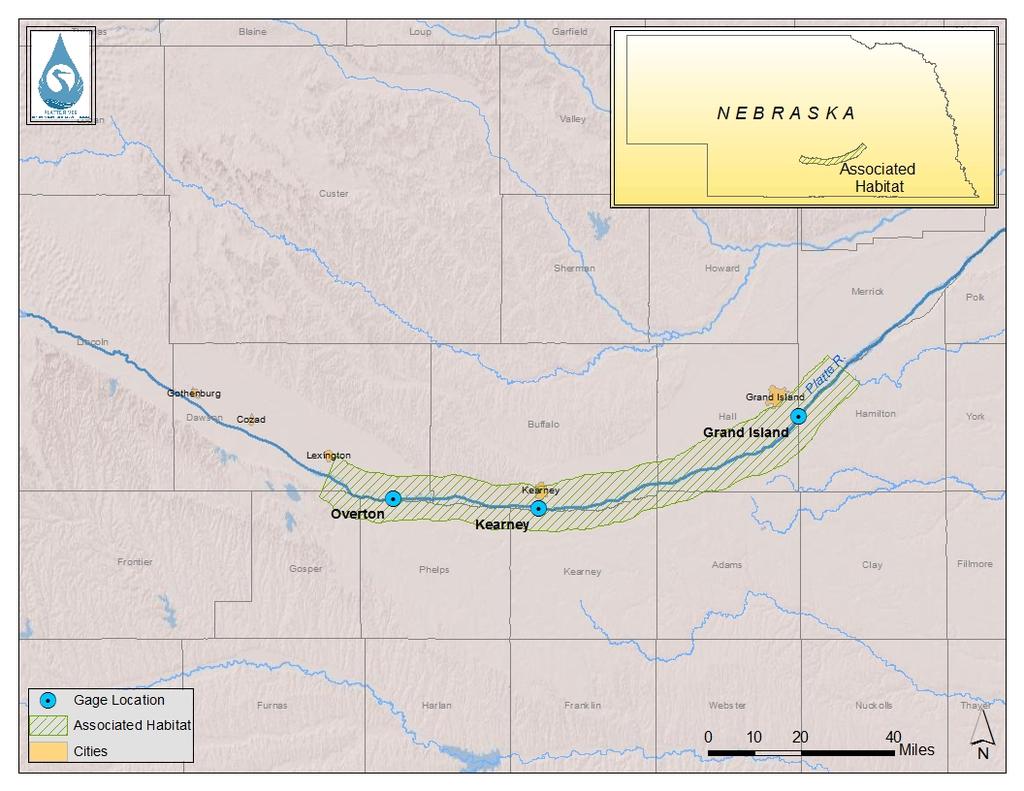
34 APPENDIX C: GAGE LOCATION MAP Page 34 of 38
35 GENEARAL APPENDIX D: GLOSSARY OF TERMS SNI: storable natural inflows, the amount of natural flow into Lake McConaughy that may be stored in the reservoir ANNUAL SUMMARY AVG ANNUAL FLOW: the annual average of average daily flows INSTANTANEOUS PEAK FLOW: the maximum instantaneous flow to occur in the calendar year DATE OF PEAK FLOW: day of the year the instantaneous peak flow occurred TYPE OF YEAR DESIGNATION: the annual hydrologic condition designation; either wet, normal, or dry TARGET CATEGORY ANNUAL: the set of target flows based on the type of year designation TARGET CATEGORY REAL TIME: the set of target flows based on real time updates of the hydrologic condition throughout the year TOTAL FLOW: a summation of the average daily flow over the year TARGET VOLUME: the total volume of the target flows for the year TOTAL DEFICIT: the sum of all the daily deficits to target flows for the year VOLUME DEFICIT: the difference between the target volume and the total flow at Grand Island TIMING DEFICIT: the difference between the total deficit and the volume deficit CHANGE IN VOLUME: Change in EA volume over the calendar year VOLUME AT START OF YEAR: EA volume at the beginning of the calendar year VOLUME AT END OF YEAR: EA volume at the end of the calendar year ACCRUALS: water added to the Lake McConaughy environmental account (EA) from storable natural inflows (SNI), water transfers, and water credits. LOSSES: water removed from the EA due to evaporation and seepage Page 35 of 38
36 RELEASES: water released from the EA to mitigate deficits to target flows, to meet short duration high flows, or other reasons GRAND ISLAND FLOW SUMMARY AVG ANNUAL FLOW: See ANNUAL SUMMARY definition INTANTANEOUS PEAK FLOW: See ANNUAL SUMMARY definition DATE OF PEAK FLOW: See ANNUAL SUMMARY definition TYPE OF YEAR DESIGNATION: See ANNUAL SUMMARY definition INSTANTANEOUS MIN FLOW: the minimum instantaneous flow to occur in the calendar year DATE OF MIN FLOW: day of the year the instantaneous minimum flow occurred GRAND ISLAND HISTORICAL FLOW SUMMARY INTANTANEOUS PEAK FLOW: This section shows data for the highest instantaneous flow calculated by the USGS based on water year YEAR TYPE: See ANNUAL SUMMARY TYPE OF YEAR DESIGNATION definition AVERAGE PEAK: the average peak flow for the year type AVERAGE MONTH OF PEAK: the average month the peak occurred MAXIMUM PEAK: the highest annual peak for the year types DATE: the date the highest annual peak occurred MINIMUM PEAK: the lowest annual peak for the year types DATE: the date the lowest annual peak occurred AVERAGE DAILY FLOW: This section shows data for the average daily flow for two periods PERIOD: the range of years average flows are analyzed FLOW: the average flow during the period shown Page 36 of 38
37 LAKE MCCONAUGHY ENVIRONMENTAL ACCOUNT SUMMARY WATER YEAR: the period from October 1 of the previous year through September 3 of the current year, for example, the water year 28 begins on October 1, 27 and ends September 3, 28 AVERAGE VOLUME: the average volume of the EA over the course of the water year YEAR START VOL: the volume of the EA at the beginning of the water year (October 1) YEAR END VOL: the volume of the EA at the end of the water year (September 3) Δ VOLUME: the change in EA volume over the water year, calculated VOLUME OCT 1 VOLUME SEP 3 ACCRUALS: the total amount of water added to the EA during the water year, including SNI, water transfers, and water credits. NATURAL LOSSES: the combination of EA seepage and evaporation losses for the water year RELEASES: the total amount of EA releases for the water year OPERATIONAL LOSSES: losses from the EA s inability to store SNI or EA water lost during an account reset # OF DAYS: the duration of the EA release RELEASE VOLUME: the total volume of release from the EA VOLUME: the volume of EA water that arrived at the gage location % OF RELEASE: the percent of the total release volume to arrive at the gage location DEFICIT REDUCTION: the amount of the EA release that served to reduce deficits to annual target flows at Grand Island PURPOSE: the USFWS stated purpose for the EA release SHORT DURATION HIGH FLOW SUMMARY DAYS > 5, cfs: the number of days flow exceeds the 5, cfs threshold DAYS > 8, cfs: the number of days flow exceeds the 8, cfs threshold DATES: the date range of events with flow greater than 5, cfs Page 37 of 38
38 3 DAY MEAN PEAK: the maximum of a 3 day running average of flow during the peak event EVENT VOLUME: the volume of flow during events with flow above 5, cfs YEAR TYPE: See ANNUAL SUMMARY TYPE OF YEAR DESIGNATION definition UNITS CFS: Cubic feet per second. Flows are given in cfs, one cubic foot per second of flow is equal to acre feet per day. AF: Acre feet. EA volume, flow volume, deficit volume, EA accruals, EA losses, and EA releases are given in af. Page 38 of 38
Cedar River Watershed Habitat Conservation Plan
 Cedar River Watershed Habitat Conservation Plan Briefing for the WRIA 8 Salmon Recovery Council November 21, 2013 Cyndy Holtz Seattle Public Utilities cyndy.holtz@seattle.gov What is an HCP? Habitat Conservation
Draft Application for New License for Major Water Power Project Existing Dam
 Draft Application for New License for Major Water Power Project Existing Dam Northfield Project Northfield Mountain Pumped Storage Project (FERC Project Number 2485) Turners Falls Hydroelectric Project
2015 Restoration Allocation and Default Flow Schedule January 20, 2015
 Bureau of Reclamation 00 Cottage Way, MP- Sacramento, California 01 January 0, 01 1 Introduction The following transmits the 01 to the Restoration Administrator for the San Joaquin River Restoration Program
Camp Far West Hydroelectric Project Relicensing
 Camp Far West Hydroelectric Project Relicensing Water Operations Model FERC Project No. 2997 July 16, 2018 Overview Project and South Sutter Water District overview Operations model Overview Model Updates
Initial 2018 Restoration Allocation & Default Flow Schedule January 23, 2018
 Initial 2018 Restoration Allocation & Default Schedule January 23, 2018 Bureau of Reclamation 2800 Cottage Way, MP-170 Sacramento, California 95825 Introduction The following transmits the initial 2018
Water Supply Reallocation Workshop
 Water Supply Reallocation Workshop Determining Yield and Storage Requirement June 2, 2009 Tulsa, OK James Hathorn, Jr Redistribution of Water The function of a reservoir system is to redistribute the natural
PEACE RIVER MANASOTA REGIONAL WATER SUPPLY AUTHORITY BOARD OF DIRECTORS MEETING December 5, 2018 ROUTINE STATUS REPORTS ITEM 1
 PEACE RIVER MANASOTA REGIONAL WATER SUPPLY AUTHORITY BOARD OF DIRECTORS MEETING December 5, 218 ROUTINE STATUS REPORTS ITEM 1 Hydrologic Conditions Report MEMORANDUM Project: Hydrologic Conditions Report
Appendix I: Fixed-400,000 af Flood Storage Operation
 Appendix I: Fixed-400,000 af Flood Storage Operation 1.0 FIXED-400,000 AF FLOOD STORAGE OPERATION This operation set provides a comparison of operations before the SAFCA/Reclamation interim agreement in
Hetch Hetchy Water and Power
 Hetch Hetchy Water and Power Who is Hetch Hetchy Water and Power (HHWP)? HHWP is a division of the San Francisco Public Utilities Commission (SFPUC) SFPUC a Department of the City and County of San Francisco
Maintaining Water Supply Resilience in Extreme Times
 Maintaining Water Supply Resilience in Extreme Times Presented to the Western Coalition of Arid States June 20, 2018 Presentation Outline: Snapshot of Reclamation Offices West-wide Precipitation and Storage
Electric Forward Market Report
 Mar-01 Mar-02 Jun-02 Sep-02 Dec-02 Mar-03 Jun-03 Sep-03 Dec-03 Mar-04 Jun-04 Sep-04 Dec-04 Mar-05 May-05 Aug-05 Nov-05 Feb-06 Jun-06 Sep-06 Dec-06 Mar-07 Jun-07 Sep-07 Dec-07 Apr-08 Jun-08 Sep-08 Dec-08
Environmental Flows Allocation Process in Texas. Kevin Mayes Texas Parks and Wildlife Department March 2010
 Environmental Flows Allocation Process in Texas Kevin Mayes Texas Parks and Wildlife Department March 2010 Senate Bill 3-2007 Environmental Flow Regime A schedule of flow quantities that reflects seasonal
Considerations for Modeling a Water Bank at the Aspinall Unit with Current Environmental Flows
 Considerations for Modeling a Water Bank at the Aspinall Unit with Current Environmental Flows Blue Mesa Reservoir and Dam Draft Report Prepared for the Colorado River Program of The Nature Conservancy
Water Supply Board Briefing. Water Operations Department March 22, 2016
 Water Supply Board Briefing Water Operations Department March 22, 2016 Water Supply Briefing California Water Supply District Water Supply Water Supply Projections Water Supply Schedule 2 California Water
SURFACE WATER WITHDRAWALS & LOW FLOW PROTECTION POLICY MICHAEL COLLEGE, P.E. SUSQUEHANNA RIVER BASIN COMMISSION
 SURFACE WATER WITHDRAWALS & LOW FLOW PROTECTION POLICY MICHAEL COLLEGE, P.E. SUSQUEHANNA RIVER BASIN COMMISSION SCENARIOS Direct withdrawal from surface water (SW): PA MOU w/padep NY MOU w/nysdec MD No
MISSOURI RIVER BASIN WATER MANAGEMENT SPRING 2018 PUBLIC MEETINGS
 MISSOURI RIVER BASIN WATER MANAGEMENT SPRING 2018 PUBLIC MEETINGS April 17 th 10:00 a.m. Smithville, MO April 17 th 4:00 p.m. Omaha, NE April 18 th 10:00 a.m. Pierre, SD April 18 th 6:00 p.m. Bismarck,
Reservoir Drought Operations
 Reservoir Drought Operations Kevin J. Landwehr, P.E., D.WRE Chief, Hydrology and Hydraulics Branch 4 March 2013 Purpose Awareness of Drought Contingency Plans 2012/13 Reservoir Operations Drought Management
AGENDA DATE: November 14, 2018
 ALAMEDA COUNTY FLOOD CONTROL AND WATER CONSERVATION DISTRICT, ZONE 7 100 NORTH CANYONS PARKWAY, LIVERMORE, CA 94551 PHONE (925) 454-5000 FAX (925) 454-5727 ORIGINATING SECTION: INTEGRATED PLANNING CONTACT:
Missouri River Basin Water Management
 Missouri River Basin Water Management Spring 2011 Public Meetings April 12 th 11:00 a.m. Nebraska City, NE April 12 th 7:00 p.m. Fort Peck, MT April 13 th 1:00 p.m. Bismarck, ND April 13 th 7:00 p.m. Pierre,
Section V: Water Accounting and Water Supply Reliability
 Section V: Accounting and Supply Reliability A. Quantifying the Supplier s Supplies 1. Agricultural Supplier Quantities Table 46 illustrate the District s water. The District routinely transfers and/or
Section V: Water Accounting and Water Supply Reliability
 Section V: Water Accounting and Water Reliability A. Quantifying the Water Supplier s Water Supplies 1. Agricultural Water Supplier Water Quantities Table 41 shows typical water diversions from the CA
This is a digital document from the collections of the Wyoming Water Resources Data System (WRDS) Library.
 Library.") This is a digital document from the collections of the Wyoming Water Resources Data System (WRDS) Library. For additional information about this document and the document conversion process, please contact
This is a digital document from the collections of the Wyoming Water Resources Data System (WRDS) Library. For additional information about this document and the document conversion process, please contact
Welcome STEP 1: STEP 2: STEP 3:
 Welcome Displays are placed around the room. Each display focuses on federally authorized project purposes and particular issues related to the draft Alabama, Coosa, and Tallapoosa River Basin (ACT) Master
Relicensing Study 3.8.1
 Relicensing Study 3.8.1 Evaluate the Impact of Current and Potential Future Modes of Operation on Flow, Water Elevation and Hydropower Generation Study Report Northfield Mountain Pumped Storage Project
DES MOINES RIVER RESERVOIRS WATER CONTROL PLAN UPDATES IOWA ASCE WATER RESOURCES DESIGN CONFERENCE
 DES MOINES RIVER RESERVOIRS WATER CONTROL PLAN UPDATES 237 237 237 217 217 217 200 200 200 0 0 0 163 163 163 131 132 122 80 119 27 252 174.59 110 135 120 112 92 56 IOWA ASCE WATER RESOURCES DESIGN CONFERENCE
Hood River Basin Study
 Hood River Basin Study Agenda 1). Goals 2). Partners 3). Study Overview 4). Recommendations Goals Evaluate: 1. Current and future water demands 2. Water conservation opportunities 3. Groundwater resources
Spring Forecast Based Operations, Folsom Dam, California
 Spring Forecast Based Operations, Folsom Dam, California Paul E. Pugner, P.E. Chief, Water Management Section Sacramento District U.S. Army 1325 J Street, Room 1126 Sacramento, CA 95814-2922 Tel: (916)
Section 4. Mono Basin Tributaries: Lee Vining, Rush, Walker, and Parker Creeks. Monitoring Results and Analysis For Runoff Season
 Section 4 Mono Basin Tributaries: Lee Vining, Rush, Walker, and Parker Creeks Monitoring Results and Analysis For Runoff Season 2009-10 Mono Basin Tributaries: Lee Vining, Rush, Walker, and Parker Creeks
Low Inflow Protocol for the Yadkin & Yadkin-Pee Dee River Hydroelectric Projects
 Low Inflow Protocol for the Yadkin & Yadkin-Pee Dee River Hydroelectric Projects GOAL The fundamental goal of this Low Inflow Protocol (LIP) is to take staged actions in the Yadkin- Pee Dee River Basin
Missouri River Basin Water Management
 Missouri River Basin Water Management Spring 2015 Public Meetings April 7 th April 7 th April 8 th April 9 th April 9 th 11:00 a.m. 6:00 p.m. 11:00 a.m. 11:00 a.m. 6:00 p.m. Pierre, SD Bismarck, ND Fort
Modeling Your Water Balance
 Modeling Your Water Balance Purpose To model a soil s water storage over a year Overview Students create a physical model illustrating the soil water balance using glasses to represent the soil column.
Current Water Management Practices for Kerr Reservoir
 Current Water Management Practices for Kerr Reservoir Ashley Hatchell Water Management Lake Gaston Association Monthly Meeting 03 February 2016 US Army Corps of Engineers Outline and Goals for Today s
Section V: Water Accounting and Water Supply Reliability
 Section V: Accounting and Supply Reliability A. Quantifying the Supplier s Supplies 1. Agricultural Supplier Quantities Table 38 shows typical water diversions from the CA Aqueduct during the representative
Hydrology Overview of Lake Taupo and the Waikato River as it relates to the Waikato Hydro Scheme (WHS) (Ohakuri Site Visit)
 (Ohakuri Site Visit)") Hydrology Overview of Lake Taupo and the Waikato River as it relates to the Waikato Hydro Scheme (WHS) (Ohakuri Site Visit) Lake Taupo From 1905 to 1941 Lake Taupo was an unmanaged natural Lake. With the
Hydrology Overview of Lake Taupo and the Waikato River as it relates to the Waikato Hydro Scheme (WHS) (Ohakuri Site Visit) Lake Taupo From 1905 to 1941 Lake Taupo was an unmanaged natural Lake. With the
Warm Springs Hydro LLC 5203 South 11 th East Idaho Falls, ID
 Warm Springs Hydro LLC 5203 South 11 th East Idaho Falls, ID 83404 208-522-8069 ted@tsorenson.net September 26, 2013 Elizabeth A.O. Moats Oregon Department of Fish and Wildlife 107 20 th Street La Grande,
Ranch Tools: Grazing and Hay Records
 Ranch Tools: Grazing and Hay Records Jerry D. Volesky Range / Forage Specialist UN-L West Central Res. & Ext. Center 402 West State Farm Rd. North Platte, NE 69101 (308) 696-6710 jerry.volesky@unl.edu
Water Infrastructure Needs in the Columbia River Basin Legislative Council on River Governance
 Water Infrastructure Needs in the Columbia River Basin Legislative Council on River Governance Bryan Horsburgh, Deputy Manager, Resource and Technical Services Pacific Northwest Region August 21, 2012
Hood River Basin Study
 Hood River Basin Study Agenda 1). Goals 2). Partners 3). Study Overview 4). Recommendations Goals Evaluate: 1. Current and future water demands 2. Water conservation opportunities 3. Groundwater resources
An Introduction to Environmental Flows
 An Introduction to Environmental Flows The natural flow regime Flow alteration Environmental flows defined Scaling up Eloise Kendy, Ph.D. IUCN workshop Kathmandu, Nepal 5 August 2011 Jefferson River, Montana
Introducing the WBG Guidelines for selecting EFlow assessment methods. Cate Brown
 Introducing the WBG Guidelines for selecting EFlow assessment methods Cate Brown This presentation Factors affected potential impacts Level of detail in EFlows assessments: Magnitude and complexity of
Exploring the Possibilities At Prado Dam
 Exploring the Possibilities At Prado Dam Greg Woodside, P.G., C.HG. Executive Director of Planning & Natural Resources December 5, 2017 The Orange County groundwater basin lies at the base of the Santa
Water Supply Outlook. Interstate Commission on the Potomac River Basin (ICPRB) 30 W. Gude Drive, Suite 450 Rockville, MD Tel: (301)
 30 W. Gude Drive, Suite 450 Rockville, MD Tel: (301)") Water Supply Outlook June 2, 2015 To subscribe: please email sahmed@icprb.org Interstate Commission on the Potomac River Basin (ICPRB) 30 W. Gude Drive, Suite 450 Rockville, MD 20850 Tel: (301) 274 8120
Water Supply Outlook June 2, 2015 To subscribe: please email sahmed@icprb.org Interstate Commission on the Potomac River Basin (ICPRB) 30 W. Gude Drive, Suite 450 Rockville, MD 20850 Tel: (301) 274 8120
This is a digital document from the collections of the Wyoming Water Resources Data System (WRDS) Library.
 Library.") This is a digital document from the collections of the Wyoming Water Resources Data System (WRDS) Library. For additional information about this document and the document conversion process, please contact
This is a digital document from the collections of the Wyoming Water Resources Data System (WRDS) Library. For additional information about this document and the document conversion process, please contact
Columbia River Operations
 Columbia River Operations P R E S E N T E D B Y Kieran Connolly Vice President Generation Asset Management Bonneville Power Administration 4 th longest river in North America; drains 258,000 square miles
RUNOFF VOLUMES FOR ANNUAL OPERATING PLAN STUDIES
 RUNOFF VOLUMES FOR ANNUAL OPERATING PLAN STUDIES Table of Contents Page GENERAL...1 BASIN ANNUAL RUNOFF VOLUMES...1 DISTRIBUTION OF RUNOFF BY REACH...2 DISTRIBUTION OF RUNOFF BY MONTH...4 DETERMINATION
Determining water allocations in the regulated Murrumbidgee Valley
 Determining water allocations in the regulated Murrumbidgee Valley September 2013 Introduction The NSW Office of Water (NOW) is responsible for sharing water between consumptive users and the environment
Hydrology in Western Colorado: Planning for Resilience
 Hydrology in Western Colorado: Planning for Resilience 2016 Water Course February 18, 2016 Dr. Gigi A. Richard Director, Hutchins Water Center at CMU Professor, Geology Coordinator, Civil Engineering Partnership
IMPROVING CENTER PIVOT PERFORMANCE TO INCREASE SURFACE WATER SYSTEM EFFICIENCY
 IMPROVING CENTER PIVOT PERFORMANCE TO INCREASE SURFACE WATER SYSTEM EFFICIENCY Marcia Trompke, Conservation Director Central Nebraska Public Power & Irrigation District 415 Lincoln Street, P.O. Box 740
Appendix I. Dworshak Operations
 Appendix I Dworshak Operations I. Introduction The 2008 Biological Opinion requires annual progress reports that describe actions taken to implement certain reasonable and prudent actions (RPA) for the
SLIDES: Response of the System to Various Hydrological and Operational Assumptions: Reclamation Modeling Results
 University of Colorado Law School Colorado Law Scholarly Commons Hard Times on the Colorado River: Drought, Growth and the Future of the Compact (Summer Conference, June 8-10) 2005 6-8-2005 SLIDES: Response
An Investigation into the 2012 drought on Apalachicola River. Steve Leitman, Bill Pine and Greg Kiker
 An Investigation into the 2012 drought on Apalachicola River Steve Leitman, Bill Pine and Greg Kiker Apalachicola-Chattahoochee-Flint (ACF) River basin 20,400 sq. mi. One of the most actively disputed
Wyoming Water Development Commission Michael K. Purcell, Director 6920 Yellowtail Rd, Cheyenne, WY All Results DRAFT Subject to Change
 Progress Report Wind-Bighorn Basin Plan Update Wind-Bighorn Basin Advisory Group November 12, 2009 Wyoming Water Development Commission Michael K. Purcell, Director 6920 Yellowtail Rd, Cheyenne, WY 82002
F7 Stream Reach Summary
 F7 Stream Reach Summary Study Reach: F7, Fraser River - Ranch Creek confluence downstream to Canyon below Strawberry Road. Reach Description: Approximate channel length: 1 ½ miles, approximate channel
High-Resolution Groundwater Models for the Assessment of Riparian Restoration Options and River Conveyance Efficiency
 High-Resolution Groundwater Models for the Assessment of Riparian Restoration Options and River Conveyance Efficiency Karen L. MacClune 1, Gilbert Barth 1, Nabil Shafike 2, Deborah Hathaway 1 1 S. S. Papadopulos
Fall 2013 HFE Protocol Decision Process
 Fall 2013 HFE Protocol Decision Process Glen Knowles Katrina Grantz Nick Williams Bureau of Reclamation Meeting with Basin States October 22, 2013 HFE Decision Making Process 1. Planning and Budgeting
SACRAMENTO MUNICIPAL UTILITY DISTRICT UPPER AMERICAN RIVER PROJECT (FERC NO. 2101) WATER BALANCE MODEL TECHNICAL REPORT
 WATER BALANCE MODEL TECHNICAL REPORT") SACRAMENTO MUNICIPAL UTILITY DISTRICT UPPER AMERICAN RIVER PROJECT (FERC NO. 2101) WATER BALANCE MODEL TECHNICAL REPORT Prepared by: Sacramento Municipal Utility District Sacramento, California JUNE 2005
SACRAMENTO MUNICIPAL UTILITY DISTRICT UPPER AMERICAN RIVER PROJECT (FERC NO. 2101) WATER BALANCE MODEL TECHNICAL REPORT Prepared by: Sacramento Municipal Utility District Sacramento, California JUNE 2005
IOP Concept 5 Forecast 03 Apr 2007 to 31 Dec COE HEC-5 Simulation of IOP using hydrologic conditions of 2000 and 2001
 IOP Concept 5 Forecast 03 Apr 2007 to 31 Dec 2008 COE HEC-5 Simulation of IOP using hydrologic conditions of 2000 and 2001 HEC-5 Model Settings IOP Concept 5 Demands Hydropower Schedule based most recent
GRASSLAND BYPASS PROJECT MONTHLY DATA REPORT. July 2011
 GRASSLAND BYPASS PROJECT MONTHLY DATA REPORT July 2011 February 16, 2012 Preliminary Results A cooperative effort of: U.S. Bureau of Reclamation Central Valley Regional Water Quality Control Board U.S.
Irrigation modeling in Prairie Ronde Township, Kalamazoo County. SW Michigan Water Resources Council meeting May 15, 2012
 Irrigation modeling in Prairie Ronde Township, Kalamazoo County SW Michigan Water Resources Council meeting May 15, 2012 Development of a Groundwater Flow Model INFLOWS Areal recharge from precipitation
CHAPTER FIVE Runoff. Engineering Hydrology (ECIV 4323) Instructors: Dr. Yunes Mogheir Dr. Ramadan Al Khatib. Overland flow interflow
 Instructors: Dr. Yunes Mogheir Dr. Ramadan Al Khatib. Overland flow interflow") Engineering Hydrology (ECIV 4323) CHAPTER FIVE Runoff Instructors: Dr. Yunes Mogheir Dr. Ramadan Al Khatib Overland flow interflow Base flow Saturated overland flow ١ ٢ 5.1 Introduction To Runoff Runoff
Engineering Hydrology (ECIV 4323) CHAPTER FIVE Runoff Instructors: Dr. Yunes Mogheir Dr. Ramadan Al Khatib Overland flow interflow Base flow Saturated overland flow ١ ٢ 5.1 Introduction To Runoff Runoff
CENTRAL ASSINIBOINE INTEGRATED WATERSHED MANAGEMENT PLAN SURFACE WATER HYDROLOGY REPORT
 CENTRAL ASSINIBOINE INTEGRATED WATERSHED MANAGEMENT PLAN SURFACE WATER HYDROLOGY REPORT Planning Area Boundary: The Central Assiniboine planning area covers the reach of the Assiniboine River from just
List of Appendices APPENDIX A: WY 2000 LAKE MICHIGAN DIVERSION ACCOUNTING REPORT APPENDIX B: WY 2001 LAKE MICHIGAN DIVERSION ACCOUNTING REPORT
 EXECUTIVE SUMMARY This document is the Water Year (WY) 2000 Annual Report of the Chicago District, U. S. Army Corps of Engineers activities in the monitoring and review of the accounting of Lake Michigan
16 September Water Management Wilmington District. US Army Corps of Engineers BUILDING STRONG
 FALLS LAKE OPERATIONS UNRBA Board Meeting 16 September 2015 Water Management Wilmington District US Army Corps of Engineers Wilmington District 2 Water Management Mission 24/365 Operate Wilmington District
ECONOMIC FEASIBILITY ASSESSMENT OF WINTER CLOUD SEEDING IN THE BOISE RIVER DRAINAGE, IDAHO
 GRIFFITH AND SOL&K 39 ECONOMIC FEASIBILITY ASSESSMENT OF WINTER CLOUD SEEDING IN THE BOISE RIVER DRAINAGE, IDAHO Don A. Griffith and Mark E. Solak North American Weather Consultants, Inc. Sandy, UT 84070
21 st Century Management Solutions for Water Supply and Demand
 21 st Century Management Solutions for Water Supply and Demand AWRA Annual Conference November 9, 2017 Bill Szafranski Roger Wolvington Abstract Water supply planning in the Western US is critical for
San Antonio Water System Mitchell Lake Constructed Wetlands Below the Dam Preliminary Hydrologic Analysis
 San Antonio Water System enhancement. This recommendation was based on limited water quality data provided by SAWS and using a free-water surface constructed wetland with approximately 112 acres of wetted
Wapato Access Feasibility Study
 Wapato Access Feasibility Study David Gorman, PE Michael Rounds, PE August 5, 2011 Lower Columbia River Estuary Partnership (LCREP) Non-profit two state public-private initiative Primary Responsibility:
BAWSCA
 Hetch Hetch Extractions @ Different River Flows @ Percent of Total System Deliveries Percent of Total TR flows as a result of different delivery assumptions and percent local supplies SFPUC SYSTEM 80%
Science Supporting Policy: The Case For Flow Quantity
 MassDEP Water Management Program Science Supporting Policy: The Case For Flow Quantity Integrating Water Resources Management UMASS Conference April 8, 2008 Overview Human impact on streamflow and aquatic
Missouri River Basin Water Management Spring 2013 Public Meetings
 Missouri River Basin Water Management Spring 2013 Public Meetings April 8 th April 9 th April 9 th April 10 th April 11 th 7:00 p.m. 11:00 a.m. 7:00 p.m. 11:00 a.m. 11:00 a.m. Nebraska City, NE Fort Peck,
Reservoir Operations, Surface Water, Watershed Monitoring, and Drought
 Reservoir Operations, Surface Water, Watershed Monitoring, and Drought Cactus and Pine GCSA August 27, 2018 Stephen Flora, Hydrologist Arizona s Climate Is Unpredictable Extreme Variable Greatest Threats
Information Request 11
 Information Request 11 Information Request 11 11-1 Responses to Information Request 11 Response to Information Request 11a Response to Information Request 11b 11-2 11-6 Federal Review Panel Information
Lower Darling Annual Operations Plan
 Lower Darling Annual Operations Plan December 2017 1 December 2017 1. Introduction WaterNSW has developed the Lower Darling Operations Plan to ensure water supplies for Broken Hill and surrounding communities
WaterNSW Water Operations Report. Murray-Lower Darling November 2017
 WaterNSW Water Operations Report Murray-Lower Darling 110% 100% Dam Storages Dartmouth Dam Storage 2013/14 2014/15 2015/16 2016/17 2017/18 90% 80% 70% 60% 50% 40% 30% 20% 10% 0% Jul Aug Sept Oct Nov Dec
AN INTEGRATED RESOURCE PLAN FOR TACOMA WATER GLEN GEORGE (TW), JASON MOLINE (TW), STEVE THURIN (HDR)
, JASON MOLINE (TW), STEVE THURIN (HDR)") AN INTEGRATED RESOURCE PLAN FOR TACOMA WATER GLEN GEORGE (TW), JASON MOLINE (TW), STEVE THURIN (HDR) OUTLINE FOR TODAY S DISCUSSION OVERVIEW OF TACOMA WATER WHY NOW? INTEGRATED RESOURCE PLAN (IRP) PROCESS
AN INTEGRATED RESOURCE PLAN FOR TACOMA WATER GLEN GEORGE (TW), JASON MOLINE (TW), STEVE THURIN (HDR) OUTLINE FOR TODAY S DISCUSSION OVERVIEW OF TACOMA WATER WHY NOW? INTEGRATED RESOURCE PLAN (IRP) PROCESS
Change for Western North America. Hydrologic Implications of Climate. and the Columbia River Basin. Dennis P. Lettenmaier. Alan F.
 Hydrologic Implications of Climate Change for Western North America and the Columbia River Basin Alan F. Hamlet, Philip W. Mote, Dennis P. Lettenmaier JISAO/CSES Climate Impacts Group Dept. of Civil and
AGENDA ITEM C9 TAMPA WATER
 TAMPA WATER Supplying Water To The Region AGENDA ITEM C9 DATE: June 3, 28 TO: Gerald J. Seeber, General Manager FROM: Donald J. Polmann, Director of Science and Engineering SUBJECT: Regional Water Supply
Water Supply Outlook. Interstate Commission on the Potomac River Basin (ICPRB) 30 W. Gude Drive, Suite 450 Rockville, MD Tel: (301)
 30 W. Gude Drive, Suite 450 Rockville, MD Tel: (301)") Water Supply Outlook April 2, 2019 To subscribe: please email sahmed@icprb.org Interstate Commission on the Potomac River Basin (ICPRB) 30 W. Gude Drive, Suite 450 Rockville, MD 20850 Tel: (301) 274 8120
Water Supply Outlook April 2, 2019 To subscribe: please email sahmed@icprb.org Interstate Commission on the Potomac River Basin (ICPRB) 30 W. Gude Drive, Suite 450 Rockville, MD 20850 Tel: (301) 274 8120
Water Planning and Stewardship Committee Item 6a February 8, 2016
 Water Planning and Stewardship Committee Item 6a February 8, 2016 Hydrologic Conditions State Water Project Allocation 2016 Water Supply Demand Balances Statewide Conservation Regulations WSDM Tracking
Lower Darling Operations Plan. September 2018
 Lower Darling Operations Plan September 218 Contents 1. Introduction... 3 2. Operational objective... 4 3. Operational rules... 4 3.1 Water Sharing Plan (WSP)... 4 3.2 Murray-Darling basin agreement...
Water Supply & Demand Management Policy Update. Website Presentation December 12, 2011
 Water Supply & Demand Management Policy Update Website Presentation December 12, 2011 1 Purpose Make you aware of policy update and the process Highlight potential changes to policy Provide supporting
Impacts of Permit-Exempt Wells
 Impacts of Permit-Exempt Wells Dave Nazy, LHG August 24, 2018 1 Impacts of Permit-Exempt Wells Introduction ESSB 6091 Example Impacts Calculation Basin Estimate & 20-year Projections Offsetting Impacts
Aspinall Unit Overview
 Aspinall Unit Overview Dan Crabtree Erik Knight Sandi Caskey Jennifer Hamilton US Bureau of Reclamation Western Colorado Area Office Grand Junction, Colorado Reclamation Service of 1902 In Early 1900 s
Comments on NISP DEIS Treatment of Nebraska Threatened and Endangered Species
 Save The Poudre Coalition PO Box 20 Fort Collins, CO 80522 Comments on NISP DEIS Treatment of Nebraska Threatened and Endangered Species Summary According to the U.S. Fish and Wildlife Service in its Biological
Chapter VII. Falls Lake Project -- Water Control Plan
 Chapter VII. Falls Lake Project -- Water Control Plan (This January 2000 revision incorporates approved structural and guide curve changes made at Falls Dam per 1994 EA/1995 FONSI to address storage shortage.)
Song Lake Water Budget
 Song Lake Water Budget Song Lake is located in northern Cortland County. It is a relatively small lake, with a surface area of about 115 acres, and an average depth of about 14 feet. Its maximum depth
Folsom Dam Water Control Manual Update
 Folsom Dam Water Control Manual Update Stakeholder Discussion February 28 & March 28, 2013 Location: Tsakopoulos Library Galleria, 828 I Street, Sacramento US Army Corps of Engineers WELCOME AND INTRODUCTIONS
ROGUE BASIN PROJECT CONSERVATION RELEASE SEASON OPERATING PLAN WATER YEAR 2018
 ROGUE BASIN PROJECT CONSERVATION RELEASE SEASON OPERATING PLAN WATER YEAR 2018 1. General Operational planning for the conservation release season for the Rogue Basin Project begins with the January forecast
Los Angeles 3 rd Regional
 Los Angeles 3 rd Regional Investors Conference Los Angeles, California March 31, 2016 Metropolitan Water District of Southern California 1 Metropolitan Water District of of Southern California 2 Metropolitan
South Platte River Importance of Return Flows and Replacing Depletions to Down-Stream Water Users
 South Platte River Importance of Return Flows and Replacing Depletions to Down-Stream Water Users American Ground Water Trust Colorado Aquifer Management November 29 th, 2012 Jim Yahn, P.E. North Sterling
Administration Division Public Works Department Anchorage: Performance. Value. Results.
 Administration Division Anchorage: Performance. Value. Results. Mission Provide administrative, budgetary, fiscal, and personnel support to ensure departmental compliance with Municipal policies and procedures,
Summary of Flow and Water Quality Conditions Willamette Basin Science Review February 4-6, 2014
 Summary of Flow and Water Quality Conditions Willamette Basin Science Review February 4-6, 2014 Prepared by: U.S. Army Corps of Engineers, Portland District, January 2014 The following document summarizes
US Columbia Operations Overview. Columbia Basin Advisory Committee
 US Columbia Operations Overview Columbia Basin Advisory Committee October 27, 2015 The Role of Reservoir Storage The The Role Role of of of Reservoir Storage Reservoir Inflow Reservoir Level Electricity
Flow-ecology relationships. Flow-ecology relationships Susitna case study
 Flow-ecology relationships Flow-ecology relationships Susitna case study Flow regime Ecologically-Relevant Flow Regime Characteristics Seasonal or typical conditions Annual extreme conditions High and
Putting Title 22 Water to Beneficial Use in the Central Valley
 Central Valley Watereuse Chapter Meeting April 17 th, 2014 Putting Title 22 Water to Beneficial Use in the Central Valley North Valley Regional Recycled Water Program (NVRRWP) Presenters: Will Wong, City
Gail Melgren, Executive Director, Tri-State Water Resources Coalition. Southwest Missouri Water Resource Study: Summary of Phases
 Memorandum To: From: Gail Melgren, Executive Director, Tri-State Water Resources Coalition Donie Grimsley, CDM Smith Date: (Current as of July 13, 2016) Subject: Southwest Missouri Water Resource Study:
November 7, SUBJECT: Power System Value of Conserved Irrigation Diversions
 Henry Lorenzen Chair Oregon Bill Bradbury Oregon Guy Norman Washington Tom Karier Washington W. Bill Booth Vice Chair Idaho James Yost Idaho Jennifer Anders Montana Tim Baker Montana November 7, 2017 MEMORANDUM
The Confluence Model. Presentation to Modeling and Forecasting Working Group January 21, 2015
 The Confluence Model Presentation to Modeling and Forecasting Working Group January 21, 2015 Introductions Presenter: Gary Fiske Working Group Water Department staff Objective: Penetrate the Black Box
Does Water Resources Management in the Snake River Basin Matter for the Lower Columbia River? Or Is the Snake River Part of Another Watershed?
 Does Water Resources Management in the Snake River Basin Matter for the Lower Columbia River? Or Is the Snake River Part of Another Watershed? John C. Tracy, Director Idaho Water Resources Research Institute
/L14t/ CONFODENTUAL. 6kMan. Hydro S. M.WANG K. M. SYDOR J. J. MALENCHAK PREPARED BY: CHECKED BY: APPROVED BY: NOTED BY: E. TEKLEMARIAM I DATE:
 KEEYASK GENERA lyon PROJECTSTA GE IV STUDIES-PHYSICAL ENVIRONMENT GN-9. 1.1- EXISTING AND PROJECT ENVIRONMENT flow FILES Water Resources Engineering Department Power Planning Division PREPARED BY: S. M.WANG