Cultural accelerated by anthropogenic activities
|
|
|
- Avice Bennett
- 6 years ago
- Views:
Transcription
1 EUTROPHICATION IMPLICATIONS OF N & P Intent of this lecture? Link our discussions of terrestrial N & P dynamics with its influences on receiving water bodies How the relative amounts of N & P can influence the growth and type of algae Making the connection between chemical pollution and biological problems Lecture based on Val H. Smith Cultural eutrophication of inland, estuarine, and coastal waters. In Successes, Limitations and Frontiers in Ecosystem Science. M. L. Pace & P. M. Groffman (Editors), Springer Verlag, NY Pgs And Aquatic Pollution Edward Laws This article highlights the important milestones in eutrophication research and provides an up to date discussion of N & P controls Natural versus Cultural Eutrophication Cultural accelerated by anthropogenic activities 1
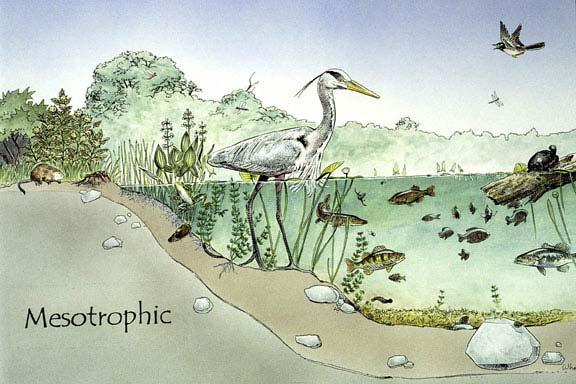
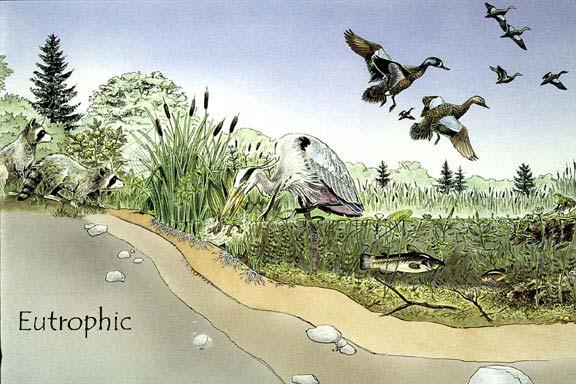
2 Introduction brief history Productivity of water bodies research initiated in Europe work of Einar Naumann (Sweden) and August Theinemann (Germany) Naumann developed the Trophic State Concept o Phytoplankton production determined by concentrations of nitrogen and phosphorus o Productivity of lakes varied with the geological characteristics of the watersheds Naumann also developed the terms that we use to categorize lakes based on their productivity and nutrient supplies 1. OLIGOTROPHIC 2. MESOTROPHIC 3. EUTROPHIC 4. HYPEREUTROPHIC 2

3 Mean values for the trophic classification system Condition Total P (µg L -1 ) Chlorophyll a (µg L -1 ) Secchi disk depth (m) Ultra-Oligotrophic <4 <1 >12 Oligotrophic <10 <2.5 >6 Mesotrophic Eutrophic Hypereutrophic >100 >25 <1.5 3
4 4
5 5
6 6
7 Eutrophication studies began in the 1940s and published work peaked in the 1980s / 90s. These studies were conducted via Comparative analyses of different water bodies over time and space, and Experimentation at three different scales 1. small-scale flask experiments such as bio-assays 2. medium-scale experiments such as mesocosms 3. whole-system manipulations (whole-lake experiments) 7
8 Nitrogen & Phosphorus as limiting nutrients First important development in eutrophication research identification of N & P Driven by Leibig s Law of the Minimum (1855) The yield of a given species should be limited by the nutrient that was present in the least quantity in the environment relative to its demands for growth Variables for eutrophication Sunlight Silica N P Leibig s law resulted in the concept of nutrient limitation for algal growth 1. a single nutrient should be the primary limiting factor for algal growth 2. observed algal growth should be proportional to the supply of the limiting nutrient 3. Practical control of the growth of algae can be accomplished via restricting the supply of the nutrient. 8
9 N & P were identified as the primary limiting nutrients -- this recognition was arrived at primarily by using bioassays. Other approaches used Physiological indicators Elemental ratios the ratio of N and P concentrations in the vegetation Redfield (1958) proposed that the nutrient content of living algal cells can be given by a 7:1 by mass for N:P, or elemental ratio of 16:1 for N:P -- referred to as the Redfield ratio Given mass ratio, how would you compute the elemental ratio? This concept was extended to determine N & P controls If N:P supply > Redfield ratio P limiting If N:P supply < Redfield ratio N limiting However later work showed that algae are composed of many species with varying N:P ratio (3 30) and thus a single ratio was not very effective in determining N or P limitation 9
10 This variability was evident in Sakamoto s (1966) results when TN:TP < 10:1 N limitation when TN:TP > 17:1 P limiting between 10:1 17:1 either N or P What implications does this have? 10
11 Nutrient Loading Models (2 nd important development) Development of mass budgets for N & P for water bodies and the linkage of input/outputs with waterbody concentrations Initially received with considerable skepticism; Thienemann remarked that the concept had nothing to do with limnology. Vollenweider, Reckhow and Chapra leading proponents of the mass balance approach Mass balance approaches since then have become a cornerstone of ecosystem science research Models are based on the hydraulic characteristics of the water body depth, flow rate, length, etc. factors that 11
12 determine the residence time or turnover time of the waterbody P models have received most of the attention. Example of P model TP in lake P concentration (mg/m 3 ) P TP = in t w 0.82 where P in is the mean annual P concentration in inflow, and t w is the residence time (yrs) how would you compute the residence time of a lake? Compared to N, P models have also been easier to formulate why? Also we have had more success in formulating mass balance models for freshwater systems than marine systems -- difficult to identify boundaries of marine water bodies; considerable mixing of waters 12
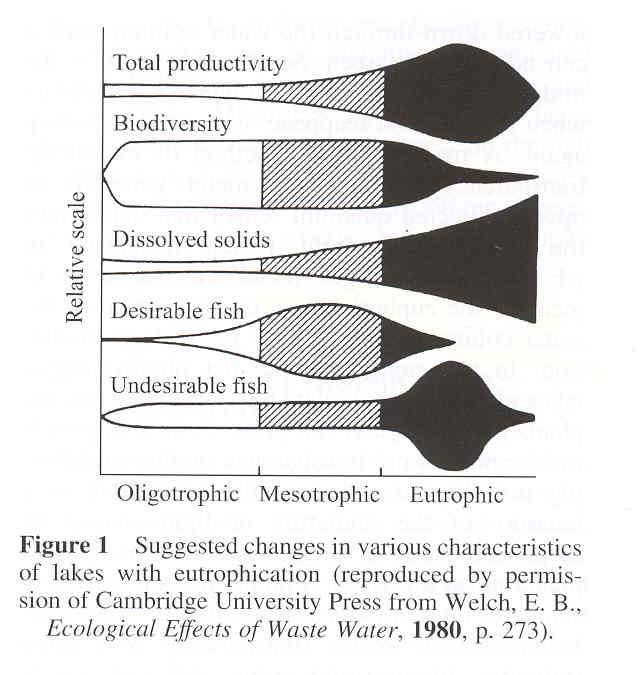
13 Effects of nutrients on aquatic systems 3 rd important development Linking nutrient concentrations to water quality variables of concern e.g., algal biomass, water clarity, etc. Our perception/classification of eutrophication for freshwater and marine waters varies! NOTE lower thresholds (chlorophyll, clarity) for marine waters 13
14 The controls that N and P have for eutrophication also varies with these waters Most of the freshwater lakes and reservoirs are limited by P Strong relationships have been found between the concentrations of P and algal mass (measured sometimes as the chlorophyll-a content) Figure data for phytoplankton floating algae in water bodies 2 observations from the figure hyperbolic relationship with P, with decreasing algal yields beyond TP > 100 mg/m 3 14
 as P concentration increases Similar controls of P for")
.")
15 Figure also indicates the shifts in limiting nutrient (becomes N limited) as P concentration increases Similar controls of P for periphyton (algae attached to substrate) in streams and rivers have also been observed periphyton in Scajaquada Creek in Buffalo (2002). Figure


16 Suspended algae in streams also show P influences. These algae originate from periphyton. suspended algae in Scajaquada Creek in Buffalo (2002) 16
17 However the mass of suspended algae in streams at a given level of P is much lower than the equivalent biomass of phytoplankton in lakes 17
 3.")
18 In contrast, in marine systems the phytoplankton biomass is more tied to the N concentrations suggesting that these systems are N-limited Why? Likely reasons 1. P sequestration by Fe and Al oxides in freshwater systems 2. Fe and Mo availability for N-fixing bacteria in freshwater systems (Fe and Mo are very low in marine waters) 3. High losses of N due to denitrification in marine waters However, some studies (Hecky & Kilham, 1988) have shown that N-limitation may not be applicable always. Inability to define a well contained system has also limited a more thorough understanding of the N and P controls on marine phytoplankton 18
19 N & P Mixing issues of stratification and overturning Stratification of the lake because of the water temperature gradients during seasons Stratification occurs because of the variation in the density of water with temperature - water most dense at 4 degree C - less dense above and below 4 degree C 19
20 Mixing is limited to specific zones Surface mixing occurs in the epilimnion maybe 1m deep in summer or as much as 100 m under destabilized conditions. Epilimnion water will not mix with the hypolimnion when stratification is in place. After summer - When surface water temperatures cool up reach 4 degree C the surface water sinks causes mixing and overturning! --- Fall Overturn If surface temps drop below 4C, again stratification will take place 20
21 In spring when surface waters warm up and go beyond 4C you will have the spring overturn! Two overturning periods dimictic One overturning period monomictic Two important functions of overturning: 1. oxygenation of the hypolimnion by sinking surface waters 2. nutrient enrichment of the epilimnion by rising bottom waters Nutrient availability with autumn and spring overturns Table: 21
22 Susceptibility of water bodies to O 2 depletion: Deep oligotrophic systems do NOT suffer depletion Low productivity in epilimnion respiratory rates not high enough The large depth of hypolimnion provides more than enough O 2 to meet any likely demands Shallow eutrophic systems do not develop seasonal depletion because the mixing layer extends to the bottom But shallow eutrophic systems may develop low O 2 conditions overnight under no wind or calm weather conditions (when the mixing mechanism is shut off) --- example the shallow western basin of Lake Erie Eutrophic systems with intermediate depths most likely to be seasonally depleted by O 2 - hypolimnion is small in depth - high production in the epilimnion - e.g., - central basin of Lake Erie. Seasonal depletions of O 2 do not cause mass die off s of fish and aquatic species it s the overnight O 2 depressions that do! 22

23 Salinity gradients can also affect mixing/stratification Occurs in estuaries e.g, the Chesapeake Bay. May occur in conjunction with the temperature gradients and make the scenario even worse. In the Chesapeake Bay increased inflows of freshwater make the O2 depletion condition worse. Increasing urbanization (impervious surfaces) are expected to increase flows. 23
24 Chesapeake Bay N and P limitations Vary with season! Late winter/early spring greatest outflows in the bay. Runoff rich in N from fertilizer applications Most severe phytoplankton blooms occur in late winter/spring N:P ratio of water can be as high - 90:1 P limiting conditions! Summer Runoff from watersheds is lowest Internal P release from bottom sediments due to bacterial decomposition N:P ratio of bay water can be as low as 5:1 N limits phytoplankton growth! Hypoxia in the bay number of factors Nutrients 24
25 Freshwater runoff in spring Oysters shell fish filter feeders of bacteria (bacteria responsible too for oxygen depletion!) 25
 cynobacteria mass o Problem with cynobacteria is that these species produce potent toxins")
26 N & P influences on phytoplankton community structure The relative concentrations of N & P not only effect the biomass but can also cause shifts in the species type Cynobacteria blooms have been associated with N limiting conditions (Cynobacteria are bacteria with chlorophyll and NOT a class of algae) cynobacteria mass o Problem with cynobacteria is that these species produce potent toxins that impact other aquatic species o Cynobacteria have also been found under excessive eutrophic conditions figure
27 The resource-ratio theory has been used to explain the appearance of cynobacteria under N limiting conditions o Resource-ratio theory supplies of N, P, and silicon and light are important determinants of algal species composition Under N limiting conditions cynobacteria that are better N scavengers than other species, out-compete the other algal species. Blue-green algae can fix their own N! 27
28 This relationship is highlighted in Figure 2.7 (relative cynobacterial biomass increases for lower N:P ratios) Implications of low N:P for plankton type???? 28
29 Management Implications for N:P ratio loadings Virginia Coastal Plain Example BMP implementation decreased the N:P ratio of exports from the watershed much more needs to be done for P control total-p total-n particulate-p soluble-org-p ortho-p pre-bmp post-bmp particulate-n soluble-org-n nitrate-n ammon-n loads (kg/ha) 29
30 N:P ratio QN1 pre-bmp post-bmp NOTE: elemental N : P ratio 30
Link our discussions of terrestrial N & P dynamics with its influences on receiving water bodies
 EUTROPHICATION AND HARMFUL ALGAL BLOOMS (HABs) Intent of this lecture? Link our discussions of terrestrial N & P dynamics with its influences on receiving water bodies How the relative amounts of N & P
Interpreting Lake Data
 Interpreting Lake Data Indiana Clean Lakes Program The Indiana Clean Lakes Program was created in 1989 as a program within the Indiana Department of Environmental Management's (IDEM) Office of Water Management.
Long-Term Volunteer Lake Monitoring in the Upper Woonasquatucket Watershed
 Long-Term Volunteer Lake Monitoring in the Upper Woonasquatucket Watershed Linda Green URI Watershed Watch 1-87-95, lgreen@uri.edu WATER QUALITY IS A REFLECTION OF THE ACTIVITIES IN THE LANDS AND WATERS
Interpreting Lake Data
 Interpreting Lake Data Indiana Clean Lakes Program The Indiana Clean Lakes Program was created in 1989 as a program within the Indiana Department of Environmental Management's (IDEM) Office of Water Management.
EUTROPHICATION. Student Lab Workbook
 EUTROPHICATION Student Lab Workbook THE SCIENTIFIC METHOD 1. Research Background literature research about a topic of interest 2. Identification of a problem Determine a problem (with regards to the topic)
Nutrients, Algal Blooms and Red Tides in Hong Kong Waters. Paul J. Harrison and Jie XU
 Nutrients, Algal Blooms and Red Tides in Hong Kong Waters Paul J. Harrison and Jie XU Division of Environment, Hong Kong University of Science & Technology 1. Introduction The Pearl River is China's second
White Lake 2017 Water Quality Report
 Introduction Watersheds Canada believes that every person has the right to access clean and healthy lakes and rivers in Canada. We work to keep these precious places naturally clean and healthy for people
CHEMICAL: NITROGEN AND PHOSPHORUS (read pp in Dodson)
") BIOE 155, Fall 010 BACKGROUND CHEMICAL: NITROGEN AND PHOSPHORUS (read pp39-50 in Dodson) Lakes are often classified according to trophic status, specifically how much energy or food is available for the
BIOE 155, Fall 010 BACKGROUND CHEMICAL: NITROGEN AND PHOSPHORUS (read pp39-50 in Dodson) Lakes are often classified according to trophic status, specifically how much energy or food is available for the
Lake Washington. Water Quality Assessment Report. Copyright 2012 PLM Lake & Land Management Corp.
 Lake Washington 2012 Water Quality Assessment Report Copyright 2012 PLM Lake & Land Management Corp. Water Quality Report On May 22nd, June 18th, July 30th, August 29th, and September 27 th, 2012, PLM
Physics, Chemistry, and Biology in Ponds and Lakes
 Physics, Chemistry, and Biology in Ponds and Lakes Ponds and Lakes Dominated by Heterotrophic Processes Example. A well mixed lake with V = 5x10 8 L is fed by a stream flowing at Q=2.4x10 7 L/d that contains
Lecture 5 CE 433. Excerpts from Lecture notes of Professor M. Ashraf Ali, BUET.
 Lecture 5 CE 433 Excerpts from Lecture notes of Professor M. Ashraf Ali, BUET. Surface Water Quality: Lakes and Reservoirs Lakes can be classified according to the degree of enrichment of nutrient and
Physics, Chemistry, and Biology in Ponds and Lakes
 11//1 Physics, Chemistry, and Biology in Ponds and Lakes Ponds and Lakes Dominated by Heterotrophic Processes Example. A well mixed lake with V = x1 8 L is fed by a stream flowing at Q=.x1 7 L/d that contains
Chapter Seven: Factors Affecting the Impact of Nutrient Enrichment on the Lower Estuary
 Chapter Seven: Factors Affecting the Impact of Nutrient Enrichment on the Lower Estuary As presented in Chapter Six, the water quality data for the upper stations of the tidal freshwater Potomac Estuary
Lakes: Primary Production, Budgets and Cycling
 OCN 401-Biogeochemical Systems (9.28.17) Lakes: Primary Production, Budgets and Cycling Reading: Schlesinger, Chapter 8 Lecture Outline 1. Seasonal cycle of lake stratification Temperature / density relationship
Envirothon Aquatics. Mike Archer, NE Dept. of Environmental Quality. Katie Pekarek, Nebraska Extension Jeff Blaser, Nebraska Game and Parks
 Envirothon Aquatics Mike Archer, NE Dept. of Environmental Quality Katie Pekarek, Nebraska Extension Jeff Blaser, Nebraska Game and Parks Lake Watersheds Watershed = area contributing water to pond Surface
Classification of systems. Aquatic Ecosystems. Lakes 9/9/2013. Chapter 25
 Aquatic Ecosystems Chapter 25 Classification of systems Aquatic systems classified by physical environment Salinity most important Marine divided broadly into coastal and open water Freshwater divided
Lakes: Primary Production, Budgets and Cycling. Lecture Outline
 OCN 401-Biogeochemical Systems (10.06.16) Lakes: Primary Production, Budgets and Cycling Reading: Schlesinger, Chapter 8 Lecture Outline 1. Seasonal cycle of lake stratification Temperature / density relationship
Lecture 9. Nutrient and BOD Overloading in Fresh Waters
 Lecture 9 Nutrient and BOD Overloading in Fresh Waters Reading: chapter 4 (this week and next) Today 1. Nutrient cycles and Nutrient Overloading Next Time 2. OM (organic matter) and BOD (biological oxygen
Limnology 101. PA AWWA SE District & Eastern Section WWOAP Joint Technical Conference October 13, 2016
 Limnology 1 PA AWWA SE District & Eastern Section WWOAP Joint Technical Conference October, 2 Kristen Bowman Kavanagh, P.E. Flow Science Incorporated Limnology is the study of the biological, chemical,
Use of Vollenweider-OECD Modeling to Evaluate Aquatic Ecosystem Functioning
 R. Anne Jones 1 and G. Fred Lee 1 Use of Vollenweider-OECD Modeling to Evaluate Aquatic Ecosystem Functioning REFERENCE: Jones, R. A. and Lee, G. F., Use of Vollenweider-OECD Modeling to Evaluate Aquatic
Lakes, Primary Production, Budgets and Cycling
 OCN 401-Biogeochemical Systems Lecture #10 (9.22.11) Lakes, Primary Production, Budgets and Cycling (Schlesinger: Chapter 7) 1. Primary Production and Nutrient Cycling in Lakes Physical aspects and nomenclature
2016 Summit Lake Water Quality Report Prepared by Thurston County Environmental Health Division
 ! 216 Summit Lake Water Quality Report Prepared by Thurston County Environmental Health Division PART OF TOTTEN INLET WATERSHED LENGTH OF LAKE: 2.2 miles SHORELINE LENGTH: 5.6 miles LAKE SIZE: 53 acres
Ponds: Careful of the Fish!
 Ponds: Careful of the Fish! Dr. Chuck Cichra Extension Fisheries Specialist University of Florida / IFAS SFRC - Program of Fisheries & Aquatic Sciences All Plants Need Water, Light, and Nutrients Aquatic
Understanding the Basics of Limnology
 Understanding the Basics of Limnology Outline Watershed Processes Lake Formation Physical Features of Lakes Lake Processes Lake Chemistry Lake Biology Lake Management WATERSHED PROCESSES A Lake is a Reflection
Okanagan Large Lakes Water Quality Monitoring Program Ellison Lake Wood Lake Kalamalka Lake Okanagan Lake Skaha Lake Osoyoos Lake
 Okanagan Large Lakes Water Quality Monitoring Program Ellison Lake Wood Lake Kalamalka Lake Okanagan Lake Skaha Lake Osoyoos Lake 1 Table of Contents Goals & Objectives... Trophic Status... Data Collection...
Little Bay Water Quality Report Card Spring 2014
 Little Bay Water Quality Report Card Spring 2014 Little Bay is a small, semi-enclosed estuary located in the heart of Rockport, Texas. Estuaries, where freshwater from rivers and streams mixes with salt
Lakes, Primary Production, Budgets and Cycling Schlesinger and Bernhardt (2013): Chapter 8, p
: Chapter 8, p") OCN 401-Biogeochemical Systems Lecture #12 (10.8.13) Angelos Hannides, hannides@hawaii.edu Lakes, Primary Production, Budgets and Cycling Schlesinger and Bernhardt (2013): Chapter 8, p. 288-308 1. Physical
OCN 401-Biogeochemical Systems Lecture #12 (10.8.13) Angelos Hannides, hannides@hawaii.edu Lakes, Primary Production, Budgets and Cycling Schlesinger and Bernhardt (2013): Chapter 8, p. 288-308 1. Physical
CBF Water Quality Interactive Map
 CBF Water Quality Interactive Map Student and adult groups that take part Often, they measure the water chemistry to evaluate the be doing it when you come out with us! By compiling these points on a map
Kill the Weeds, Not the Fish!
 Kill the Weeds, Not the Fish! Dr. Chuck Cichra University of Florida / IFAS School of Forest Resources & Conservation Program in Fisheries & Aquatic Sciences My goal is for you to have a better understanding
Phosphorus Goal Setting Process Questions and Answers 2010
 Lake Winnipesaukee Watershed Management Plan Phase I: Meredith, Paugus, Saunders Bays 1. What is phosphorus? Phosphorus (P) is a naturally occurring element and a major nutrient required for biological
Water Quality Analysis of Lakewood Lakes
 Water Quality Analysis of Lakewood Lakes December 2016 Prepared by WEST Consultants, Inc. Bellevue, Washington With support from HDR, Inc., Olympia, Washington TABLE OF CONTENTS EXECUTIVE SUMMARY... V
Primer on Pond & Lake Ecology & Watershed Dynamics
 Primer on Pond & Lake Ecology & Watershed Dynamics The water quality of a lake is often described as a reflection of its surrounding watershed. The term lake collectively refers to reservoirs (man-made
Dead-Zones and Coastal Eutrophication: Case- Study of Chesapeake Bay W. M. Kemp University of Maryland CES Horn Point Laboratory Cambridge, MD
 Dead-Zones and Coastal Eutrophication: Case- Study of Chesapeake Bay W. M. Kemp University of Maryland CES Horn Point Laboratory Cambridge, MD Presentation to COSEE Trends Orientation at UMCES HPL 4 August
An Introduction to The Ecology of Lakes, Ponds and Reservoirs. Developing a Management Plan
 An Introduction to The Ecology of Lakes, Ponds and Reservoirs Developing a Management Plan Stephen J. Souza, Ph.D. Princeton Hydro, LLC 1108 Old York Road Ringoes, NJ 08551 ssouza@princetonhydro.com Objective
Freshwater Responses to Nitrogen and Phosphorus Pollution and a Case Study of Cutler and Dingle Marsh Wetlands
 Utah State University DigitalCommons@USU Watershed Sciences Faculty Publications Watershed Sciences 2009 Freshwater Responses to Nitrogen and Phosphorus Pollution and a Case Study of Cutler and Dingle
Glossary. hefreediction ary.com/algae. hefreediction ary.com/anth
 Algae noun Any of various chiefly aquatic, eukaryotic, photosynthetic organisms, ranging in size from single-celled forms to the giant kelp. Algae were once considered to be plants but are now classified
EUTROPHICATION. Teacher s Manual
 EUTROPHICATION Teacher s Manual Preface The following is a, hands on, and inquiry based lesson plan developed by COSEE Mid-Atlantic for teaching eutrophication. The National Education Science Standards
Water Quality Monitoring Stations
 Water Quality Monitoring Stations Eastern Basin Race Narrows Western Basin Central Basin The CT Department of Environmental Protection (CT DEP) conducts a water quality CT DEP monitoring program for the
Continuous records for the Chariton River indicate that 2004 was an average water year, with total flow approximately equal to the average annual
 2004 Rathbun Report Iowa State University Limnology Laboratory John A. Downing, Ph.D. George Antoniou, Assistant Scientist For Rathbun Land and Water Alliance August 31, 2005 A. Tributaries Personnel of
LIMNOLOGY. Inland Water Ecosystems. JACOB KALFF McGill University. Prentice Hall. Upper Saddle River, New Jersey 07458
 LIMNOLOGY Inland Water Ecosystems JACOB KALFF McGill University Prentice Hall Prentice Hall Upper Saddle River, New Jersey 07458 Contents CHAPTER 1 Inland Waters and Their Catchments: An Introduction and
Hydrology 101. Impacts of the Urban Environment. Nokomis Knolls Pond Summer June 2008
 Hydrology 101 Nokomis Knolls Pond Summer 2002 Impacts of the Urban Environment Hydrologic Cycle; What is it? Geography, Topography, Geology, Land Cover and Climate determine the Amount and Behavior of
North Dakota s Nutrient Reduction Strategy. Presented to the 2016 ND Water Quality Monitoring Conference March 4, 2016
 North Dakota s Nutrient Reduction Strategy Presented to the 2016 ND Water Quality Monitoring Conference March 4, 2016 Nutrients Nutrients, in appropriate amounts, are essential to the growth and health
2017 Water Quality Report and Historical Analysis. Long Lake Mickey Lake Ruth Lake. Monitoring Years
 2017 Water Quality Report and Historical Analysis Long Lake Mickey Lake Ruth Lake Monitoring Years 1993-2017 Submitted to: Long Lake Association October 2017 Prepared by: Great Lakes Environmental Center
2. Understand the cause and consequences of thermal stratification, and the patterns of mixing in lakes of different depth and latitude.
 1 Ecosystems & Ecophysiology Lecture 4 Lakes & Ponds Objectives 1. Know the geological origin of major lake types. 2. Understand the cause and consequences of thermal stratification, and the patterns of
7.9 Nitrogenous Nutrients and Plankton Production in Jamaica Bay, NY
 7.9 Nitrogenous Nutrients and Plankton Production in Jamaica Bay, NY Ray Sambrotto 7.9.1 SUMMARY Two blooms characterize phytoplankton growth in Jamaica Bay: the winter/spring bloom, between February and
Nitrogen Cycling, Primary Production, and Water Quality in the New River Estuary. Defense Coastal/Estuarine Research Program (DCERP)
") Nitrogen Cycling, Primary Production, and Water Quality in the New River Estuary Defense Coastal/Estuarine Research Program (DCERP) Introduction: A key theme of the ongoing DCERP program is monitoring
Nitrogen Cycling, Primary Production, and Water Quality in the New River Estuary Defense Coastal/Estuarine Research Program (DCERP) Introduction: A key theme of the ongoing DCERP program is monitoring
Fish Conservation and Management
 Fish Conservation and Management CONS 486 Trophic pyramids, food webs, and trophic cascades oh my! Ross Chapter 2, Diana Chapter 1 Trophic interactions Limnological classification review Trophic pyramids
Portage Lake CASS COUNTY
 Portage Lake 11-0204-00 CASS COUNTY Summary Portage Lake is located near Bena, MN in Cass County. It covers 1,539 acres, which places it in the upper 10% of lakes in Minnesota in terms of size. Portage
Water Monitoring in Spa Creek: A Summary
 Water Monitoring in Spa Creek: A Summary Written by: Alexis Jones & Blake Harden Edited by: Hannah Krauss Water monitoring is very important in order to determine the health of the Chesapeake Bay and its
Appendix A. General Concepts in Lake Water Quality. Black Dog WMO Watershed Management Plan P:\23\19\513\plan\Black Dog WMO adopted plan.
 Appendix A General Concepts in Lake Water Quality Black Dog WMO Watershed Management Plan P:\23\19\513\plan\Black Dog WMO adopted plan.doc General Concepts in Lake Water Quality There are a number of concepts
CLMP+ Report on Grass Lake (Anoka County) Lake ID# CLMP+ Data Summary
 Lake ID# CLMP+ Data Summary") CLMP+ Report on Grass Lake (Anoka County) Lake ID# 02-0113-00 2012-2013 CLMP+ Data Summary October 2014 Authors Shannon Martin, MPCA Editing and graphic design Public Information Office Staff The (MPCA)
CLMP+ Report on Grass Lake (Anoka County) Lake ID# 02-0113-00 2012-2013 CLMP+ Data Summary October 2014 Authors Shannon Martin, MPCA Editing and graphic design Public Information Office Staff The (MPCA)
Fact Sheet. Chesapeake Bay Water Quality
 Fact Sheet Chesapeake Bay Water Quality Water quality is a critical measure of the Chesapeake Bay s health. For the Bay to be healthy and productive, the water must be safe for people and must support
Redwood Shores Lagoon November 2016 Monthly Water Quality Monitoring Report
 Redwood Shores Lagoon November 2016 Monthly Water Quality Monitoring Report Prepared for Redwood City Public Works Services Department 1400 Broadway Redwood City, CA 94063-2594 Prepared by Clean Lakes,
Redwood Shores Lagoon February 2019 Monthly Water Quality Monitoring Report
 Redwood Shores Lagoon February 2019 Monthly Water Quality Monitoring Report Prepared for Redwood City Public Works Services Department 1400 Broadway Redwood City, CA 94063-2594 Prepared by Clean Lakes,
Water quality and Climate Change The case of Lake Ammersee, Bavaria
 Water quality and Climate Change The case of Lake Ammersee, Bavaria Mark Vetter & Friedrich Barnikel In the 20 th century, nutrient concentrations in several lakes in Europe by and large have increased
Nutrients and Ecosystems
 Nutrients and Ecosystems Fertilizer Application Rates Lawns: Athletic Fields: Pastures (Dairy): Vegetables: Corn: Citrus: Forests: 80-240 kg N/ha/yr 200-280 kg N/ha/yr 240-360 kg N/ha/yr 180-200 kg N/ha/yr
Assessment of Climate Change for the Baltic Sea Basin
 The BACC Author Team Assessment of Climate Change for the Baltic Sea Basin 4u Springer Contents Preface The BACC Author Team Acknowledgements V VII XIII 1 Introduction and Summary 1 1.1 The BACC Approach
Lake Whatcom Water Quality - Presentation to Bellingham City Council
 Western Washington University Western CEDAR Lake Whatcom Other Reports Lake Whatcom 7-6-2015 Lake Whatcom Water Quality - Presentation to Bellingham City Council Robin A. Matthews Western Washington University,
Part I: Salish Sea Introduction. Review:
 Part I: Salish Sea Introduction Review: The Salish Sea The Salish Sea was formed about 20,000 years ago during the last ice age by the carving action of glaciers. There are 3 major parts of the Salish
The Impact of Excess Phosphorus on Minnesota s Lakes and Rivers presented at SERA 17 November 2015
 The Impact of Excess Phosphorus on Minnesota s Lakes and Rivers presented at SERA 17 November 2015 Steven Heiskary Research Scientist III Environmental Analysis and Outcomes Division Overview 1. Minnesota
How may climate change affect shallow inland lakes of New York State? A simple question with a complex answer
 How may climate change affect shallow inland lakes of New York State? A simple question with a complex answer Bruce Gilman, Professor and Director Muller Field Station Finger Lakes Community College 3325
Understanding Nutrients and Their Affects on the Environment
 Understanding Nutrients and Their Affects on the Environment Humans & Ecosystems Humans are just like ecosystems, too much or too little of a nutrient is bad for the system. Nutrient management is a balancing
Impacts to Aquatic Habitats from Land-Use or Is It Polluted?
 Impacts to Aquatic Habitats from Land-Use or Is It Polluted? Water Pollution is: The addition of excessive carbon to a system The addition of large amounts of materials to water that causes adverse changes
Redwood Shores Lagoon May 2017 Monthly Water Quality Monitoring Report
 Redwood Shores Lagoon May 2017 Monthly Water Quality Monitoring Report Prepared for Redwood City Public Works Services Department 1400 Broadway Redwood City, CA 94063-2594 Prepared by Clean Lakes, Inc.
Water intake for hatchery on Chattahoochee River
 Lake Lanier Turnover Facts Buford Trout Hatchery gets the water used to grow trout from the tailwater area of the Chattahoochee River immediately below Lake Lanier. Natural processes occurring in the lake
Eutrophication. Pollution Effects on Society
 Eutrophication Pollution Effects on Society Eutrophication What is eutrophication? Eutrophication is a natural process by which lakes and reservoirs become more productive as a result of increased nutrient
Predicting algal bloom dynamics in a changing climate
 Predicting algal bloom dynamics in a changing climate Predicting algal bloom dynamics in a changing climate R.J. Sorichetti, S. Sharma, A.M. Paterson, J.A. Rusak, H. Yao York University and Ontario Ministry
Nutrient Limitation of Phytoplankton By Nitrogen and Phosphorus: Erosion of the Phosphorus Paradigm
 Utah State University DigitalCommons@USU Watershed Sciences Faculty Publications Watershed Sciences 2009 Nutrient Limitation of Phytoplankton By Nitrogen and Phosphorus: Erosion of the Phosphorus Paradigm
Aquatic Science Unit 1. Introduction to Freshwater Ecology
 Aquatic Science Unit 1 Introduction to Freshwater Ecology Water is essential to life Water is essential to the survival of all living things No living organism can survive without water Humans cannot go
Suspended Sediments. A lgae. Factors that Affect Water Clarity
 Factors that Affect Water Clarity Water clarity is a measure of the amount of particles in the water, or the extent to which light can travel through the water. There are many ways to express water clarity,
LAKE PARTNER PROGRAM. Report Card 2015
 LAKE PARTNER PROGRAM Report Card 2015 Contents 1 What This Report Tells You 2 Ontario s Lakes 3 What is the Lake Partner Program? 5 Total Phosphorus 8 Calcium 10 Water Clarity 12 Moving Forward What You
Annex 4 Nutrients Great Lake Executive meeting June 24 25, 2015
 Annex 4 Nutrients Great Lake Executive meeting June 24 25, 2015 June 10,2015 Susan Humphrey Environment Canada Tinka Hyde United States Environmental Protection Agency. Overview of presentation Targets
NEWSLETTER OF THE LAKES OF MISSOURI VOLUNTEER PROGRAM
 The Water Line NEWSLETTER OF THE LAKES OF MISSOURI VOLUNTEER PROGRAM Water Quality at The Lake A REVIEW OF SCIENTIFIC ARTICLES PUBLISHED ABOUT LAKE OF THE OZARKS Volume 13 Number 2 The University of Missouri
Human nutrient over-enrichment in coastal waterways and deltas; There s a long history
 www.marine.unc.edu/paerllab Human nutrient over-enrichment in coastal waterways and deltas; There s a long history Salomon van Ruysdael 1648 1 RN (ton/yr) Mississippi R. Basin Choptank R, Chesapeake Bay
Sediment Trapping and Inflow/Outflow Phosphorus Turnover
 Sediment Trapping and Inflow/Outflow Phosphorus Turnover By: Dan Carey Field Research If you have ever been swimming in Lake Eau Claire you know exactly what everyone else on the lake is also thinking,
Understanding Lake Data
 Understanding Lake Data Moriya Rufer Environmental Services Director moriya.rufer@rmbel.info Ellie Kriese Lakes Program Coordinator ellie.kriese@rmbel.info Why We re Here Take Homes Learn how to access
Water Quality Assessment in the Thames River Watershed
 Water Quality Assessment in the Thames River Watershed Nutrient Trends Karen Maaskant, Upper Thames River Conservation Authority 2015 Lake St. Clair Conference October 21, 2015 Outline Thames River watershed,
After reviewing data collected from ISLAND POND, STODDARD, the program coordinators have made the following observations and recommendations.
 OBSERVATIONS & RECOMMENDATIONS After reviewing data collected from ISLAND POND, STODDARD, the program coordinators have made the following observations and recommendations. Thank you for your continued
Ecosystem Consulting Service, Inc. July 15, P a g e
 Prepared for: Normanoch Association Prepared by: Robert W. Kortmann, Ph.D. Ecosystem Consulting Service, Inc. July 17, 2014 Culver Lake Status 2014 (a brief mid-summer report) Cold water fish need water
Management of Water Quality Issues in Urban Stormwater Ponds
 Management of Water Quality Issues in Urban Stormwater Ponds Ryan Xu and Ricky Kwan Storm Consulting October 2018 Bringing engineering to life Presentation Outline 1.0 Background 2.0 Project Description
Monitoring Update April 1, Northeast Aquatic Research George Knoecklein Hillary Kenyon Sabina Perkins
 Monitoring Update April 1, 215 Northeast Aquatic Research George Knoecklein Hillary Kenyon Sabina Perkins Lake Monitoring Approach for 214 Tonight's discussion will focus on in-lake aspects: Assessment
Water Quality in Stormwater Ponds
 Water Quality in Stormwater Ponds Linking Nutrients, Algae and Dissolved Oxygen Erik M. Smith University of South Carolina, Baruch Marine Field Laboratory North Inlet - Winyah Bay National Estuarine Research
Development of Nutrient Criteria for Wyoming Streams and Lakes
 Development of Nutrient Criteria for Wyoming Streams and Lakes Eric Hargett Wyoming Department of Environmental Quality Water Quality Division Watershed Protection Program Monitoring Program Wyoming Nutrient
Continued from Lecture 20a
 IV. Primary Production (p.p.) Continued from Lecture 20a C. Biomass & Productivity 1. Biomass = mass of organic matter (in grams) a. Gross primary production = total amount of organic material synthesized
Particulate Soil Phosphorus and Eutrophication in Lakes and Streams
 Particulate Soil Phosphorus and Eutrophication in Lakes and Streams Paul R. Bloom Soil, Water, & Climate Department University of Minnesota With contributions by John Moncrief, Carl Rosen and David Mulla
Ecology and Animal Health
 Ecosystem Health and Sustainable Agriculture 2 Ecology and Animal Health Editors: Leif Norrgren and Jeffrey M. Levengood CSD Uppsala. Centre for sustainable development Eutrophication 6 Lennart Gladh World
What s Happening in Lake Whatcom?
 What s Happening in Lake Whatcom? Dr. Robin A. Matthews, Director Institute for Watershed Studies Huxley College of the Environment Western Washington University June 6, 2011 Site 2 Basin 2 Lake Whatcom
Southern California Bight 2008 Regional Monitoring Program: Volume VIII. Estuarine Eutrophication
 Technical Report 0711 Southern California Bight 2008 Regional Monitoring Program: Volume VIII. Estuarine Eutrophication K. McLaughlin 1, M. Sutula 1, L. Busse 2, S. Anderson 3, J. Crooks 4, R. Dagit 5,
The Lake Partner Program
 The Lake Partner Program Anna DeSellas Scientist, Inland Lakes Monitoring & Lake Partner Program Coordinator Dorset Environmental Science Centre 1 Phosphorus and water quality Phosphorus: A nutrient that
Carbon/Oxygen Cycle. By Ethan Hempel, Jess Meyers, Hannah Park, and Kelly Chan
 Carbon/Oxygen Cycle By Ethan Hempel, Jess Meyers, Hannah Park, and Kelly Chan Background When animals breathe, they take in oxygen and exhale carbon dioxide. Plants use carbon dioxide (along with water
AP Environmental Science
 AP Environmental Science Types of aquatic life zones MARINE Estuaries coral reefs mangrove swamps neritic zone pelagic zone FRESHWATER lakes and ponds streams and rivers wetlands Distribution of aquatic
MATHEMATICAL MODELS FOR MANAGEMENT OF EUTROPHIED LAKES
 MATHEMATICAL MODELS FOR MANAGEMENT OF EUTROPHIED LAKES Alla A. Nemtsova 1, Yevgeniy G. Ponomarenko 1, Felix V. Stolberg 2 1 National University of Pharmacy, ul. Pushkinskaja, 53, 61002, Kharkov, Ukraine,
SECTION 1 FRESHWATER SYSTEMS UNIT 4: AQUATIC ECOLOGY
 SECTION 1 FRESHWATER SYSTEMS UNIT 4: AQUATIC ECOLOGY CENTRAL CASE STUDY: STARVING THE LOUISIANA COAST OF SEDIMENT LOUISIANA IS LOSING 25MI2 OF COASTAL WETLANDS ANNUALLY WETLANDS SUPPORT A DIVERSITY OF
Ecosystems: Nutrient Cycles
 Ecosystems: Nutrient Cycles Greeks, Native Peoples, Buddhism, Hinduism use(d) Earth, Air, Fire, and Water as the main elements of their faith/culture Cycling in Ecosystems the Hydrologic Cycle What are
STATE OF THE BAY IN 2012
 9 10 11 STATE OF THE BAY IN 2012 Nitrogen &!Phosphorus Bay-wide nitrogen loads were similar to 2010, but phosphorus loads decreased. These loads are highly elated to river flows and stormwater runoff that
Effect of Turbidity on Dissolved Oxygen in the Lake Macatawa. Watershed
 Effect of Turbidity on Dissolved Oxygen in the Lake Macatawa Watershed Hope College GES 401 Research Project Group Members: Peter Van Heest, Rachel Burkhart, Wyatt Curry Advisor: Dr. G. Peaslee Introduction
Fig. 1. Map for location
 The Asian Journal of Biology Education (2002) Number 1 3 Faculty of Education, Shiga University 2--1 Hiratsu, Otsu, 20-0862. Japan. Introduction Lake Biwa (Fig. 1) is the largest lake in Japan and one
U.S. Geological Survey s Update on the Water Quality of Delavan Lake
 Memo to: Town of Delavan Lake Committee Date: February 2, 2013 From: Ryan Simons, Town of Delavan Lake Committee Chairman Subject: U.S. Geological Survey s Update on the Water Quality of Delavan Lake On
(k) Based on Stratification
 Based on Stratification") (k) Based on Stratification Stratified Flows When two fluids flow one over the other it is called Stratified flow. For example (i) The hot water flowing from a thermal power station, when let into a river
(k) Based on Stratification Stratified Flows When two fluids flow one over the other it is called Stratified flow. For example (i) The hot water flowing from a thermal power station, when let into a river
Michael Suplee, Ph.D. Montana Dept. of Environmental Quality. Prepared For: Flathead Lake Watershed Advisory Group Meeting June 17, 2013
 Michael Suplee, Ph.D. Montana Dept. of Environmental Quality Prepared For: Flathead Lake Watershed Advisory Group Meeting June 17, 2013 Review of events leading to the lake targets proposed in late 1990s