CERI Commodity Report Natural Gas
|
|
|
- Kathryn Stewart
- 6 years ago
- Views:
Transcription
 weekly natural gas storage report (WNGSR), a useful and closelywatched indicator of the balance between supply and demand in the Lower- states.")
1 CERI Commodity Report Natural Gas November-December 15 The Energy Information Administration s New Storage Classifications Paul Kralovic November 19, 15 was an important date for the Energy Information Administration s (EIA) weekly natural gas storage report (WNGSR), a useful and closelywatched indicator of the balance between supply and demand in the Lower- states. It was the day the EIA released its new regional storage classifications, changing from three regions to five regions, altering how the organization reports regional inventories held in underground storage facilities in the Lower- states. 1 The EIA also made changes to its historical data, recalculating storage data back to 1, reflecting the new regional allocations. Figure 1 illustrates the changes introduced in the EIA s new regional classifications for the Lower- states. Historically, the storage data was divided among three regions: West, East and Producing. The former two regions were often referred to as Consuming West and Consuming East. The new storage regions include five divisions: Pacific, Mountain, South Central, Midwest and East. Figure 1: Old Storage Regions (left) and New Storage Regions (right) Source: EIA 3 CERI Commodity Report Natural Gas Editorial Committee: Paul Kralovic, Dinara Millington, Megan Murphy, Jon Rozhon, Allan Fogwill About CERI The Canadian Energy Research Institute is an independent, not-for-profit research establishment created through a partnership of industry, academia, and government in Our mission is to provide relevant, independent, objective economic research in energy and related environmental issues. For more information about CERI, please visit our website at or contact us at info@ceri.ca. The two significant changes include breaking up the Consuming East region into the Midwest region and the East region and breaking up the Consuming West region into the Pacific region and the Mountain region. The Midwest region includes Illinois, Indiana, Iowa, Kentucky, Michigan, Minnesota, Missouri, Tennessee and Wisconsin, while the new East region now includes Connecticut, Delaware, District of Columbia, Florida, Georgia, Massachusetts, Maryland, Maine, New Hampshire, New Jersey, New York, North Carolina, Ohio, Pennsylvania, Rhode Island, South Carolina, Vermont, Virginia and West Virginia. It is interesting to note that Nebraska moves from the old East region to the Mountain region, while Minnesota moves in the other direction. New Mexico also moves into the Mountain region from the former Producing region. The original three storage regions were created by the EIA in 1993 but are now out of date. 5 Fueled by rapid technological advancements such as horizontal drilling and hydraulic fracturing, shale production has boomed in the past half dozen years, changing the dynamics of the natural gas market in the Lower-. It is important to note that the EIA has already overhauled gas production data to reflect emerging shale production and has introduced new drilling data to reflect changes in gas field development. For example, in 1993 the top 1 producing areas in the Lower- (in MMcf) were: Texas (,9,), Louisiana (,991,13), Federal Offshore Gulf of Mexico (,79,37), Oklahoma (,9,9), New Mexico (1,9,9), Kansas (,37), Wyoming (3,957), Colorado (,95), Alabama (3,) and California (315,51). 7 In 1, the top 1 producing areas in the Lower- (in MMcf) were: Texas (7,953,33), Pennsylvania (,1,3), Oklahoma (,31,11), Louisiana (1,9,7), Wyoming (1,791,35), Colorado (1,31,39), Federal Offshore Gulf of Mexico (1,55,3), New Mexico (1,1,), Arkansas (1,13,7) and West Virginia (1,,5). New to the top 1 are Pennsylvania, Arkansas and West Virginia, at the expense of Kansas, Alabama and California. All aforementioned states are bolstered by production in various shale plays. The largest producing
 9 of dry shale gas in October 15, and the fastest growing shale gas play in the US is the Utica Shale, producing 3.1 Bcfd.")
2 Page shale gas play in the US is the Marcellus Shale, producing 15.5 billion cubic feet per day (Bcfd) 9 of dry shale gas in October 15, and the fastest growing shale gas play in the US is the Utica Shale, producing 3.1 Bcfd. 1 Both are located in the Appalachian Basin and have thrust Pennsylvania, West Virginia and Ohio into large producers in the US. While Ohio is not in the top 1, its production has risen steeply from, MMcf in 9 to 51,77 MMcf in Natural gas production in Arkansas has increased from 79,95 MMcf in 9 to 1,13,7 MMcf in 1; the state is home to the Fayetteville Shale. 1 Other states that have experienced dramatic increases in shale gas production in the top 1 include Texas (Barnett Shale, Eagle Ford Shale and the west portion of the Haynesville Shale), Louisiana (the eastern portion of the Haynesville Shale) and Oklahoma (Woodford Shale). The new storage regions will lead to a better understanding of natural gas flows in the Lower- states. In addition, the new classifications better reflect the location of storage of the underground facilities in the US. 13 Figure illustrates the size and location of the three different types of underground storage facilities in the US, including depleted natural gas and oil fields, aquifers and salt domes. The former is the most common type of the storage in the US; depleted fields are relatively easy to convert into storage, they have the additional benefit of being located close to either large consuming areas or existing natural gas pipeline systems. 1 It is interesting to note that there are 1 entities that operated nearly underground storage facilities in the US. 15 Figure : US Underground Natural Gas Storage Facilities by Type (as of July 15) Regardless of the new classification system, one thing is for certain, working natural gas in storage is at record levels. As of November 13, 15, total US storage achieved a record level of, Bcf, only to be surpassed a week later by,9 Bcf. 17 This is likely due to warmerthan-normal winter weather thus far in the US, leading to lower heating demand. The previous weekly record of 3,99 Bcf was set on November, 1. 1 Endnotes 1 EIA website, Today in Energy, New classifications of natural gas storage regions will begin November 19, Released on November 1, 15, EIA website, Methodology for EIA Weekly Underground Natural Gas Storage Estimates, November 1, 15, methodology.html 3 PointLogic Energy website, The Updated EIA Natural Gas Storage Regions are Here to Stay, November 1, 15, EIA website, Notes and Definitions, 5 EIA website, Today in Energy, New classifications of natural gas storage regions will begin November 19, Released on November 1, 15, Argus Media website, EIA to roll out changes to gas storage report, November 1, 15 NewsBody.aspx?id=113753&menu=yes 7 EIA website, Natural Gas Gross Withdrawals and Production, Marketed Production, Volumes in Annual Million Cubic Feet, ibid 9 EIA website, Energy in Brief, Shale in the United States, US dry shale gas production figure data, article/shale_in_the_united_states.cfm 1 ibid 11 EIA website, Natural Gas Gross Withdrawals and Production, Marketed Production, Volumes in Annual Million Cubic Feet, ibid 13 EIA website, FAQs about New Regions for Weekly Natural Gas Storage Report, 1 EIA website, Underground Natural Gas Storage, ngpipeline/undrgrnd_storage.html 15 EIA website, The Basics of Underground Natural Gas Storage, Release Date: November 1, 15, storage/basics/ 1 EIA website, Today in Energy, New classifications of natural gas storage regions will begin November 19, Released on November 1, 15, 17 EIA website, Weekly Working Gas in Underground Storage, EIA website, Today in Energy, Working natural gas in storage matches record level, November, 15, todayinenergy/detail.cfm?id=37 Source: EIA 1
3 Page 3 Henry Hub/AECO-C Beginning of Next Month Spot Price (US$/MMBtu) Henry Hub/Chicago Beginning of Next Month Spot Price (US$/MMBtu) Differential Henry Hub AECO-C Differential Henry Hub Chicago Jan-5 Jul- Jan- Jul-9 Jan-11 Jul-1 Jan-1 Jul Jan-5 Jul- Jan- Jul-9 Jan-11 Jul-1 Jan-1 Jul-15 SOURCE: CERI, Platts Gas Daily Price Guide. SOURCE: CERI, Platts Gas Daily Price Guide. Henry Hub/Rockies Beginning of Next Month Spot Price (US$/MMBtu) Chart Title Henry Hub/Southern California Beginning of Next Month Spot Price (US$/MMBtu) 15 Differential Henry Hub Rockies Jan-5 Jul- Jan- Jul-9 Jan-11 Jul-1 Jan-1 Jul Differential Henry Hub Southern California Jan-5 Jul- Jan- Jul-9 Jan-11 Jul-1 Jan-1 Jul-15 SOURCE: CERI, Platts Gas Daily Price Guide. SOURCE: CERI, Platts Gas Daily Price Guide.

4 SOURCE: Canadian Gas Association. SOURCE: CERI, Canadian Gas Association, Statistics Canada. Page , Canadian Heating Degree Days 5-Year Avg US Heating Degree Days 5-Year Avg SOURCE: NOAA. SOURCE: CERI, NOAA, EIA. Canadian Heating Degree Days vs Residential and Commercial Consumption Degree Days BCFPD 1, 7 Degree Days Consumption 1, Jan-9 Jan-1 Jan-11 Jan-1 Jan-13 Jan-1 Jan-15 US Heating Degree Days vs Residential and Commercial Consumption Degree Days BCFPD 1, Degree Days Consumption 1, Jan-9 Jan-1 Jan-11 Jan-1 Jan-13 Jan-1 Jan-15 CERI Commodity Report - Natural Gas


5 SOURCE: NOAA. SOURCE: Environment Canada. SOURCE: NOAA. SOURCE: Environment Canada. Page 5


6 CERI Commodity Report - Natural Gas SOURCE: Environment Canada. SOURCE: NOAA. SOURCE: NOAA. Page

 1 1 Industrial Electric Power")
 1 BC, Yukon, NWT AB SK E.")
7 SOURCE: Statistics Canada. SOURCE: Statistics Canada, NEB. SOURCE: EIA. SOURCE: EIA. Page 7 Canadian Consumption By Sector (Bcfpd) 1 1 Industrial & Power Commercial Residential 1 1 Jan-9 Jan-1 Jan-11 Jan-1 Jan-13 Jan-1 Jan-15 US Consumption By Sector (Bcfpd) 1 1 Industrial Electric Power Commercial Residential 1 Jan-9 Jan-1 Jan-11 Jan-1 Jan-13 Jan-1 Jan-15 Canadian Marketable Production By Province/Region (Bcfpd) 1 BC, Yukon, NWT AB SK E. Coast Jan-9 Jan-1 Jan-11 Jan-1 Jan-13 Jan-1 Jan-15 US Marketable Production (Bcfpd) 9 US Total Louisiana GOM Federal Waters Texas Jan-9 Jan-1 Jan-11 Jan-1 Jan-13 Jan-1 Jan-15
 1.")
 13 1 15 East")

8 Page BC, Yukon, NWT Marketable Production (Bcfpd) Saskatchewan Marketable Production (Bcfpd) Alberta Marketable Production (Bcfpd) East Coast Marketable Production (Bcfpd) SOURCE: Statistics Canada, NEB. SOURCE: Statistics Canada, NEB. SOURCE: Statistics Canada, NEB. SOURCE: Statistics Canada, NEB. CERI Commodity Report - Natural Gas
 13 1 15 Canadian Gas Exports to the US By Export Point - West (Bcfpd)")
 Empress McNeill AB-BC Alliance Dec-1 Feb-15")
 Emerson Iroquois Others Niagara 5 3 1 Oct-1 Dec-1 Feb-15 Apr-15 Jun-15")

9 Page System Field Receipts TransCanada + Westcoast; Monthly Average (Bcfpd) Canadian Gas Exports to the US By Export Point - West (Bcfpd) Kingsgate Monchy Elmore Huntingdon Oct-1 Dec-1 Feb-15 Apr-15 Jun-15 Aug-15 Oct Alberta System Deliveries (Bcfpd) Empress McNeill AB-BC Alliance Dec-1 Feb-15 Apr-15 Jun-15 Aug-15 Oct-15 Dec-15 Canadian Gas Exports to the US By Export Point - East (Bcfpd) Emerson Iroquois Others Niagara Oct-1 Dec-1 Feb-15 Apr-15 Jun-15 Aug-15 Oct-15 SOURCE: CERI, TCPL, Westcoast Energy. SOURCE: NEB. SOURCE: NEB. Note: As of December 15, Alliance deliveries are no longer available. SOURCE: CERI, TCPL, Alliance Pipeline.

 1 1 Canada Mexico 1 Sep-1")
 West Midwest East Oct-1 Dec-1 Feb-15 Apr-15 Jun-15 Aug-15 Oct-15 Canadian Gas")
10 SOURCE: NEB. SOURCE: NEB. SOURCE: NEB, EIA. SOURCE: NEB. Page 1 US Imports of Canadian Gas By US Region (Bcfpd) 1 West Midwest East 1 Oct-1 Dec-1 Feb-15 Apr-15 Jun-15 Aug-15 Oct-15 Total US Pipeline Gas Imports (Bcfpd) 1 1 Canada Mexico 1 Sep-1 Nov-1 Jan-15 Mar-15 May-15 Jul-15 Sep Average Canadian Export Price By US Region (C$/GJ) West Midwest East Oct-1 Dec-1 Feb-15 Apr-15 Jun-15 Aug-15 Oct-15 Canadian Gas Imports By Import Point (Bcfpd) Courtright Sarnia St. Clair Other Oct-1 Dec-1 Feb-15 Apr-15 Jun-15 Aug-15 Oct-15 CERI Commodity Report - Natural Gas

 Volume-Weighted Average LNG Price (US$/MMBtu) Other Nigeria Trinidad Norway Qatar Yemen 1 13 1 15 1 15 1 1 1 1 5 Nov-13 Feb-1 May-1")
11 Page 11 Eastern US LNG Imports By Facility (Bcf) US GoM LNG Imports By Facility (Bcf) 1 Cove Point Elba Island Everett NE Gateway Neptune Freeport Lake Charles Sabine Pass Cameron Golden Pass Gulf LNG Nov-13 Feb-1 May-1 Aug-1 Nov-1 Feb-15 May-15 Aug-15 Nov-15 Nov-13 Feb-1 May-1 Aug-1 Nov-1 Feb-15 May-15 Aug-15 Nov-15 SOURCE: US. DOE. SOURCE: US DOE. US LNG Imports By Origin (Bcf) Volume-Weighted Average LNG Price (US$/MMBtu) Other Nigeria Trinidad Norway Qatar Yemen Nov-13 Feb-1 May-1 Aug-1 Nov-1 Feb-15 May-15 Aug-15 Nov-15 SOURCE: US DOE. Note: There were no LNG imports for the month of November 1. SOURCE: US DOE.

 US LNG")
 7 Mexico Brazil Egypt")


12 Page 1 SOURCE: US DOE, NEB. SOURCE: US DOE. Japan US LNG Exports to Japan (Bcf) US LNG Re-Exports By Destination (Bcf) 7 Mexico Brazil Egypt Nov-13 Feb-1 May-1 Aug-1 Nov-1 Feb-15 May-15 Aug-15 Nov-15 Nov-13 Feb-1 May-1 Aug-1 Nov-1 Feb-15 May-15 Aug-15 Nov-15 SOURCE: EIA, US DOE. SOURCE: US DOE. CERI Commodity Report - Natural Gas
13 Page 13 North American Active Rigs Canadian Rig Fleet Utilization Weekly Average Active Rigs 3, US WCSB,5 1, Active Rigs Total Rig Drilling Fleet 9, 1, , Jan- Jan-7 Jan- Jan-9 Jan-1 Jan-11 Jan-1 Jan-13 Jan-1 Jan-15 Jan-1 Jan- Jan-7 Jan- Jan-9 Jan-1 Jan-11 Jan-1 Jan-13 Jan-1 Jan-15 Jan-1 SOURCE: CERI, CAODC, Baker Hughes. SOURCE: CERI, CAODC. WCSB Active Rigs by Province Weekly Average Western Canada Active Rigs Weekly Average 7 SK AB BC 5-Year Avg Jan-9 Jan-1 Jan-11 Jan-1 Jan-13 Jan-1 Jan-15 Jan Week Number SOURCE: CERI, CAODC. SOURCE: CERI, CAODC.

14 Page 1 US Total Oil- and Gas-directed Active Rigs US Total Active Rigs,,, 1, 1, 1, 1, 1, Oil-directed Gas-directed Gas-directed % 1% 9% % 7% % 5% % 3% % 1% % Jan- Jan-7 Jan- Jan-9 Jan-1 Jan-11 Jan-1 Jan-13 Jan-1 Jan-15 Jan-1,5 Total Oil-directed GoM Gas-directed Onshore Gas-directed, 1,5 1, 5 Jan- Jan-7 Jan- Jan-9 Jan-1 Jan-11 Jan-1 Jan-13 Jan-1 Jan-15 Jan-1 SOURCE: CERI, Baker Hughes. SOURCE: CERI, Baker Hughes. US Gulf of Mexico Active Rigs 1 Oil-directed Gas-directed 1 Jan- Jan-7 Jan- Jan-9 Jan-1 Jan-11 Jan-1 Jan-13 Jan-1 Jan-15 Jan-1 SOURCE: CERI, Baker Hughes. CERI Commodity Report - Natural Gas


15 Page 15 1, ,5, 3,5 3,,5, 1,5 1, 5 Canadian Working Gas Storage 5-Year Avg US Lower- Working Gas Storage 5-Year Avg Canadian Storage by Region 9 West East Dec-1 Feb-15 Apr-15 Jun-15 Aug-15 Oct-15 Dec-15 US Storage by Region,5 East Midwest Mountain Pacific South Central, 3,5 3,,5, 1,5 1, 5 Dec-1 Feb-15 Apr-15 Jun-15 Aug-15 Oct-15 Dec-15 SOURCE: CERI, Platt s Gas Daily. SOURCE: CERI, Platt s Gas Daily. SOURCE: CERI, Platt s Gas Daily. SOURCE: CERI, Platt s Gas Daily.


16 Page 1 WC_IJ_WD Western Canadian Storage Injections/Withdrawals 1 5-Year Avg Canadian Storage Injections/Withdrawals 15 5-Year Avg Eastern Canadian Storage Injections/Withdrawals 5-Year Avg SOURCE: CERI, Platt s Gas Daily. SOURCE: CERI, Platt s Gas Daily. SOURCE: CERI, Platt s Gas Daily. CERI Commodity Report - Natural Gas


17 Page US East Storage Injections/Withdrawals 5-Year Avg US Mountain Region Storage Injections/Withdrawals 5-Year Avg US Midwest Region Storage Injections/Withdrawals 3 5-Year Avg US Pacific Region Storage Injections/Withdrawals 5-Year Avg SOURCE: CERI, EIA. SOURCE: CERI, EIA. SOURCE: CERI, EIA. SOURCE: CERI, EIA.


18 Page US South Central Region Storage Injections/Withdrawals 5-Year Avg US Storage Injections/Withdrawals 5-Year Avg SOURCE: CERI, EIA. SOURCE: CERI, EIA. CERI Commodity Report - Natural Gas
CERI Commodity Report Natural Gas
 September 1 CERI Commodity Report Natural Gas Natural Gas Prices Paul Kralovic The Commodity Report Natural Gas article, Turm-oil in the Natural Gas Markets, released in February 1, explored the low natural
CERI Commodity Report Natural Gas
 CERI Commodity Report Natural Gas September 15 The Marcellus Shale Paul Kralovic Advances in horizontal drilling, 3-D seismic technology and hydraulic fracturing (fracking) are opening up new shale gas
CERI Commodity Report Natural Gas
 March 15 CERI Commodity Report Natural Gas Analyzing Rig In-Activity Paul Kralovic Despite the West Texas Intermediate (WTI) oil price rebounding from a low of US$3.39 per barrel on March 17, 15 to US$55.
CERI Commodity Report Natural Gas
 July-August 1 CERI Commodity Report Natural Gas Ethane Availability for Proposed Western Canadian LNG Facilities Dinara Millington In the Canadian context, the main sources of petrochemical feedstock include
CERI Commodity Report Natural Gas
 March 1 CERI Commodity Report Natural Gas Natural Gas Storage in Ontario Paul Kralovic Underground natural gas storage facilities play a vital role in the North American natural gas transmission and distribution
CERI Commodity Report Natural Gas
 CERI Commodity Report Natural Gas June-July Why Bury Pipelines? By Thorn Walden The vast majority of energy and water pipelines are buried, generally to a depth of - metres. One notable exception is the
CERI Commodity Report Natural Gas
 bcf/d CERI Commodity Report Natural Gas October Gas-to-Liquids (GTL): An Option for Monetizing WCSB Natural Gas Current Challenges for WSCB Natural Gas Producers Shale gas production in the United States
CERI Commodity Report Natural Gas
 May 1 CERI Commodity Report Natural Gas Natural Gas Vehicles (NGVs) in Canada Paul Kralovic Jurisdictions eager to address GHG emission issues are increasingly turning their attention to the transportation
CERI Commodity Report - Natural Gas
 PAGE June The views presented in this article are those of the author, and do not necessarily reflect those of the Canadian Energy Research Institute. Deploying Natural Gas Trucks and Buses to Reduce Canada
CERI Commodity Report Natural Gas
 February 1 CERI Commodity Report Natural Gas US LNG: An Update Paul Kralovic February, 1 is an important date in the liquefied natural gas (LNG) landscape in the US, marking the beginning of a shift from
CERI Commodity Report Natural Gas
 CERI Commodity Report Natural Gas October European Shale Gas Development In April, the United States Energy Information Administration (EIA) released an initial assessment of shale gas resources outside
Winter U.S. Natural Gas Production and Supply Outlook
 Winter 2010-11 U.S. Natural Gas Production and Supply Outlook Prepared for Natural Gas Supply Association by: ICF International Fairfax, Virginia September, 2010 Introduction This report presents ICF s
Winter U.S. Natural Gas Production and Supply Outlook
 Winter 2012-13 U.S. Natural Gas Production and Supply Outlook Prepared for Natural Gas Supply Association by: ICF International Fairfax, Virginia September, 2012 Introduction This report presents ICF s
AIChE: Natural Gas Utilization Workshop Overcoming Hurdles of Technology Implementation
 AIChE: Natural Gas Utilization Workshop Overcoming Hurdles of Technology Implementation Natural Gas in the United States: An Overview of Resources and Factors Affecting the Market November 2, 216 Justin
CALCULATING THE SUPPLEMENTAL NUTRITION ASSISTANCE PROGRAM (SNAP) PROGRAM ACCESS INDEX: A STEP-BY-STEP GUIDE FOR 2013
 PROGRAM ACCESS INDEX: A STEP-BY-STEP GUIDE FOR 2013") Food and Nutrition Service January 2015 CALCULATING THE SUPPLEMENTAL NUTRITION ASSISTANCE PROGRAM (SNAP) PROGRAM ACCESS INDEX: A STEP-BY-STEP GUIDE FOR 2013 Introduction The Program Access Index (PAI)
Food and Nutrition Service January 2015 CALCULATING THE SUPPLEMENTAL NUTRITION ASSISTANCE PROGRAM (SNAP) PROGRAM ACCESS INDEX: A STEP-BY-STEP GUIDE FOR 2013 Introduction The Program Access Index (PAI)
CALCULATING THE SUPPLEMENTAL NUTRITION ASSISTANCE PROGRAM (SNAP) PROGRAM ACCESS INDEX: A STEP-BY-STEP GUIDE FOR 2015
 PROGRAM ACCESS INDEX: A STEP-BY-STEP GUIDE FOR 2015") Food and Nutrition Service January 2017 CALCULATING THE SUPPLEMENTAL NUTRITION ASSISTANCE PROGRAM (SNAP) PROGRAM ACCESS INDEX: A STEP-BY-STEP GUIDE FOR 2015 Introduction The Program Access Index (PAI)
Food and Nutrition Service January 2017 CALCULATING THE SUPPLEMENTAL NUTRITION ASSISTANCE PROGRAM (SNAP) PROGRAM ACCESS INDEX: A STEP-BY-STEP GUIDE FOR 2015 Introduction The Program Access Index (PAI)
Natural Gas Issues and Emerging Trends for the Upcoming Winter and Beyond
 Natural Gas Issues and Emerging Trends for the Upcoming Winter and Beyond 2013 NASEO WINTER ENERGY OUTLOOK CONFERENCE November 1, 2013 Kevin Petak Vice President, ICF International Kevin.Petak@icfi.com
Milk Production. January Milk Production up 2.7 Percent
 Milk Production ISSN: 9-557 Released February, 07, by the National Agricultural Statistics Service (NASS), Agricultural Statistics Board, United States Department of Agriculture (USDA). January Milk Production
Accelerating Energy Efficiency in Texas
 Accelerating Energy Efficiency in Texas Southwest Partnership for Energy Efficiency As a Resource Houston, Texas August 5, 2014 Jim Lazar RAP Senior Advisor The Regulatory Assistance Project 50 State Street,
Production per cow in the 23 major States averaged 1,891 pounds for January, 17 pounds above January 2013.
 Milk Production ISSN: 19-1557 Released February 20, 2014, by the National Agricultural Statistics Service (NASS), Agricultural Statistics Board, United States Department of Agriculture (USDA). January
Watershed Condition Framework
 US Forest Service - Watershed Condition Classification Maps http://www.fs.fed.us/publications/watershed/ Page 1 of 2 1/9/2013 Watershed Condition Framework The Forest Service has released the first national
The Energy Consortium Recent Developments and the Outlook for Natural Gas in the Northeast. John R. Bitler October 20, 2010
 The Energy Consortium Recent Developments and the Outlook for Natural Gas in the Northeast John R. Bitler October 20, 2010 Northeast Overview Traditional Sources of Supply Gulf Coast Western Canada (WCSB)
ANNEX E: Methodology for Estimating CH 4 Emissions from Coal Mining
 1 1 1 1 1 1 1 1 0 1 0 1 ANNEX E: Methodology for Estimating CH Emissions from Coal Mining The methodology for estimating methane emissions from coal mining consists of two distinct steps. The first step
Natural Gas Abundance: The Development of Shale Resource in North America
 Natural Gas Abundance: The Development of Shale Resource in North America EBA Brown Bag Luncheon Bracewell & Giuliani Washington, D.C. February 6, 2013 Bruce B. Henning Vice President, Energy Regulatory
Milk Production. January Milk Production up 1.8 Percent
 Milk Production ISSN: 9-557 Released February, 08, by the National Agricultural Statistics Service (NASS), Agricultural Statistics Board, United States Department of Agriculture (USDA). January Milk Production
HOW BIG IS AFRICA? Rules. recommended grades: 3-6
 AFRICA HOW BIG IS AFRICA? recommended grades: 3-6 time needed: 25 MINUTES Description Students develop a sense of scale by using their bodies and other tools to measure the length and width of Africa.
https://aba2.issi.net/team/admin/wizard/survey/loadinstance.asp?formid=208&instanc...
 https://aba2.issi.net/team/admin/wizard/survey/loadinstance.asp?formid=208&instanc... Page 1 of 1 Print Last edited by Vicki Osman on Mar 28 2016 8:54AM Marketplace 2017 Associate Profile Page 1/1 Please
U.S. Historical and Projected Shale Gas Production
 U.S. Historical and Projected Shale Gas Production Phyllis Martin Phyllis Martin, Senior Energy Analyst Office of Petroleum, Gas and Biofuels Analysis U.S. Energy Information Administration phyllis.martin@eia.doe.gov
2012 Distribution Best Practices Benchmarking Company Profile Data Packet
 American Gas Association January 2012 Company Name: DOT Operating ID(s): Person Completing Form: Phone Number: Email Address: Required Fields Deadline for data submittal in BESS, http://www.aga.org/research/bess/
ENERGY STAR Oil Furnaces Product List
 ENERGY STAR Oil Furnaces Product List Below are currently qualified ENERGY STAR models available for sale in the U.S. and Canada * Air Leakage data was not collected under the Version 3.0 ENERGY STAR Program
Atlantic LNG: Has the boat sailed? Is the US out of the LNG trade and what are the implications for Europe?
 Atlantic LNG: Has the boat sailed? Is the US out of the LNG trade and what are the implications for Europe? James Osten Principal North American Energy Markets LNG Trade Different for U.S. Than Europe
Ponzi Scheme Keeps US Market Well Supplied
 www.poten.com June 30, 2011 Ponzi Scheme Keeps US Market Well Supplied Conjuring up images of the dot-com bubble of the late-1990s, the industry leveled charges of unprofessional journalism against a story
Major Changes in Natural Gas Transportation Capacity,
 Major Changes in Natural Gas Transportation, The following presentation was prepared to illustrate graphically the areas of major growth on the national natural gas pipeline transmission network between
The Oklahoma First Energy Plan: A Pragmatic Path Forward
 Office of the Oklahoma Secretary of Energy The Oklahoma First Energy Plan: A Pragmatic Path Forward C. Michael Ming Secretary of Energy State of Oklahoma Southern States Energy Board Washington, DC February
North American Natural Gas Market Outlook
 North American Natural Gas Market Outlook Energy Trends & Impacts On Gas Infrastructure Prepared For: Gas/Electric Partnership, Conference XVIII Darryl Rogers February 10, 2010 Agenda Introduction to Purvin
Data and Analysis from EIA to Inform Policymakers, Industry, and the Public Regarding Power Sector Trends
 Data and Analysis from EIA to Inform Policymakers, Industry, and the Public Regarding Power Sector Trends for Power Sector Trends in the Eastern Interconnection Atlanta, GA by Howard Gruenspecht, Deputy
AAPL 2011 Texas Land institute September 13, Christopher B. McGill Managing Director, Policy Analysis
 AAPL 2011 Texas Land institute September 13, 2011 Christopher B. McGill Managing Director, Policy Analysis 0 Natural Gas Production Monthly 1998 2010 1 2011 Daily Dry Natural Gas Production (after extraction
Benchmarking Standards, Model Codes, Codes and Voluntary Guidelines on the HERS Index
 Benchmarking Standards, Model Codes, Codes and Voluntary Guidelines on the HERS Index Importance of Benchmarking Quantifying energy efficiency programs and codes helps: Consumers understand the performance
North American Gas: A dynamic environment. Josh McCall BP North American Gas and Power November 16, 2011
 North American Gas: A dynamic environment Josh McCall BP North American Gas and Power November 16, 2011 Disclaimer Copyright BP Energy Company. All rights reserved. Contents of this presentation do not
U.S. Drought Monitor, August 28, 2012
 University of Nebraska - Lincoln DigitalCommons@University of Nebraska - Lincoln US Ag in Drought Archive Drought -- National Drought Mitigation Center 8-28-2 U.S. Drought Monitor, August 28, 2 Brian Fuchs
U.S. Drought Monitor, September 4, 2012
 University of Nebraska - Lincoln DigitalCommons@University of Nebraska - Lincoln US Ag in Drought Archive Drought -- National Drought Mitigation Center 9--12 U.S. Drought Monitor, September, 12 Brian Fuchs
Trends in. U.S. Delivered Coal Costs: July 2012
 Trends in U.S. Delivered Coal Costs: 2004-2011 July 2012 By Teresa Foster, William Briggs and Leslie Glustrom Version 1.1 Inquiries or corrections to info@cleanenergyaction.org 1 2 Table of Contents INTRODUCTION...
U.S. Drought Monitor, July 31, 2012
 University of Nebraska - Lincoln DigitalCommons@University of Nebraska - Lincoln US Ag in Drought Archive Drought -- National Drought Mitigation Center -3-2 U.S. Drought Monitor, July 3, 2 Mark D. Svoboda
Do you have staff reviewing formation filings for name availability purposes or is this done electronically?
 Topic: Developing an Online Filing System Question by: Allison Clark Jurisdiction: Ohio Date: 2 February 2011 Jurisdiction Question(s) Manitoba Corporations Canada Alabama Alaska Arizona Arkansas California
U.S. Drought Monitor, October 2, 2012
 University of Nebraska - Lincoln DigitalCommons@University of Nebraska - Lincoln US Ag in Drought Archive Drought -- National Drought Mitigation Center -2-12 U.S. Drought Monitor, October 2, 12 Anthony
PRICING POLLUTION. A Progressive Proposal for Combating Climate Change
 PRICING POLLUTION A Progressive Proposal for Combating Climate Change WHY The National Security Strategy, issued in February 2015, is clear that climate change is an urgent and growing threat to our
ENERGY OUTLOOK 2017 FALL/WINTER
 ENERGY OUTLOOK 2017 FALL/WINTER With more than 105 years in the energy industry, BOK Financial is committed to helping you succeed. In this issue of the Energy Outlook, you ll learn more about the current
Oil and gas outlook. For New York Energy Forum October 15, 2015 New York, NY. By Adam Sieminski, Administrator. U.S. Energy Information Administration
 Oil and gas outlook For New York Energy Forum New York, NY By Adam Sieminski, Administrator U.S. Energy Information Administration U.S. Energy Information Administration Independent Statistics & Analysis
Shale Gas - Transforming Natural Gas Flows and Opportunities. Doug Bloom President, Spectra Energy Transmission West October 18, 2011
 Fort Nelson Gas Plant, British Columbia Shale Gas - Transforming Natural Gas Flows and Opportunities Doug Bloom President, Spectra Energy Transmission West October 18, 2011 Natural Gas Golden Age Natural
American Rabbit Breeders Association, Inc 2017 MEDIA KIT
 American Rabbit Breeders Association, Inc 2017 MEDIA KIT Domestic Rabbits Official Publication of the ARBA The American Rabbits Breeders Association has been dedicated to the promotion, development, and
Industrial Energy Efficiency as a Resource by Region
 Industrial Energy Efficiency as a Resource by Region Garrett Shields and Robert D. Naranjo, BCS Incorporated Sandy Glatt, U.S. Department of Energy ABSTRACT The energy intensity of specific manufacturing
Greg Hathaway Energy Source Holdings, LLC
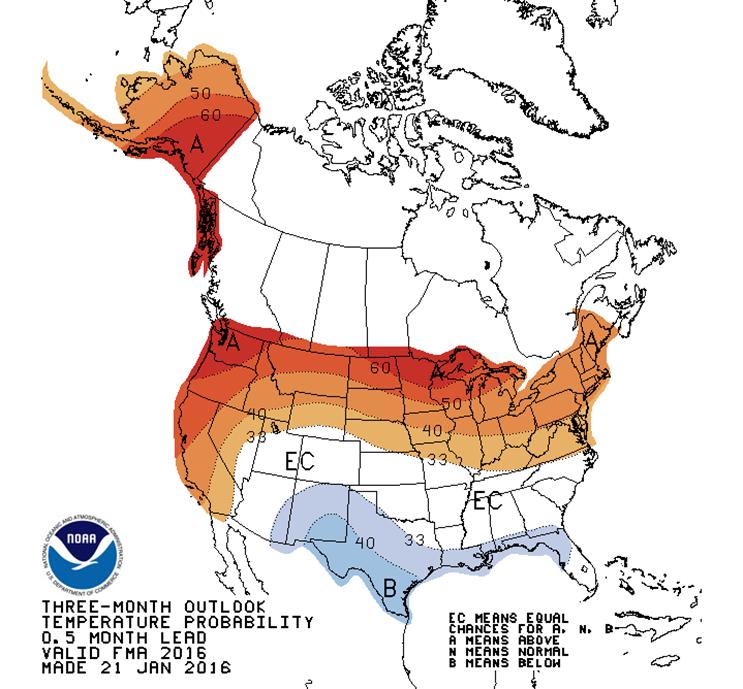
 Greg Hathaway Energy Source Holdings, LLC WEATHER THE PICTURE TO THE RIGHT SHOWS THE 2015-16 WINTER HAS BEEN MUCH ABOVE NORMAL. SINCE 2008 THE NATIONAL TEMPERATURE HAS BEEN BELOW NORMAL SIX TIMES 2013-14
Updated State-level Greenhouse Gas Emission Coefficients for Electricity Generation
 Updated State-level Greenhouse Gas Emission Coefficients for Electricity Generation 1998-2000 Energy Information Administration Office of Integrated Analysis and Forecasting Energy Information Administration
ONTARIO ENERGY REPORT Q1 2015
 ONTARIO ENERGY REPORT Q1 JAN MAR OIL AND NATURAL GAS Regular Gasoline and Diesel Provincial Retail Prices ($/L) Natural Gas Effective Prices ( /m 3 ) Regular Gasoline $0.99 Diesel $1.14 Source: Ministry
Background, Issues, and Trends in Underground Hydrocarbon Storage
 Background, Issues, and Trends in Underground Hydrocarbon Storage David E. Dismukes Center for Energy Studies Louisiana State University Environmental Permitting Class January 29, 2009 Description of the
International Ag issues Trends in the Local Food Market Presentation For The NSAC Far West Chapter Annual Meeting May 23, 2013
 International Ag issues Trends in the Local Food Market Presentation For The NSAC Far West Chapter Annual Meeting May 23, 2013 William Matthews University of California Agricultural Issues Center UC Agricultural
SOYBEANS: LARGE SUPPLIES CONFIRMED, BUT WHAT ABOUT 2005 PRODUCTION?
 SOYBEANS: LARGE SUPPLIES CONFIRMED, BUT WHAT ABOUT 2005 PRODUCTION? JANUARY 2005 Darrel Good 2005 NO. 2 Summary USDA s January reports confirmed a record large 2004 U.S. crop, prospects for large year-ending
Labor Market Outlook. Labor Market Outlook Survey Q (October December) Published by the Society for Human Resource Management
 Published by the Society for Human Resource Management") October December 2009 Labor Market Outlook Published by the Society for Human Resource Management Labor Market Outlook Survey Q4 2009 (October December) LABOR MARKET OUTLOOK SURVEY Q4 2009 (October December)
October December 2009 Labor Market Outlook Published by the Society for Human Resource Management Labor Market Outlook Survey Q4 2009 (October December) LABOR MARKET OUTLOOK SURVEY Q4 2009 (October December)
ENERGY SLIDESHOW. Federal Reserve Bank of Dallas
 ENERGY SLIDESHOW Updated: February 14, 2018 ENERGY PRICES www.dallasfed.org/research/energy Brent & WTI & Crude Brent Oil Crude Oil Dollars per barrel 140 Brent (Feb 9 = $65.50) WTI (Feb 9 = $62.01) 120
ENERGY SLIDESHOW. Federal Reserve Bank of Dallas
 ENERGY SLIDESHOW Updated: July 5, 2018 ENERGY PRICES www.dallasfed.org/research/energy Brent & WTI & Crude Brent Oil Crude Oil Dollars per barrel 140 120 Brent (Jun 29 = $75.24) WTI (Jun 29 = $74.03) 95%
Intermodal Fuel Surcharge An Intermodal Fuel Charge will be assessed per container/trailer on all inland rates 'Door' location rates.
 Crowley Liner Date Filed: Date Effective: Rule 14 Revision: Org 023286 8/22/2018 8/29/2018 Intermodal Fuel Surcharge Publishing Code: A 1 Tariff 002 Intermodal Fuel Surcharge An Intermodal Fuel Charge
Meat Animals Production, Disposition, and Income 2011 Summary
 United States Department of Agriculture National Agricultural Statistics Service Meat Animals Production, Disposition, and Income 2011 Summary April 2012 ISSN: 0748-0318 Special Note Sheep: Monthly sheep
U.S. Drought Monitor, August 14, 2012
 University of Nebraska - Lincoln DigitalCommons@University of Nebraska - Lincoln US Ag in Drought Archive Drought -- National Drought Mitigation Center 8-4-2 U.S. Drought Monitor, August 4, 2 Michael J.
Milk Production, Disposition, and Income 2014 Summary
 United s Department of Agriculture National Agricultural Statistics Service Milk Production, Disposition, and Income 04 Summary ISSN: 949-506 April 05 Contents Summary... 4 Milk Cows and Production of
Natural Gas Market Update
 Natural Gas Market Update John Jicha - MGE Director - Energy Supply and Trading Madison Gas and Electric Company Agenda What a difference ten years can make Low prices Fundamental factors impacting the
Aftermath of Harvey and Irma: Oil Industry Perspective. Southern States Energy Board Charleston, SC September 24, 2017
 Aftermath of Harvey and Irma: Oil Industry Perspective Southern States Energy Board Charleston, SC September 24, 2017 API plays two primary roles for the industry in preparing for hurricanes. First, API
General Manager: Front Desk Manager: Front Desk/Shift Supervisor: Housekeeping or Environmental Services Manager: Housekeeping Supervisor/Inspector:
 1 Report Summary WageWatch, Inc. has partnered with AAHOA to provide its members with a Hospitality Salary Survey Report for limited/select service hotels twice a year. This is the first report and is
U.S. Natural Gas and the Potential for LNG Export Growth
 U.S. Natural Gas and the Potential for LNG Export Growth Presentation to: 2018 Wyoming Oil & Gas Fair By: John Harpole September 12, 2018 It is not a scarce resource anymore 2 US RIG COUNTS: Aug 2018
The Denver Water System
 The Denver Water System Established in 1918 Unique structure Serves 1.3 million people 25% of Colorado s population System footprint - 4,000 square miles (2.5 million acres) 19 raw water reservoirs Critical
U.S. Drought Monitor, August 7, 2012
 University of Nebraska - Lincoln DigitalCommons@University of Nebraska - Lincoln US Ag in Drought Archive Drought -- National Drought Mitigation Center -- U.S. Drought Monitor, August, Mark D. Svoboda
Trends, Issues and Market Changes for Crude Oil and Natural Gas
 Trends, Issues and Market Changes for Crude Oil and Natural Gas East Iberville Community Advisory Panel Meeting Syngenta September 26, 2012 Center for Energy Studies David E. Dismukes, Ph.D. Center for
Energy and Regional Economics
 Energy and Regional Economics Michael Carliner International instability and possible war affect the overall US economy, and economic conditions in different regions, in a variety of ways. Changes in energy
SOYBEANS: HIGHEST PRICES IN OVER SEVEN YEARS. January 2004 Darrel Good 2004 NO. 2
 SOYBEANS: HIGHEST PRICES IN OVER SEVEN YEARS January 2004 Darrel Good 2004 NO. 2 Summary At 2.418 billion bushels, the 2003 U.S. soybean crop was 34 million bushels smaller than the USDA s November forecast
Survey of Mineral Admixtures and Blended Cements in Ready Mixed Concrete
 Survey of Mineral Admixtures and Blended Cements in Ready Mixed Concrete A survey of concrete producers to quantify the use of cement, admixtures and blended cements in ready mixed concrete. October 2000
U.S. Shale Gas in Context
 U.S. Shale Gas in Context Overview of U.S. Natural Gas production and trends For National Conference of State Legislatures Natural Gas Policy Institute September 9, 215 Pittsburgh, Pennsylvania By Grant
Milk Production, Disposition, and Income 2011 Summary
 United s Department of Agriculture National Agricultural Statistics Service Production, Disposition, and Income 2011 Summary April 2012 ISSN: 19491506 Contents Summary... 4 Cows and Production of and
Asphalt Pavement Mix Production Survey On Reclaimed Asphalt Pavement, Reclaimed Asphalt Shingles, And Warm-mix Asphalt Usage:
 Asphalt Pavement Mix Production Survey On Reclaimed Asphalt Pavement, Reclaimed Asphalt Shingles, And Warm-mix Asphalt Usage: 2009-2010 Appendix A Purpose The National Asphalt Pavement Association is working
STATE OF MICHIGAN BEFORE THE MICHIGAN PUBLIC SERVICE COMMISSION
 STATE OF MICHIGAN BEFORE THE MICHIGAN PUBLIC SERVICE COMMISSION In the matter of the Application of ) DTE ELECTRIC COMPANY for ) approval of Certificates of Necessity ) pursuant to MCL 460.6s, as amended,
January 30, 2010 National Conference of State Legislatures Savannah, Georgia. Christopher B. McGill Managing Director, Policy Analysis
 January 30, 2010 National Conference of State Legislatures Savannah, Georgia Christopher B. McGill Managing Director, Policy Analysis U.S. Natural Gas Supply and Infrastructure Additions Points of Discussion
Knowledge Exchange Report
 Knowledge Exchange Report February 2016 The Economic Impact of a Minimum Wage Increase on New York State Agriculture New York State is considering a minimum wage increase from $9.00 to $15.00 statewide.
U.S. Natural Gas and the Poten3al for LNG Export Growth
 U.S. Natural Gas and the Poten3al for LNG Export Growth Presentation to: 2018 Wyoming Oil & Gas Fair By: John Harpole September 12, 2018 It is not a scarce resource anymore 2 US RIG COUNTS: Aug 2018 vs
Oil. Gas. Market Notes. North American Natural Gas Market Outlook Year-End 2014: A View to Contents
 Oil Gas Market Notes Contents 1 North American Natural Gas Market Outlook Year-End 214: A View to 235 9 Natural Gas Market Charts 12 Oil Market Charts 16 Legislative and Regulatory Highlights 17 About
North American Gas Supply Outlook
 Hart Energy s Commercializing Methane Hydrates Conference Houston, Texas December 5, 2006 North American Gas Supply Outlook Richard M. Tucker Vice President Ziff Energy Group Houston Calgary www.ziffenergy.com
Oil. Gas. Market Notes. Marcellus Supplies Strike Again. Contents
 Oil Gas Market Notes Contents 1 Marcellus Supplies Strike Again Recent Trends in Northeast Gas Displacement 12 Natural Gas Market Charts 15 Oil Market Charts 19 Legislative and Regulatory Highlights 2
The Really Big Game Changer: Crude Oil Production from Shale Resources and the Tuscaloosa Marine Shale
 The Really Big Game Changer: Crude Oil Production from Shale Resources and the Tuscaloosa Marine Shale Baton Rouge Chamber of Commerce Regional Stakeholders Breakfast June 27, 2012 Center for Energy Studies
EIA Short-Term Energy and Winter Fuels Outlook
 EIA Short-Term Energy and Winter Fuels Outlook NASEO 2015 Winter Energy Outlook Conference Washington, DC by Howard Gruenspecht, Deputy Administrator U.S. Energy Information Administration Independent
Facts on Direct-to-Consumer Food Marketing
 United States Department of Agriculture Agricultural Marketing Service May 2009 Facts on Direct-to-Consumer Food Marketing Incorporating Data from the 2007 Census of Agriculture Written by: Adam Diamond
Energy Market Outlook
 Kyle Cooper, (713) 248-3009, Kyle.Cooper@iafadvisors.com Week Ending December 28, 2018 Please contact me to review a joint RBN Energy daily publication detailing natural gas fundamentals. Price Action:
Natural Gas Outlook and Drivers
 Natural Gas Outlook and Drivers November 2012 33% BENTEK Energy 5% 40% Who We Are Based in Evergreen, CO 120 People 400+ Customers Subsidiary of McGraw-Hill/Platts 22% What We Do Collect, Analyze and Distribute
LNG Facts A Primer. Presentation before US Department of Energy, Office of Fossil Energy, LNG Forums. March 10, Kristi A. R.
 LNG Facts A Primer Presentation before US Department of Energy, Office of Fossil Energy, LNG Forums March 10, 2006 Kristi A. R. Darby Center for Louisiana State University Overview What is Natural Gas?
ONTARIO ENERGY REPORT Q2 2018
 ONTARIO ENERGY REPORT Q APRIL JUNE OIL AND NATURAL GAS Regular Gasoline and Diesel Provincial Retail Prices ($/L) Regular Gasoline $1.3 Diesel $1.7 Source: Ministry of Energy, Northern Development and
Meat Animals Production, Disposition, and Income 2015 Summary
 United States Department of Agriculture National Agricultural Statistics Service Meat Animals Production, Disposition, and Income 2015 Summary ISSN: 0748-0318 April 2016 Contents Summary... 5 Meat Animals
The next big reliability challenge: EPA revised ozone standard
 The next big reliability challenge: EPA revised ozone standard Eugene M. Trisko Attorney-at-Law SSEB Clean Coal Technology Committee Kingsport, TN May 19, 2015 Background EPA is proposing to lower the
ONTARIO ENERGY REPORT Q1 2018
 ONTARIO ENERGY REPORT Q1 018 JANUARY MARCH 018 OIL AND NATURAL GAS Regular Gasoline and Diesel Provincial Retail Prices ($/L) Regular Gasoline $1.3 Diesel $1.3 Source: Ministry of Energy Fuel Prices Natural
Crops Marketing and Management Update
 Crops Marketing and Management Update Grains and Forage Center of Excellence Dr. Todd D. Davis Assistant Extension Professor Department of Agricultural Economics Vol. 2019 (2) February 27, 2019 Topics
Global energy markets
 For Woodrow Wilson Center Global Energy Forum September 21, 215 Washington, DC by Adam Sieminski, Administrator U.S. Energy Information Administration U.S. Energy Information Administration Independent
CenterPoint Energy Services. Current Market Fundamentals June 27, 2013
 CenterPoint Energy Services Current Market Fundamentals June 27, 2013 CenterPoint Energy is one of the largest combined electric and natural gas delivery companies in the U.S. Asset portfolio CNP Footprint
Natural Gas Next 2017: Natural Gas Storage
 Natural Gas Next 2017: Natural Gas Storage Callie Kolbe Manager, Energy Analysis September 26, 2017 Natural Gas Storage Introduction to Storage Why it is the market s balancer Where it exists and who owns
Major Challenges for Gas: What Can be Expected for Mexico?
 Major Challenges for Gas: What Can be Expected for Mexico? Gas Future Forum, Mexico, April 3, 2014 BEG/CEE UT, 1 Overall Observations Resources Reserves Deliverability Deliverability is key Sweet spot
Energy Market Outlook
 Kyle Cooper, (713) 248-3009, Kyle.Cooper@iafadvisors.com Week Ending March 22, 2019 Please contact me to review a joint RBN Energy daily publication detailing natural gas fundamentals. Price Action: The