What s Happening in Lake Whatcom?
|
|
|
- Garey White
- 6 years ago
- Views:
Transcription
1 What s Happening in Lake Whatcom? Dr. Robin A. Matthews, Director Institute for Watershed Studies Huxley College of the Environment Western Washington University June 6, 2011
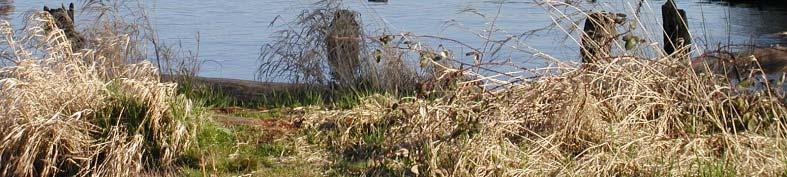
2 Site 2 Basin 2 Lake Whatcom is comprised of 2 small, shallow basins and one large, deep basin Each shallow basin is only ~20 m (60 ft) deep and contains about 2% of the total water in the lake Site 1 Basin 1 Bloedel/ Donovan Park photo provided by Margaret E. Landis
3 Sudden Valley Site 3 Basin 3 (north end) Site Ste4 Basin 3 (south end) Basin 3 is over 100 m (300 ft) deep and contains 96% of the total water in the lake All of the major tributaries to the lake flow into basin 3, including water diverted from the Middle Fork of the Nooksack River photo provided by Margaret E. Landis
4 Lake Whatcom Monitoring Objectives Conduct long-term lake and stream monitoring emphasis on lake monitoring Collect lake and stream hydrologic data annual water balance model annual hydrographs for Austin and Smith Creeks other tributaries monitored by USGS Evaluate effectiveness of storm water treatment systems in watershed objectives changed in 2010 to focus on Silver Beach Creek and Northshore


5 Long-Term Lake Monitoring
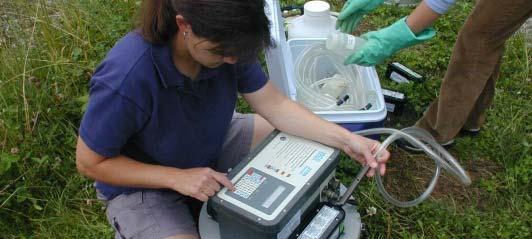
6 Lake Sampling (Annual report available at http// Monthly samples: conductivity alkalinity nutrients dissolved oxygen turbidity (TN, NH 3, NO 3, TP, SRP) ph Secchi depth chlorophyll temperature plankton bacteria (coliforms) new: algae counts at gatehouse, Intake-10 m, Site 2-10 m Annual/biannual samples: total metals (As, Cd, Cr, Co, Fe, Pb, Hg, Ni, Zn) total organic carbon hydrogen sulfide (summer)
7 Dissolved Oxygen as an Indicator The primary source of dissolved oxygen in lakes is the atmosphere Algae produce oxygen during photosynthesis (daytime), but consume oxygen at night When the lake stratifies, epilimnetic oxygen levels remain high because of contact with the atmosphere The hypolimnion is isolated from the atmosphere during stratification, so no additional oxygen is introduced until late fall when the lake cools enough to destratify
8 Winter Water Quality in Lake Whatcom Lake is cold and unstratified; water column mixes from surface to bottom even basin 3 (100 m) Temperature is nearly uniform from surface to bottom Dissolved oxygen and most other compounds are nearly uniform from surface to bottom 0 De epth from su urface (m) Site 1 - December Temperature (C) Oxygen (mg/l)
9 Summer Water Quality in Lake Whatcom Lake becomes stratified into a warm surface layer (epilimnion) and cold bottom layer (hypolimnion) Once stratified, wind can t mix the entire water column 0 De epth from su urface (m) Site 1 - July 2009 epilimnion (metalimnion) In parts of the lake (Sites 1-2), oxygen is depleted in the hypolimnion hypolimnion as bacteria decompose organic matter (dead algae, leaf fragments, etc.) Temperature (C) Oxygen (mg/l) 20
 10 5 20 15 Oxygen")


10 0 Site 1, Oct 2009 Depth (m) Oxygen Temperature Site 4, Oct km 1 mile Basins 1 and 2 have different oxygen profiles than basin 3 De epth (m) Oxygen Temperature
11 At Sites 1-2, Site 1 - May 2009 hypolimnetic oxygen May depletion begins June when the lake stratifies, and progresses rapidly until there is no more oxygen available in the lower part of the water column This process may start as early as April, but more often begins in May or early June, depending on weather conditions Depth from surface (m) July Aug Sept Oxygen (mg/l)
12 By June 2009, a distinct oxygen profile had developed The bulge between 5-10 meters is a metalimnetic oxygen maximum caused by layers of rapidly photosynthesizing algae The oxygen bulge is present during the day; at night, there may be an oxygen sag from algae respiration Depth from surface (m) May June July Aug Sept Site 1 - May-June 2009 metalimnion oxygen maximum caused by algae Oxygen (mg/l)
13 As the summer progresses, the oxygen depletion in the hypolimnion becomes increasingly evident Oxygen levels fall slightly at the surface because the water is warmer warm water holds less dissolved oxygen than cold water Depth from surface (m) May June July Aug Sept Site 1 - May-July Oxygen (mg/l)
14 By August 2009, there was almost no oxygen in the hypolimnion Once oxygen levels fall below ~2 mg/l, the only aquatic organisms that can thrive are anaerobic bacteria... other species either leave the region (e.g., fish) or go into a resting stage to wait until the lake mixes in the fall Depth from surface (m) May June July Aug Sept Site 1 - May-August 2009 metalimnion oxygen maximum caused by algae Oxygen (mg/l)
15 By September 2009, oxygen levels were near zero throughout the hypolimnion at Site 1 (and Site 2) Oxygen levels occasionally fall below 4 mg/l at Site 3 (north end of basin 3), but are usually >6-8 mg/l at Site 4 (south end of basin 3) Depth from surface (m) May June July Aug Sept Site 1 - May-September 2009 When the lake mixes in the fall, the oxygen levels will be restored Oxygen (mg/l)
 en (mg/l) lved Oxyge Dissol 4 0 1990 1995 2000 2005 2010 The rate of hypolimnetic oxygen loss")
16 Dissolved Oxygen at 12 meters, July (p-value 0.01) Aug (p-value 0.001) en (mg/l) lved Oxyge Dissol The rate of hypolimnetic oxygen loss has increased at Site 1.
17 Reasons for Declining Oxygen Levels Low oxygen in hypolimnion is caused by bacteria in hypolimnion decomposing organic matter (dead algae, leaf fragments, etc.) Algal growth in the lake is primarily controlled by phosphorus availability If more phosphorus is available, more algae will grow Lake receives internal and external phosphorus loading If more algae grow in the lake, there will be more organic matter in the lake (from dead algae) If more organic matter is present in the lake, bacteria in the If more organic matter is present in the lake, bacteria in the hypolimnion will use oxygen faster
18 TMDL Report Lake Whatcom was listed on the D list due to declining oxygen levels To address the oxygen decline, we need to reduce algal growth by reducing phosphorus Surface runoff in residential areas still contains high concentrations of phosphorus (external P loading) Low hypolimnetic oxygen levels continue to allow phosphorus to move from lake sediments into the overlying water (internal P loading) Ecology s TMDL Report (November 2009; No ) proposes a significant reduction in phosphorus entering the lake Controlling external loading will also reduce internal loading by reducing the amount of organic matter in the lake, thus slowing the rate of hypolimnetic oxygen loss
19 Other Water Quality Trends The long-term water quality data show that the lake s trophic level has changed Phosphorus concentrations have increased, but water column phosphorus levels are not the best indicator of lake trophic state Algal densities and chlorophyll levels have increased throughout the lake Carlson s Trophic State Index is increasing throughout the lake (TSI = 9.81 * log 10 chl ) Unproductive Lakes (Oligotrophic) Moderately Productive Lakes (Mesotrophic) Productive Lakes (Eutrophic) TSI chl <30 TSI chl = TSI chl >50
20 Trophic Index Based on Summer Median Chlorophyll Concentrations TSI = 9.81 * log 10 chl
21 Median summer near- surface chlorophyll levels have increased throughout the lake, especially in basin 3 hlorophyll (ug g/l) C
22 Increasing THMs in Bellingham s Treated Drinking Water TTHMS (Jan-Dec) TTHMS (Qtr 3, July-Sept) TTHMs (mg/l) TTHMs (mg/l) /91 05/97 11/02 05/08 11/91 05/97 11/02 05/08


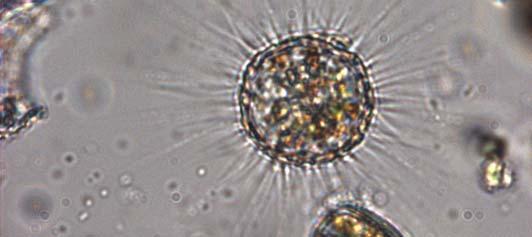
23 In 2009, summer algal blooms caused water filtration to slow to the extent that the City imposed mandatory limits on water use Cyanobacteria 1 appeared to be the major cause of slow filtration IWS is conducting monthly algae counts in basin 2 (Site 2 and the Intake) and raw water gatehouse 1 diatoms may also be involved in the filtration problem
24 Aphanothece Snowella (another bluegreen) Aphanocapsa Aphanothece 20 µm
25 Aphanocapsa/Aphanothece Counts, Dec 2009 Oct 2010) Gatehouse ls/l) 8 Intake (10 m) Site 2 (10 m) UFRVs <3000 gal/ft 2 Aphanocap psa/aphano othece (cell 7 6 Log /09 4/10 7/10 10/10
26 6000 Regression of water production rates as a function of Aphanocapsa/Aphanothece counts at the Intake (10 m) 3000 UFRVs (g gal/ft 2 ) Adj r 2 = Log 10 Aphanocapsa/Aphanothece Cells/L
27 Where are we now? Lake Whatcom has changed to a higher trophic state Hypolimnetic oxygen levels declined at Site 1 Phosphorus levels increased throughout the lake Chlorophyll concentrations and algal counts increased throughout the lake High concentrations of phosphorus enter the lake via surface runoff or are released from sediments in low oxygen portions of the hypolimnion The City is experiencing water filtration problems due to algal l blooms
28 Summer 2011 (June-November) IWS will collaborate with the City to help evaluate effectiveness of water filtration treatment options Gatehouse continuous: cyanobacteria fluorescence water filtration rates (from City) DAF* operation (from City) (*dissolved air floatation - used to remove algae) 3x weekly: algae identification/counts and water quality Intake Site 2x monthly: vertical profiles to measure algae and water quality to see if the algae are uniform or stratified in the water column
29 Thanks! Mike Hilles Joan Vandersypen Marilyn Desmul Dr. Robert Mitchell Dr. Geoffrey Matthews and the undergraduate and graduate students working on the Lake Whatcom Project
Lake Whatcom Water Quality - Presentation to Bellingham City Council
 Western Washington University Western CEDAR Lake Whatcom Other Reports Lake Whatcom 7-6-2015 Lake Whatcom Water Quality - Presentation to Bellingham City Council Robin A. Matthews Western Washington University,
Lake Whatcom Monitoring Project 2010/2011 Report
 Western Washington University Western CEDAR Lake Whatcom Annual Reports Lake Whatcom 2-24-2012 Lake Whatcom Monitoring Project 2010/2011 Report Robin A. Matthews Western Washington University, robin.matthews@wwu.edu
Interpreting Lake Data
 Interpreting Lake Data Indiana Clean Lakes Program The Indiana Clean Lakes Program was created in 1989 as a program within the Indiana Department of Environmental Management's (IDEM) Office of Water Management.
Interpreting Lake Data
 Interpreting Lake Data Indiana Clean Lakes Program The Indiana Clean Lakes Program was created in 1989 as a program within the Indiana Department of Environmental Management's (IDEM) Office of Water Management.
Phosphorus Goal Setting Process Questions and Answers 2010
 Lake Winnipesaukee Watershed Management Plan Phase I: Meredith, Paugus, Saunders Bays 1. What is phosphorus? Phosphorus (P) is a naturally occurring element and a major nutrient required for biological
2016 Summit Lake Water Quality Report Prepared by Thurston County Environmental Health Division
 ! 216 Summit Lake Water Quality Report Prepared by Thurston County Environmental Health Division PART OF TOTTEN INLET WATERSHED LENGTH OF LAKE: 2.2 miles SHORELINE LENGTH: 5.6 miles LAKE SIZE: 53 acres
Lake Washington. Water Quality Assessment Report. Copyright 2012 PLM Lake & Land Management Corp.
 Lake Washington 2012 Water Quality Assessment Report Copyright 2012 PLM Lake & Land Management Corp. Water Quality Report On May 22nd, June 18th, July 30th, August 29th, and September 27 th, 2012, PLM
Ecosystem Consulting Service, Inc. July 15, P a g e
 Prepared for: Normanoch Association Prepared by: Robert W. Kortmann, Ph.D. Ecosystem Consulting Service, Inc. July 17, 2014 Culver Lake Status 2014 (a brief mid-summer report) Cold water fish need water
Lake Samish Water Monitoring Project 2007 Final Report
 Lake Samish Water Monitoring Project 2007 Final Report Dr. Robin A. Matthews Ms. Joan Vandersypen Institute for Watershed Studies Huxley College of the Environment Western Washington University November
White Lake 2017 Water Quality Report
 Introduction Watersheds Canada believes that every person has the right to access clean and healthy lakes and rivers in Canada. We work to keep these precious places naturally clean and healthy for people
LAKE AUBURN: THE EFFECT OF CLIMATE DRIVERS ON LAKE WATER QUALITY
 LAKE AUBURN: THE EFFECT OF CLIMATE DRIVERS ON LAKE WATER QUALITY Bernadette Kolb, Zachary Eichenwald and Daniel Bisson, CDM Smith John Storer, Auburn Water District* David Jones, Lewiston Water Division
William E. Lynch Jr. Co-Owner, Manager Millcreek Perch Farm Marysville, OH
 William E. Lynch Jr. Co-Owner, Manager Millcreek Perch Farm Marysville, OH OAA President Industry Advisory Council North Central Regional Aquaculture Center Aquaculture Realism A Severely or Chronically
Water Quality Analysis of Lakewood Lakes
 Water Quality Analysis of Lakewood Lakes December 2016 Prepared by WEST Consultants, Inc. Bellevue, Washington With support from HDR, Inc., Olympia, Washington TABLE OF CONTENTS EXECUTIVE SUMMARY... V
Learning from Lake of the Woods
 Learning from Lake of the Woods Internal loading and resuspension in shallow lakes Julie Blackburn, Minnesota Area Manager Julie.Blackburn@respec.com 651-305-5705 Lake of the Woods Aug. 2006 In 2008,
2012 Range Ponds Water Quality Report
 2012 Range Ponds Water Quality Report Prepared by Scott Williams, Aquatic Biologist Lake & Watershed Resource Management Associates The Range Ponds Environmental Association continued to monitor the health
Smithville Lake 2000 Water Quality Report
 Smithville Lake 2 Water Quality Report 1. General. a. Project location. The dam is located at river mile 12.9 on the Little Platte River, a tributary of the Platte River. The drainage area above the dam
Okanagan Large Lakes Water Quality Monitoring Program Ellison Lake Wood Lake Kalamalka Lake Okanagan Lake Skaha Lake Osoyoos Lake
 Okanagan Large Lakes Water Quality Monitoring Program Ellison Lake Wood Lake Kalamalka Lake Okanagan Lake Skaha Lake Osoyoos Lake 1 Table of Contents Goals & Objectives... Trophic Status... Data Collection...
Limnology 101. PA AWWA SE District & Eastern Section WWOAP Joint Technical Conference October 13, 2016
 Limnology 1 PA AWWA SE District & Eastern Section WWOAP Joint Technical Conference October, 2 Kristen Bowman Kavanagh, P.E. Flow Science Incorporated Limnology is the study of the biological, chemical,
Lake Houston SolarBee Project Report by
 Main Office and Service Center SolarBee, Inc. 530 25th Ave E, PO Box 1930, Dickinson, ND 58602 (866) 437-8076 (701) 225-4495 Fax (701) 225-0002 http://www.solarbee.com Lake Houston SolarBee Project Report
Recent changes in Lake Erie Trophic Status? Jan J.H. Ciborowski University of Windsor & Gerald Matisoff Case Western Reserve University
 Recent changes in Lake Erie Trophic Status? Jan J.H. Ciborowski University of Windsor & Gerald Matisoff Case Western Reserve University Important Variables and Issues Phytoplankton - primary producers
Leesville Lake Water Quality Monitoring
 Leesville Lake Water Quality Monitoring Prepared for: Leesville Lake Association Prepared by: Dr. Thomas Shahady Lynchburg College Funds Supplied by: American Electric Power & Leesville Lake Association
LAKE AUBURN: THE EFFECT OF CLIMATE DRIVERS ON LAKE WATER QUALITY
 LAKE AUBURN: THE EFFECT OF CLIMATE DRIVERS ON LAKE WATER QUALITY Zachary Eichenwald and Bernadette Kolb, CDM Smith Kenneth Wagner, Water Resource Services Mary Jane Dillingham, Auburn Water District and
PREDICTED EFFECTS OF EXTERNAL LOAD REDUCTIONS AND IN-LAKE TREATMENT ON WATER QUALITY IN CANYON LAKE A SUPPLEMENTAL SIMULATION STUDY
 PREDICTED EFFECTS OF EXTERNAL LOAD REDUCTIONS AND IN-LAKE TREATMENT ON WATER QUALITY IN CANYON LAKE A SUPPLEMENTAL SIMULATION STUDY FINAL REPORT Submitted to: Lake Elsinore-San Jacinto Watershed Authority
Leesville Lake Water Quality Monitoring Program Report
 Leesville Lake Water Quality Monitoring Program 2009 Report Prepared by Michael A. Lobue Leesville Lake Association Sponsored by Leesville Lake Association Funded by Virginia Department of Environmental
Long-Term Volunteer Lake Monitoring in the Upper Woonasquatucket Watershed
 Long-Term Volunteer Lake Monitoring in the Upper Woonasquatucket Watershed Linda Green URI Watershed Watch 1-87-95, lgreen@uri.edu WATER QUALITY IS A REFLECTION OF THE ACTIVITIES IN THE LANDS AND WATERS
Watershed and Water Quality Modeling to Support TMDL Determinations Lake Oologah
 Watershed and Water Quality Modeling to Support TMDL Determinations Lake Oologah 26 th Annual Conference Oklahoma Clean Lakes and Watersheds Association (OCLWA) April 5-6, 2017 Stillwater, Oklahoma Lake
Medicine Lake Excess Nutrients TMDL project: Water Quality Standards
 Medicine Lake Excess Nutrients TMDL project: Water Quality Standards Steering Committee Meeting #1 November 18 th, 2008 Water Quality Standards Water quality standards the fundamental benchmarks by which
Continuous records for the Chariton River indicate that 2004 was an average water year, with total flow approximately equal to the average annual
 2004 Rathbun Report Iowa State University Limnology Laboratory John A. Downing, Ph.D. George Antoniou, Assistant Scientist For Rathbun Land and Water Alliance August 31, 2005 A. Tributaries Personnel of
Lake & Watershed Resource Management Associates P O Box 65; Turner, ME
 Lake & Watershed Resource Management Associates P O Box 65; Turner, ME 207-336-2980 LWRMA@megalink.net 2008 Baseline Water Quality Monitoring and Assessment of Pemaquid and Biscay Ponds At the request
Figure 1. Causes and Effects of Low DO in Basin 1 Hypolimnion
 Causes of Low Dissolved Oxygen (DO) in Basin 1 Hypolimnion of Lake Whatcom and A Proposed solution to increase DO and improve other Water Quality Properties WWU and DOE have used data on Phosphorous, Algae,
Portage Lake Hubbard County
 Prepared in cooperation with the Minnesota Department of Natural Resources Minnesota Lake ID: 9- Area: acres Watershed Area: 6,7 acres Ecoregion: Northern Lakes and Forests (NLF) Portage Lake Hubbard County
2006 Aliceville Reservoir Report. Rivers and Reservoirs Monitoring Program
 2006 Aliceville Reservoir Report Rivers and Reservoirs Monitoring Program Field Operations Division Environmental Indicators Section Aquatic Assessment Unit May 2011 Rivers and Reservoirs Monitoring Program
Gull Lake CASS & CROW WING COUNTIES
 Gull Lake 11-0305-00 CASS & CROW WING COUNTIES Summary Gull Lake is located just northwest of Brainerd, Minnesota, on the border of Cass and Crow Wing Counties. It covers 9,947 acres, which places it in
Water Quality Study In the Streams of Flint Creek and Flint River Watersheds For TMDL Development
 Water Quality Study In the Streams of Flint Creek and Flint River Watersheds For TMDL Development Idris Abdi Doctoral Dissertation Presentation Major Advisor: Dr. Teferi Tsegaye April 18, 2005 Alabama
Lake Elsinore and San Jacinto Watersheds Authority. Canyon Lake Phase 2 Water Quality Monitoring Plan
 Lake Elsinore and San Jacinto Watersheds Authority December 2010 Background Canyon Lake was formed in 1928 when the Canyon Lake (Railroad Canyon) Dam was constructed; the lake has three main sections the
Why Water Quality? FOR IMMEDIATE RELEASE March 26, 2013
 Nutrients Nutrients Microbes Rulers of the World Microbes and Redox Potential Dissolved Oxygen Nitrogen Cycle From Waste to Gas Phosphorus Cycle or Recycle Algae The Miracle of Life Stormwater - Loadings
2016 WATER QUALITY MONITORING BELTZVILLE RESERVOIR LEHIGHTON, PENNSYLVANIA
 2016 WATER QUALITY MONITORING BELTZVILLE RESERVOIR LEHIGHTON, PENNSYLVANIA U.S. Army Corps of Engineers Philadelphia District Environmental Resources Branch December 2016 2016 Water Quality Monitoring
CLMP+ Report on Fleming Lake (Aitkin County)
") CLMP+ Report on Fleming Lake (Aitkin County) Lake ID# -5-5-6 CLMP+ Data Summary July 7 Authors Shannon Martin Contributors/acknowledgements Terry Dahlberg Sandy Dahlberg Pam Anderson For questions regarding
CLMP+ Report on Fleming Lake (Aitkin County) Lake ID# -5-5-6 CLMP+ Data Summary July 7 Authors Shannon Martin Contributors/acknowledgements Terry Dahlberg Sandy Dahlberg Pam Anderson For questions regarding
2018 Data Report for. Lotus Lake, Oakland County
 Michigan Lakes Ours to Protect 218 Data Report for Lotus Lake, Oakland County 42.6941 N, 83.4244 W The CLMP is brought to you by: 1 About this report: This report is a summary of the data that have been
Water intake for hatchery on Chattahoochee River
 Lake Lanier Turnover Facts Buford Trout Hatchery gets the water used to grow trout from the tailwater area of the Chattahoochee River immediately below Lake Lanier. Natural processes occurring in the lake
Lakes: Primary Production, Budgets and Cycling
 OCN 401-Biogeochemical Systems (9.28.17) Lakes: Primary Production, Budgets and Cycling Reading: Schlesinger, Chapter 8 Lecture Outline 1. Seasonal cycle of lake stratification Temperature / density relationship
2017 Data Report for Perch Lake, Iron County
 Michigan Lakes Ours to Protect 217 Data Report for Perch Lake, Iron County Site ID: 3646 46.361392 N, 88.658338 W The CLMP is brought to you by: 1 About this report: This report is a summary of the data
2018 Data Report for. Crystal Lake, Montcalm County
 Michigan Lakes Ours to Protect 218 Data Report for Crystal Lake, Montcalm County Site ID: 5915 43.25584 N, 84.93362 W The CLMP is brought to you by: 1 About this report: This report is a summary of the
2007 Inland and Purdy Reservoirs Report. Rivers and Reservoirs Monitoring Program
 2007 Inland and Purdy Reservoirs Report Rivers and Reservoirs Monitoring Program Field Operations Division Environmental Indicators Section Aquatic Assessment Unit June 2012 Rivers and Reservoirs Monitoring
Phosphorus Loading and Related Impacts in Southern Cayuga Lake. Dave Matthews Upstate Freshwater Institute Syracuse, NY
 Phosphorus Loading and Related Impacts in Southern Cayuga Lake Dave Matthews Upstate Freshwater Institute Syracuse, NY Upstate Freshwater Institute (UFI) mission: advance freshwater research and protect
Glossary. hefreediction ary.com/algae. hefreediction ary.com/anth
 Algae noun Any of various chiefly aquatic, eukaryotic, photosynthetic organisms, ranging in size from single-celled forms to the giant kelp. Algae were once considered to be plants but are now classified
Portage Lake CASS COUNTY
 Portage Lake 11-0204-00 CASS COUNTY Summary Portage Lake is located near Bena, MN in Cass County. It covers 1,539 acres, which places it in the upper 10% of lakes in Minnesota in terms of size. Portage
Results of Water Quality Measurements in Messer Pond Bob Crane, Messer Pond Protective Association (MPPA) Board
 Board") Results of Water Quality Measurements in Messer Pond Bob Crane, Messer Pond Protective Association (MPPA) Board The collection of water samples for the assessment of water quality in Messer Pond, New London,
Results of Water Quality Measurements in Messer Pond Bob Crane, Messer Pond Protective Association (MPPA) Board The collection of water samples for the assessment of water quality in Messer Pond, New London,
Ploof s Creek South. Johannes Creek. Grand Lake, Ploof s Creek South, Johannes Creek. Introduction
 524 4th Street South Sauk Centre, MN 56378 320.352.2231 Grand Lake, Ploof s Creek South, Johannes Creek Introduction Since the 2012 monitoring season, the Grand Lake Improvement District (Grand LID) and
Lakes, Primary Production, Budgets and Cycling
 OCN 401-Biogeochemical Systems Lecture #10 (9.22.11) Lakes, Primary Production, Budgets and Cycling (Schlesinger: Chapter 7) 1. Primary Production and Nutrient Cycling in Lakes Physical aspects and nomenclature
The Lake Partner Program
 The Lake Partner Program Anna DeSellas Scientist, Inland Lakes Monitoring & Lake Partner Program Coordinator Dorset Environmental Science Centre 1 Phosphorus and water quality Phosphorus: A nutrient that
Lakes: Primary Production, Budgets and Cycling. Lecture Outline
 OCN 401-Biogeochemical Systems (10.06.16) Lakes: Primary Production, Budgets and Cycling Reading: Schlesinger, Chapter 8 Lecture Outline 1. Seasonal cycle of lake stratification Temperature / density relationship
Water Monitoring in Spa Creek: A Summary
 Water Monitoring in Spa Creek: A Summary Written by: Alexis Jones & Blake Harden Edited by: Hannah Krauss Water monitoring is very important in order to determine the health of the Chesapeake Bay and its
An Introduction to The Ecology of Lakes, Ponds and Reservoirs. Developing a Management Plan
 An Introduction to The Ecology of Lakes, Ponds and Reservoirs Developing a Management Plan Stephen J. Souza, Ph.D. Princeton Hydro, LLC 1108 Old York Road Ringoes, NJ 08551 ssouza@princetonhydro.com Objective
Hydrology, Water Quality, and Phosphorus Loading of Little St. Germain Lake, Vilas County, Wisconsin
 Hydrology, Water Quality, and Phosphorus Loading of Little St. Germain Lake, Vilas County, Wisconsin Introduction Little St. Germain Lake, which is in Vilas County, Wisconsin, just northeast of St. Germain
Abstract. Introduction
 Effects of Residence Time and Depth on Wet Detention System Performance Harvey H. Harper, Ph.D., P.E. Environmental Research & Design, Inc. 3419 Trentwood Blvd., Suite 12 Orlando, FL 32812 Abstract Wet
Little Bay Water Quality Report Card Spring 2014
 Little Bay Water Quality Report Card Spring 2014 Little Bay is a small, semi-enclosed estuary located in the heart of Rockport, Texas. Estuaries, where freshwater from rivers and streams mixes with salt
Understanding the Basics of Limnology
 Understanding the Basics of Limnology Outline Watershed Processes Lake Formation Physical Features of Lakes Lake Processes Lake Chemistry Lake Biology Lake Management WATERSHED PROCESSES A Lake is a Reflection
OKLAHOMA CLEAN LAKES AND WATERSHEDS 23rd ANNUAL CONFERENCE AGENDA. SUCCESS STORY: 20 YEARS of HYPOLIMNETIC OXYGENATION of a RESERVOIR
 OKLAHOMA CLEAN LAKES AND WATERSHEDS 23rd ANNUAL CONFERENCE AGENDA SUCCESS STORY: 20 YEARS of HYPOLIMNETIC OXYGENATION of a RESERVOIR Agenda EBMUD & Camanche Reservoir Water Quality Challenges Speece Cone
2017 Data Report for Silver Lake, Van Buren County
 Michigan Lakes Ours to Protect 2017 Data Report for Silver Lake, Van Buren County Site ID: 800534 42.3891 N, 86.0599 W The CLMP is brought to you by: 1 About this report: This report is a summary of the
Lecture 5 CE 433. Excerpts from Lecture notes of Professor M. Ashraf Ali, BUET.
 Lecture 5 CE 433 Excerpts from Lecture notes of Professor M. Ashraf Ali, BUET. Surface Water Quality: Lakes and Reservoirs Lakes can be classified according to the degree of enrichment of nutrient and
2017 Data Report for Earl Lake, Livingston County
 Michigan Lakes Ours to Protect 217 Data Report for Earl Lake, Livingston County Site ID: 755 2.191 N, 3.95 W The CLMP is brought to you by: 1 About this report: This report is a summary of the data that
2017 Data Report for Painter Lake, Cass County
 Michigan Lakes Ours to Protect 217 Data Report for Painter Lake, Cass County Site ID: 1418 41.81667 N, 85.99194 W The CLMP is brought to you by: 1 About this report: This report is a summary of the data
Laurel Lake water quality, nutrients, and algae, summer
 Laurel Lake water quality, nutrients, and algae, summer 2011 1 H.A. Waterfield, W.N. Harman and M.F. Albright SAMPLING ACTIVITIES Site visits to Laurel Lake were made on 16 June and 25 July 2011; water
Lake & Watershed Resource Management Associates P O Box 65; Turner, ME
 Lake & Watershed Resource Management Associates P O Box 65; Turner, ME 207-336-2980 LWRMA @megalink.net 2009 Baseline Water Quality Monitoring and Assessment of McCurdy Pond At the request of the Pemaquid
Lakes, Primary Production, Budgets and Cycling Schlesinger and Bernhardt (2013): Chapter 8, p
: Chapter 8, p") OCN 401-Biogeochemical Systems Lecture #12 (10.8.13) Angelos Hannides, hannides@hawaii.edu Lakes, Primary Production, Budgets and Cycling Schlesinger and Bernhardt (2013): Chapter 8, p. 288-308 1. Physical
OCN 401-Biogeochemical Systems Lecture #12 (10.8.13) Angelos Hannides, hannides@hawaii.edu Lakes, Primary Production, Budgets and Cycling Schlesinger and Bernhardt (2013): Chapter 8, p. 288-308 1. Physical
2017 Data Report for Arbutus Lake, Grand Traverse County
 Michigan Lakes Ours to Protect 217 Data Report for Arbutus Lake, Grand Traverse County Site ID: 2819 44.65917 N, 85.519726 W The CLMP is brought to you by: 1 About this report: This report is a summary
2017 Water Quality Report and Historical Analysis. Long Lake Mickey Lake Ruth Lake. Monitoring Years
 2017 Water Quality Report and Historical Analysis Long Lake Mickey Lake Ruth Lake Monitoring Years 1993-2017 Submitted to: Long Lake Association October 2017 Prepared by: Great Lakes Environmental Center
2015 Range Ponds Water Quality Report
 2015 Range Ponds Water Quality Report Prepared by Scott Williams, Aquatic Biologist Lake & Watershed Resource Management Associates PO Box 65; Turner, ME 04282 207-576-7839 The Range Ponds Environmental
2018 Data Report for Pickerel Lake, Kalkaska County
 Michigan Lakes Ours to Protect 2018 Data Report for Pickerel Lake, Kalkaska County Site ID: 400035 44.800559 N, 84.97667 W The CLMP is brought to you by: 1 About this report: This report is a summary of
CHEMICAL: NITROGEN AND PHOSPHORUS (read pp in Dodson)
") BIOE 155, Fall 010 BACKGROUND CHEMICAL: NITROGEN AND PHOSPHORUS (read pp39-50 in Dodson) Lakes are often classified according to trophic status, specifically how much energy or food is available for the
BIOE 155, Fall 010 BACKGROUND CHEMICAL: NITROGEN AND PHOSPHORUS (read pp39-50 in Dodson) Lakes are often classified according to trophic status, specifically how much energy or food is available for the
2017 Data Report for Pleasant Lake, Wexford County
 Michigan Lakes Ours to Protect 2017 Data Report for Pleasant Lake, Wexford County Site ID: 830183 44.3 N, 85.4775 W The CLMP is brought to you by: 1 About this report: This report is a summary of the data
Michalak et al Lake Erie and HABs Dan Warner
 Record-setting algal bloom in Lake Erie caused by agricultural and meteorological trends consistent with expected future conditions Michalak et al. 2013 Lake Erie and HABs Dan Warner Context and History
Monitoring Update April 1, Northeast Aquatic Research George Knoecklein Hillary Kenyon Sabina Perkins
 Monitoring Update April 1, 215 Northeast Aquatic Research George Knoecklein Hillary Kenyon Sabina Perkins Lake Monitoring Approach for 214 Tonight's discussion will focus on in-lake aspects: Assessment
2017 Data Report for Oxbow Lake, Oakland County
 Michigan Lakes Ours to Protect 2017 Data Report for Oxbow Lake, Oakland County Site ID: 630666 42.64167 N, 83.477226 W The CLMP is brought to you by: 1 About this report: This report is a summary of the
2017 Data Report for Shingle Lake, Clare County
 Michigan Lakes Ours to Protect 217 Data Report for Shingle Lake, Clare County Site ID: 1818 43.96359 N, 84.95282 W The CLMP is brought to you by: 1 About this report: This report is a summary of the data
2017 Data Report for Hoags Lake, Mason County
 Michigan Lakes Ours to Protect 17 Data Report for Hoags Lake, Mason County.171 N,.19575 W The CLMP is brought to you by: 1 About this report: This report is a summary of the data that have been collected
Sources for Bottom Water Phosphates and Suspended Sediments in Southern Cayuga Lake, New York
 Sources for Bottom Water Phosphates and Suspended Sediments in Southern Cayuga Lake, New York Prabighya Basnet Hobart & William Smith Colleges Geneva, NY Outline of Today s Presentation Introduce Problem
How may climate change affect shallow inland lakes of New York State? A simple question with a complex answer
 How may climate change affect shallow inland lakes of New York State? A simple question with a complex answer Bruce Gilman, Professor and Director Muller Field Station Finger Lakes Community College 3325
Kill the Weeds, Not the Fish!
 Kill the Weeds, Not the Fish! Dr. Chuck Cichra University of Florida / IFAS School of Forest Resources & Conservation Program in Fisheries & Aquatic Sciences My goal is for you to have a better understanding
Figure 1. Platte River Sub-Watersheds and Monitoring Locations.
 Figure 1. Platte River Sub-Watersheds and Monitoring Locations. 10 2 1 9 7 BL Pond 8 Hatchery 6 3 5 4 1 Platte River at Fewins Rd 6 B. Creek to Hatchery Spring 2 Platte River at Stone Bridge 7 Platte River
CLMP+ Report on Grass Lake (Anoka County) Lake ID# CLMP+ Data Summary
 Lake ID# CLMP+ Data Summary") CLMP+ Report on Grass Lake (Anoka County) Lake ID# 02-0113-00 2012-2013 CLMP+ Data Summary October 2014 Authors Shannon Martin, MPCA Editing and graphic design Public Information Office Staff The (MPCA)
CLMP+ Report on Grass Lake (Anoka County) Lake ID# 02-0113-00 2012-2013 CLMP+ Data Summary October 2014 Authors Shannon Martin, MPCA Editing and graphic design Public Information Office Staff The (MPCA)
2017 Data Report for Ottawa Lake, Iron County
 Michigan Lakes Ours to Protect 2017 Data Report for Site ID: 360033 46.08484 N, 88.76419 W The CLMP is brought to you by: 1 About this report: This report is a summary of the data that have been collected
After reviewing data collected from ISLAND POND, STODDARD, the program coordinators have made the following observations and recommendations.
 OBSERVATIONS & RECOMMENDATIONS After reviewing data collected from ISLAND POND, STODDARD, the program coordinators have made the following observations and recommendations. Thank you for your continued
Narrative Water Quality Objective
 Narrative Water Quality Objective Waste discharges shall not contribute to excessive algal growth in inland surface receiving waters. (Basin Plan, 1995, pg. 4-5) Excessive is not defined No numeric standard
2017 Data Report for Big Maggie Lake, Iron County
 Michigan Lakes Ours to Protect 2017 Data Report for Big Maggie Lake, Iron County Site ID: 360173 46.01 N, 88.4626 W The CLMP is brought to you by: 1 About this report: This report is a summary of the data
WATER QUALITY ENGINEERING
 WATER QUALITY ENGINEERING Zerihun Alemayehu (AAiT-CED) Water Quality Management The control of pollution from human activities so that the water is not degraded to the point that it is no longer suitable
EUTROPHICATION. Student Lab Workbook
 EUTROPHICATION Student Lab Workbook THE SCIENTIFIC METHOD 1. Research Background literature research about a topic of interest 2. Identification of a problem Determine a problem (with regards to the topic)
USGS LAKE STUDIES CASE STUDY: SILVER LAKE (OCEANA COUNTY, MI) Angela Brennan, Hydrologist - US Geological Survey Upper Midwest Water Science Center,
 Angela Brennan, Hydrologist - US Geological Survey Upper Midwest Water Science Center,") USGS LAKE STUDIES CASE STUDY: SILVER LAKE (OCEANA COUNTY, MI) Angela Brennan, Hydrologist - US Geological Survey Upper Midwest Water Science Center, Lansing, MI October 18, 2017 USGS Inland lake studies
USGS LAKE STUDIES CASE STUDY: SILVER LAKE (OCEANA COUNTY, MI) Angela Brennan, Hydrologist - US Geological Survey Upper Midwest Water Science Center, Lansing, MI October 18, 2017 USGS Inland lake studies
2018 Sebago Lake Assessment
 2018 Sebago Lake Assessment Portland Water District Sebago Lake Watershed Monitoring Programs Lake Monitoring Presenting data from 1976 to 2018 Nathan Whalen Introduction Sebago Lake is the primary drinking
Watershed - Lake Model to Support TMDL Determinations for Lake Thunderbird
 Watershed - Lake Model to Support TMDL Determinations for Lake Thunderbird 18 th Annual EPA Region 6 Stormwater Conference Workshop 5: TMDLs and You October 3, 2016 Oklahoma City, OK Lake Thunderbird Watershed-Lake
Lake Thunderbird Water Quality
 Oklahoma Water Resources Board Lake Thunderbird Water Quality 2012 for the Central Oklahoma Master Conservancy District March 21, 2013 FINAL REPORT Oklahoma Water Resources Board 3800 North Classen Boulevard,
Evaluation of Water Quality in. Sylvia Heaton Water Bureau, MDNRE
 Evaluation of Water Quality in Ford and Belleville Lakes Sylvia Heaton Water Bureau, MDNRE Objectives of 2010 TMDL Reevaluation Evaluate nutrient (total phosphorus) levels in Ford and Belleville Lakes
RECOMMENDED BINATIONAL PHOSPHORUS TARGETS TO COMBAT LAKE ERIE ALGAL BLOOMS
 June 2015 RECOMMENDED BINATIONAL PHOSPHORUS TARGETS TO COMBAT LAKE ERIE ALGAL BLOOMS Introduction Algae occur naturally in freshwater systems. They are essential to the aquatic food web and healthy ecosystems.
Effect of Turbidity on Dissolved Oxygen in the Lake Macatawa. Watershed
 Effect of Turbidity on Dissolved Oxygen in the Lake Macatawa Watershed Hope College GES 401 Research Project Group Members: Peter Van Heest, Rachel Burkhart, Wyatt Curry Advisor: Dr. G. Peaslee Introduction
Harry S Truman Reservoir 1999 Water Quality Report
 Harry S Truman Reservoir 999 Water Quality Report. General. a. Project location. Truman Dam is located approximately. miles northwest of Warsaw, Missouri, at river mile. on the Osage River, a tributary
Nutrient distributions and the interaction between coastal wetlands and the nearshore of Lake Ontario
 Nutrient distributions and the interaction between coastal wetlands and the nearshore of Ontario Krista Chomicki and Gary Bowen International Association of Great s Research, 25 Type Durham Region Coastal
2017 Data Report for Deer Lake, Alger County
 Michigan Lakes Ours to Protect 2017 Data Report for Deer Lake, Alger County Site ID: 020127 46.48016 N, 86.98277 W The CLMP is brought to you by: 1 About this report: This report is a summary of the data
Wakefield Lake TMDL Public Meeting 3/17/2014. Jen Koehler, PE Barr Engineering
 Wakefield Lake TMDL Public Meeting 3/17/2014 Jen Koehler, PE Barr Engineering Outline Project Contacts Introduction to Wakefield Lake Thoughts/Questions/Concerns About TMDL Studies Lake Water Quality and
2017 Data Report for Loon Lake, Iosco County
 Michigan Lakes Ours to Protect 2017 Data Report for Loon Lake, Iosco County Site ID: 350078 The CLMP is brought to you by: 1 About this report: This report is a summary of the data that have been collected