Yawkey Living Shorelines Pilot Project
|
|
|
- Kristina Bennett
- 6 years ago
- Views:
Transcription


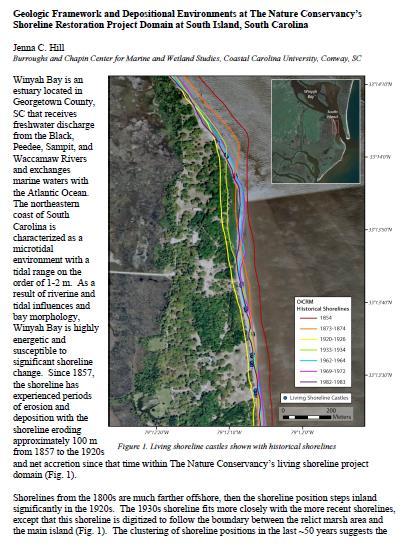
1 1 Yawkey Living Shorelines Pilot Project Oyster Recruitment & Erosion Control on South Island David McColl, Joy Brown Edited by Alana Sweatt
2 ABSTRACT: Populations of eastern oyster, (Crassostrea virginica) and sedimentation erosion along the southeast coast are becoming a concern for society and many researchers. Oysters are an important species for estuaries, bays and shorelines of the southeast. Yawkey Preserve in Georgetown, SC is an ideal location for this type of restoration effort. Winyah Bays high energy can provide challenges for preserving these shorelines naturally and expand populations of oysters. Utilizing man-made materials and native plants may provide beneficial results for continuing research. Using patented interlocking blocks for recruitment of oysters, natural marsh grass (Spartina alterniflora), planted for erosion control, may determine if these efforts will continue and what adjustments need to be made for future projects. INTRODUCTION: The Eastern oyster, Crassostrea virginica, populations that once thrived in coastal regions have been greatly reduced along coastal shorelines of the eastern United States for many years. Declines have been a result from environmental concerns, excessive harvesting and disease (Breitburg et al. 2000). Oysters are sessile mollusks found in the class Bivalvia, which means they have two shells that protect the soft body mass of the oyster and have an elastic ligament that controls the opening of the shell. In the southeast oysters form a three dimensional reef that extend vertically into the water column and are exposed during low tide (Bahr & Lanier 1981). Oyster reefs generally form from the settlement of oyster spat on a suitable substrate. Reefs expand as subsequent generations of oysters settle on living adult oysters and dead oyster shell that surrounds the newly formed reef (Bahr & Lanier 1981). In the southeastern United States, most oyster reefs are intertidal because in the high salinity estuaries of this area marine predators such as oyster drills and boring sponges decimate subtidal oyster populations (Dame, 1976). Because of the economic and ecological value of this specialized habitat, projects have been conducted at multiple scales to restore subtidal and intertidal oyster reefs to their historical extent (Alix et al. 2010). From an environmental standpoint, oysters are an indicator species that reflect the health of their surrounding ecosystem. Oyster reefs provide nesting habitat, settlement areas, and refuge for numerous species of fish and invertebrates (Wenner et al. 1996; Coen et al. 1999).The filtration capacity of an average oyster is estimated to be 50 gallons per day ( they not only clean the water but their reefs whether natural or artificial, provide sanctuary for many marine species and can reduce the erosion potential along intertidal shorelines, especially in high energy areas. The construction of hard substrate structures along shorelines may allow not only oysters to recruit and grow, but maintain and improve sedimentation erosion along these ecosystems. Furthermore, the use of marsh grass (i.e. Smooth cordgrass, Spartina alterniflora), can create an additional ingredient in maintaining erosion and assist in the development of artificial oyster reefs. Because of the sloping continental shelf and the daily tide changes along the southeast coast, Spartina alterniflora is natural vegetation (Bahr & Lanier 1981). In recent years living shorelines pilot projects have been installed along the southeast coast of the United States. More common 2
.")
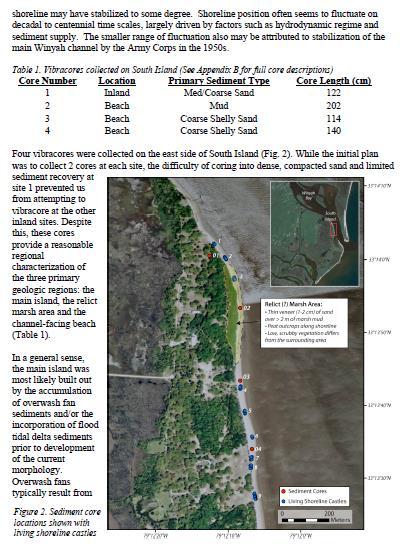
3 shoreline vegetation is often planted in conjunction with oyster restoration projects to provide additional reduction in shoreline erosion and create a more diverse habitat structure. STUDY SITE: The site location for the Living Shorelines Pilot Project is situated along the shoreline of the Tom Yawkey Wildlife Preserve on South Island in Georgetown, South Carolina (Figure 1). The shoreline runs along the western side of Winyah Bay, where the Waccamaw, Great Pee Dee, Little Pee Dee, Black and Sampit rivers flows into the Atlantic Ocean. These castle configurations were based on work being studied by The Nature Conservancy in the Cape Romain National Wildlife Refuge, located near McClellanville, South Carolina, (SC). The South Island site location was selected due to the presence of oysters in Winyah Bay and the erosion along the estuarine shoreline. Figure 1 Shown below is a location map of Winyah Bay in Georgetown, South Carolina. The eastern edge of the Tom Yawkey Wildlife Center is South Island, which is the area of interest for the oyster installation project. The study area is highlighted in green. There are ten separate castle groups extending approximately one mile along the shoreline of Winyah Bay within the intertidal zone (Figure 2). Two of the groups (numbers one and six) consist of two castle configurations, while the remaining eight have six separate castle 3
.")
4 configurations making up the group. These castle groups were assembled along the shoreline on South Island within the Yawkey Wildlife Preserve in September of (Please refer to materials and methods section for construction detail). In September of 2010 volunteers from Horry-Georgetown Technical College, (HGTC) assisted The Nature Conservancy in the assembly of each castle group site, and planted marsh grass (Spartina alterniflora) behind each group along the beach. A Hydrolab MS5 was installed on the old Coast Guard pier at the extreme north end of the project site. A three inch PVC pipe was equipped with metal fasteners and attached to a treated 2x6 piece of lumber then screwed into the piling on the pier with 6 stainless steel screws. To allow water to flow freely through the pipe a number of holes were created on the entire length of the pipe. Figure 2 The figure below shows the layout of the ten groupings of oyster castles that were installed on South Island for the project. Each star represents an oyster grouping. Each grouping consists of 6 configurations of oyster blocks, except groups one and six which have only two configurations. The green circle with the star within it represents the location of the Hydrolab unit that was placed off of the Old Coast Guard Pier on South Island. MATERIALS AND METHODS: The main component for this project was the use of concrete blocks, which are shaped to create greater stability in stacking, the interlocking of each individual configuration of stacking blocks are called castles, (Figure 3). Each site consisted of 4

 to promote oyster recruitment and growth.")
 behind each group along the beach of the Yawkey Wildlife Preserve. Please refer to Appendix IV for the monitoring schedule.")
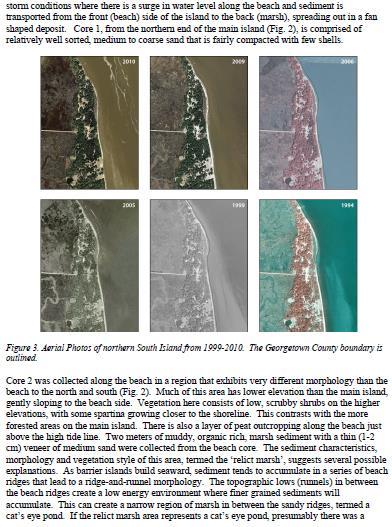
5 either two or six castle configurations, which in turn are called castle groups. These castle blocks are constructed for the specific purpose and use of oyster recruitment research and are a viable spatial assessment tool to determine distribution patterns of oysters prior to a large scale restoration project. Made by Allied Concrete in Virginia, these blocks have a Gold Cradle to Cradle Certification ( Each block measures 12 x 12 x 8 and is composed of concrete, limestone, crushed shell and pozzolan (micro-silica) to promote oyster recruitment and growth. All configurations consist of three tiers of these specialized concrete blocks, ten on the lower tier, six on the center tier and three on top with an interlocking nature (Figure 4). Volunteers planted marsh grass (Spartina alterniflora) behind each group along the beach of the Yawkey Wildlife Preserve. Please refer to Appendix IV for the monitoring schedule. Figure 3 - The images below represents multiple configurations of the oyster blocks. (A) Shows how the configurations are set up on shore, and represent one of many possible castle configurations possible. (B) Gives an above view of the configuration to show the interlocking nature of the blocks. The interlocking aspect of the blocks allows for the various configurations to be made. A B 5

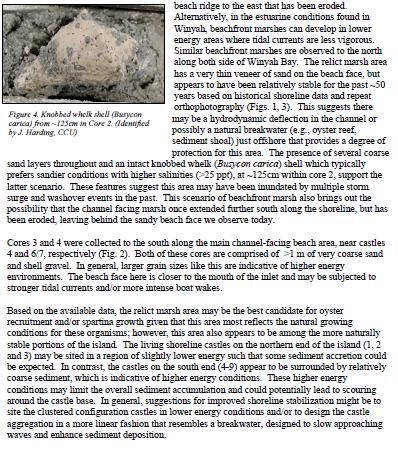
6 Figure 4-The image above explains the different terminology for oyster castles. A single castle block is circled in orange. These are four walled single blocks with 12 x12 x8 dimensions. A castle configuration is made by stacking single blocks so that the upper level ones lock the lower blocks in place. This is shown within the green circle. This forms a 3D formation on the shore. Each configuration for this project included 19 singular blocks. A castle group, shown circled in purple, is two or more configurations grouped into one area. In this project there are ten groupings with six or two configurations within each group. Spartina alterniflora was planted in October 2010 behind each castle group one month after the castles were assembled, in an attempt to minimize erosion and maximize protection for the castles and oyster spat recruitment. Monitoring the S.alterniflora was performed bi-monthly, using a (0.25m 2 ) quadrant, recording the number of live shoots vs. dead shoots. Densities were determined using reference points of existing S.alterniflora at two points within the project site. The first point is located 100 south of the Old Coast Guard pier where the Hydrolab was installed. The second reference area of S.alterniflora, a remaining population from the existing marsh area is located along the beach between castle group three and four. Existing population median values were calculated from both sites and determined to have sprouts per quadrant. Our target was 10% density of our reference value over the first year. A density of 1.45 sprigs was our goal. 6

7 Water quality, an essential ingredient for the recruitment and survival of oysters was monitored using a Hydrolab MS5. Data was recorded from February 2010 thru August 2010 and the downloaded data include the following parameters; salinity, temperature, ph, turbidity, depth and dissolved oxygen. To measure sedimentation rates behind the castles a 2 surface grab was implemented. Sediment samples were collected once a month by setting a (0.25m 2 ) quadrant behind the back left corner of each individual castle group. An 8 oz. yogurt container was trimmed down to a two inch height and used for the collection of the sedimentation samples by placing it behind each castle group at pre-determined locations within the 0.25m 2 quadrant. Once the container was in place a stainless steel spoon was used to scoop the sediment that was located within the open ended container and the two samples were combined and stored in a zip lock bag for analysis and labeled with the castle group number. The 2 grabs samples were taken at the identical location behind each castle group on each scheduled date. The sediment samples were then taken to the Belle Baruch lab at Hobcaw Barony in Georgetown, SC. Working with Clemson University each sample was allowed to dry before measuring grain size and composition with the Laser Diffraction Grain Analyzer. Once dried, each bag was processed through the analyzer and the data was recorded for later compilation, which will be used to assess grain size and help with the assessment of sedimentation accretion or erosion at the project site. Vibracore sampling was also performed along the shoreline of this project by Coastal Carolina University to determine soil composition within the research site. This report can be found in Appendix 1. Figure 5 Shown circled in red in the image below is the Hydrolab unit that was attached to the Old Coast Guard Pier. The Hydrolab can give reliable water quality data consistently for two weeks at a time. This way we can better understand what factors are helping and hindering oyster growth as time passes during the project. DATA ANALYSIS: 7
8 Temperature (F) Salinity (ppt) Water Quality: Data was collected from the Hydrolab MS5 from February 1 st through July 8 th. The collection point was located at the northern end of the project site. The start of May saw average temperatures reach temperatures being recorded also increased salinity levels. The average salinity levels were ppt at the end of May increasing to 31.7 ppt at the beginning of July. The first visual spat recruitment was seen on June 25 th when average salinity was recorded at ppt and temperatures at degrees Fahrenheit (Figure 6). Figure 6: The chart below shows the temperature and salinity levels for the South Island shoreline area from February 2011 to July The data on the chart was obtained by using the Hydrolab. This data helps to understand how water quality plays a role in oyster growth. This is especially important with regards to what is needed to support the presence of spat, which includes the part of the oyster lifecycle in which the baby oyster finds a surface to attach upon and begin to grow South Island Temperature and Salinity Data from February to July Temperature (F) Salinity (ppt) First visual spat recruitment /1/11 4/2/11 Date 6/1/11 7/31/11 Spartina alterniflora (marsh grass): This site location presented an extraordinary level of wave energy that is channeled through Winyah Bay. Within the first three months of the project, castle groups four through ten were completely cleared of all of planted marsh grass (Spartina alterniflora). By March, the marsh grass was retained only behind castle groups one and three, both with declining numbers of sprigs. The sprig count in August showed castle group one maintained its numbers, castle group three was cleared of sprigs for the first time and castle 8
, castle group one had retained sprig numbers, castle group two lost all sprigs and castle group three experienced a slight regeneration in")
 shows almost a year after the original planting.")
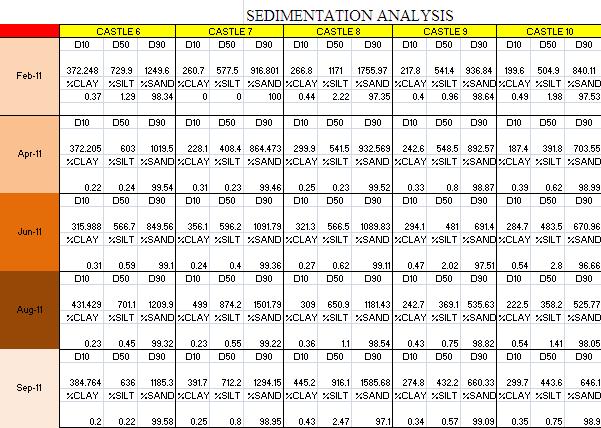
9 group two showed signs of regenerating marsh grass sprigs. All other castles have not been able to regenerate growth. As of the final date of monitoring (September 24, 2011), castle group one had retained sprig numbers, castle group two lost all sprigs and castle group three experienced a slight regeneration in sprig counts. See spreadsheet in Appendix II. Figure 7: Image (A) shows the planting of the Spartina alterniflora in the fall of This planting was to help negate the effects of erosion and to study how the Spartina plays a role in coastal ecosystems. Image (B) shows almost a year after the original planting. It can be seen how little of the Spartina was able to regenerate after being washed over multiple times and after sedimentation accrual. Castle Group 2 10/2010 Castle Group 1 8/2011 Sedimentation: With the tremendous wave energy that flows through Winyah Bay, this site experienced varying degrees of change. Frequently, sedimentation behind the castle groups would demonstrate erosion and accretion, group three seemed to demonstrate this process more than others. Because of the changing levels of sedimentation, the planted Spartina alterniflora was not able to survive and develop behind most of the castle groups. Noted on castle group eight on the September 24 th monitoring date was the loss of spat and oyster growth. After Hurricane Irene passed by the area at the end of August of 2011 a number of the castle groups experienced excessive sedimentation build up and caused the mortality of previously recruited spat on castle group seven and eight. Sediment samples collected from behind the castle groups were analyzed and the complete results of the analysis are included in Appendix III. All of the sediment samples that were analyzed were composed mainly of sand particles. The median values for each sample were graphed (Figure 8) and display a few patterns about the castles groups. Castle groups 1 and 2, located at the northwestern end of the bench, demonstrated very 9
10 Grain Size (um) similar results. Castle groups 4, 5, 6, 7, 9 and 10 were similar and the sediment atmosphere was generally the same and fell between micromilligrams during the sampling period. Castle group 3 was the only area that experienced excessive erosion on two separate occasions, where all sand particles were removed leaving only a clay base. Castle group 8 trended a little more toward the larger end of the scale and was located in a high energy area of the South Island beach shoreline Median grain size for the Ten Oyster Castle Groupings on South Island, SC CASTLE 1 CASTLE 2 CASTLE 3 CASTLE 4 CASTLE 5 CASTLE 6 CASTLE 7 CASTLE 8 CASTLE 9 CASTLE Feb-11 Mar-11 Apr-11 May-11 Jun-11 Jul-11 Aug-11 Sep-11 Date Figure 8 The above graph shows the median sediment grain size in micrometers. All of the castles experienced similar accretion and erosion patterns with the exception of castle group 3. 10
 compares was about a month before image (C).")
 and (D) are of group three taken approximately two months apart of one another.")


11 Figure 9 Below are two examples from the project site showing the sedimentation accrual and erosion effects during the project. Image (A) compares was about a month before image (C). The two images are both of oyster group 5 and show the immense amount of sedimentation which buried the castles. Images (B) and (D) are of group three taken approximately two months apart of one another. This is the only group to suffer from excessive erosion, and was left bare in September. A: Group 5 8/2011 B: Group 3 7/2011 C: Group 5 9/24/2011 D: Group 3 9/24/2011 Oyster Recruitment: January21 st 2011 was the start of visual inspection for spat recruitment on all ten castle groups. The first week of May recorded water temperatures reached70 0 F. On May 27 th barnacles appeared on the lower tiers of the castle configurations that were located closest to the water s edge, on castle groups two and three, attaching themselves to the lowest or base tier 11


12 of the castle configuration. This was an ongoing occurrence with attachment of barnacles and spat. Lower tiers on castle groups two, three, seven, and eight were all experiencing this recruitment. The second row of these same castle groups showed no recruitment and remained void of any. All four of those castle groups were constructed lower within the intertidal zone. On June 25 th spat was observed on the Hydrolab (installed at the northern end of the project site), as well as the lower tiers of castle groups two and three. The Hydrolab had nine spat; castle group two had recruited multiple spat where as castle group three had recruited only one. Recruitment of spat continued to increase on groups two and three, still the lower tiers closest to the water were the only areas of recruitment. It wasn t until the scheduled monitoring date of August 6 th that spat started to recruit on groups seven and eight. Figure 10: Images of spat growth at various times occurring on group 2. Pictures A & B taken 7/9/2011 and Pictures C & D taken 9/24/2011. In (A) shows the beginning of spat accrual on the blocks, (B) spat increasing in size, (C) actual oyster growth on the blocks, and (D) increased oyster growth on group 2. 12
13 CONCLUSION: Our project attempted to simulate irregular elevations of natural oyster reefs. This is one attempt to establish recruitment of oysters and stabilize intertidal shorelines artificially. Different approaches are being developed that may assist in the future of oysters along the southeastern shorelines and estuaries of the United States. Restoration efforts will become more important in the coming years not only for oysters and the ecosystems they can provide but for the benefit of erosion control along the southeastern shorelines. Creating living shorelines can have great benefits for society, tidal, and intertidal ecosystems. Because of results attained from this project an additional project with some minor adjustments will be implemented on North Island within the Yawkey Preserve. This project can continue to be a teaching tool as demonstrated in September with a lecture of the project and its ramifications for future oyster studies and their benefits to the Wildlife class of Professor Westerhold at HGTC. ACKNOWLEDGEMENTS: We thank the Yawkey Foundation and the South Carolina Department of Natural Resources for the use of shoreline on South Island to conduct this research project. Also, we appreciate the financial support of the U.S. Fish and Wildlife Service and the Bunnelle Foundation of Georgetown, South Carolina. A special thank you of appreciation for the support received from the students in the Forestry/Wildlife Management degree program at Horry-Georgetown Technical College. 13
14 LITERATURE CITED: Bartol, I.K. and R. Mann Small scale patterns of recruitment on a constructed intertidal reef: the role of spatial refugia. In: M.W. Luckenbach, R. Mann, and J.A. Wesson, eds. Oyster Reef Habitat Restoration: A Synopsis and Synthesis of Approaches. Bahr, L.N. and W.P. Lanier The ecology of intertidal oyster reefs of the South Atlantic coast: a community profile. U.S. Fish and Wildlife Service Biological Reports. Breitburg, D.L., L.D. Coen, M.W. Luckenbach, R. Mann, M. Posey, and J.A. Wesson Oyster Reef Restoration: Convergence of Harvest and Conservation Strategies. Journal of Shellfish Research. Coen, L.D., D.M. Knott, E.L. Wenner, N.H. Hadley, A.H. Ringwood, and M.Y. Bobo South Carolina intertidal oyster reef studies: design, sampling, and focus for evaluating habitat value and function. Coen, L.D., R.D. Brumbaugh, D. Bushek, R. Grizzle, M.W. Luckenbach, M.H. Posey, S.P. Powers, and S.G. Tolley Ecosystem services related to oyster restoration. Coen, L.E., M.W. Luckenbach, and D.L. Breitburg The role of oyster reefs as an essential fish habitat: a review of current knowledge and some new perspectives Dame, R.F Energy flow in an intertidal oyster population. Estuarine and Coastal Marine Science Stricklin, Alix G, Mark S Peterson, John D Lopez, Christopher A May, Christina F Mohrman, Mark S Woodrey in Gulf and Caribbean Research (2010) Do small, patchy, constructed intertidal oyster reefs reduce salt marsh erosion as well as natural reefs. 14
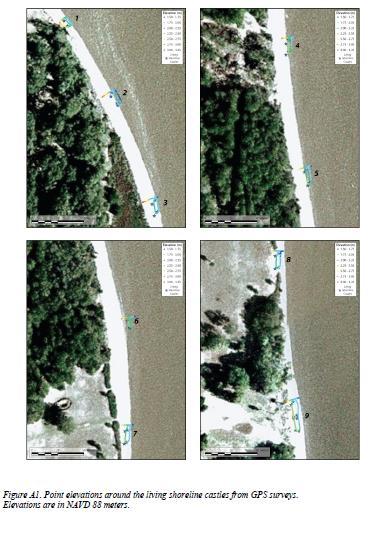
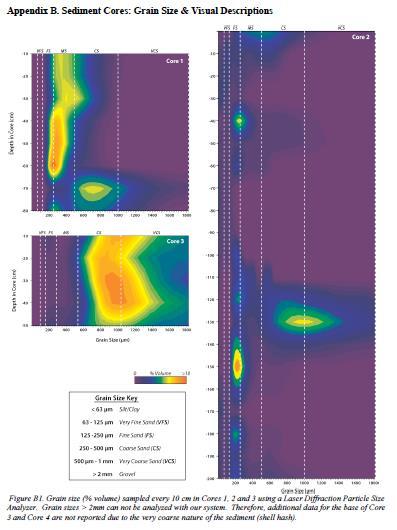
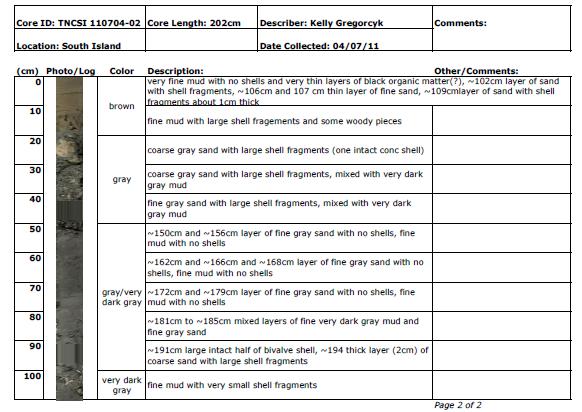
15 APPENDIX: Appendix I: Vibracore data report from Coastal Carolina University 15
16 16
17 17
18 18
19 19
20 20
21 21
22 22
23 23
24 24
25 25
26 26
27 27
28 28
29 29
30 30
31 31
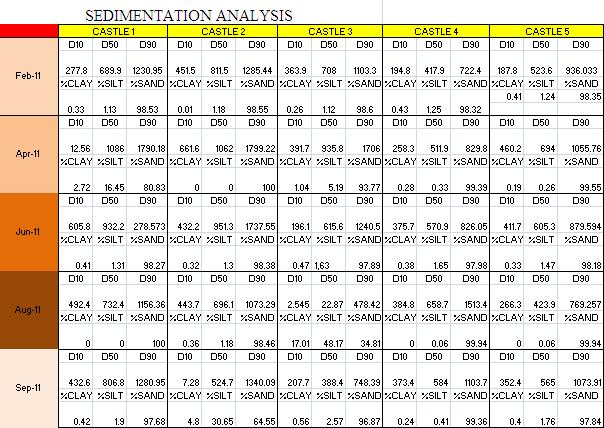
32 Appendix II: After planting the Spartina alterniflora plugs, the site was monitored and sprouts of Spartina were counted to see if there was re-growth or plants that still exist from the original planting. YAWKEY LIVING SHORELINE PILOT PROJECT: SPARTINA SPRIG COUNTS CASTLE GROUP 1 CASTLE GROUP 2 CASTLE GROUP 3 CASTLE GROUP 4 CASTLE GROUP 5 CASTLE GROUP 6 CASTLE GROUP 7 CASTLE GROUP 8 JAN JAN MARCH MARCH MAY MAY JULY JULY AUGUST AUGUST SEPTEMBER SEPTEMBER Appendix III: Table of all of the sediment grain measurements taken to record the differences in grain size between the ten groups of castles. 32
33 33
34 34
35 Appendix IV: Documentation of the schedule to be followed for the duration of the project. This also includes the monitoring information and schedule that was followed during the project. Yawkey Living Shoreline Monitoring Schedule DATE Low Tide Water Quality Oyster Visual Oyster Photos Spartina Density Jan. 21, : 3 2 P M Install housing x x Soil Erosion Jan. 31, :33PM Install x Hydrolab Feb. 14, :57AM x x x Feb. 28, :18AM x x Mar : 0 4 P M x x If needed x Apr : 5 5 P M x x Apr :43PM x x x x Apr :34PM x x May :19AM x x x x May :03AM x x June : 5 5 A M x x x x June :12AM x x July : 3 3 A M x x x x July : 4 1 A M x x Aug : 1 5 A M x x x x Aug : 0 3 A M x x Aug. 27, : 2 6 P M x x x x Sept 10, : 4 3 P M x x Sept 24, :09PM x x x x x 35
Salt Marsh Restoration. Mary Ann Metcalf
 Salt Marsh Restoration Brent Manning Mary Ann Metcalf What is a salt marsh? Shallow areas flooded by ocean tides on a regular basis Found on margins of sounds and estuaries Plant communities adapted to
Long Island s. Environmental Issues. Environmental Issues. Environmental Setting. Environmental Setting. Suburbia and the Environment
 Environmental Issues Long Island s Environmental Issues Copyright 2011 AFG 1 agricultural land air pollution aquifers automobile barrier islands biozones fisheries groundwater recharge invasive species
Climate Change and Chesapeake Bay Habitats
 Climate Change and Chesapeake Bay Habitats Donna Marie Bilkovic STAC Chesapeake Bay Forage Base Workshop 12 November 2014 http://www.chesapeake.org/stac/ Virginia Institute of Marine Science www.ccrm.vims.edu
Chesapeake Bay. report card
 Chesapeake Bay report card 2010 C- C Healthy water quality provides better habitat conditions for crabs, fish, and other aquatic species. issolved oxygen is essential to the survival of all these organisms;
Estuary Adventures. Background. Objective
 Estuary Adventures Objective Students will work in groups to understand the concept of estuaries, their importance, and the role that density plays in the mixing of fresh and salt water. Students will
2016 Lake Worth Lagoon CAP 1135 Benthic Macroinvertebrate Study. Preliminary Results
 2016 Lake Worth Lagoon CAP 1135 Benthic Macroinvertebrate Study Preliminary Results Study Objectives Section 1135 of the Water Resources Development Act of 1986 - U.S. Army Corps of Engineers may plan,
Coastal studies in Long Term Ecological Research. Dan Reed Santa Barbara Coastal LTER
 Coastal studies in Long Term Ecological Research Dan Reed Santa Barbara Coastal LTER NSF s Long Term Ecological Research Program 24 sites representing a diverse array of biomes Major focus of research
Maryland s Living Shorelines Program. Bhaskaran Subramanian February 27, 2015
 Maryland s Living Shorelines Program Bhaskaran Subramanian February 27, 2015 1 Erosion & traditional approaches Living shorelines- what is it? Maryland s Living Shorelines program LS Law Products Funding-
Annual Update. Large-Scale Oyster Restoration in Support of the Chesapeake Bay Agreement Oyster Goal. Stephanie Reynolds Westby, NOAA
 Annual Update Large-Scale Oyster Restoration in Support of the Chesapeake Bay Agreement Oyster Goal Stephanie Reynolds Westby, NOAA Susan Conner, USACE- Norfolk District Policy Drivers Executive Order
Chesapeake Bay Report Card 2016
 hesapeake Bay Report ard 216 University of Maryland enter for Environmental Science Fun for you and your family Stewardship is defined as the responsible oversight and protection of something considered
Dead-Zones and Coastal Eutrophication: Case- Study of Chesapeake Bay W. M. Kemp University of Maryland CES Horn Point Laboratory Cambridge, MD
 Dead-Zones and Coastal Eutrophication: Case- Study of Chesapeake Bay W. M. Kemp University of Maryland CES Horn Point Laboratory Cambridge, MD Presentation to COSEE Trends Orientation at UMCES HPL 4 August
Minimizing Risks of Vibrio Bacteria in Farm-Raised Oysters Grown in Intertidal Environments of the Delaware Bay
 Minimizing Risks of Vibrio Bacteria in Farm-Raised Oysters Grown in Intertidal Environments of the Delaware Bay March 2 Lisa M. Calvo, Tal Ben-Horin, and David Bushek Haskin Shellfish Research Laboratory,
Life in Water. Chapter 3
 Life in Water Chapter 3 Outline Hydrologic Cycle Oceans Shallow Marine Waters Marine Shores Estuaries, Salt Marshes, and Mangrove Forests Rivers and Streams Lakes 2 The Hydrologic Cycle Over 71% of the
VOL. 27, NO. 1 March 2010
 WETLAND SCIENCE AND PRACTICE VOL. 27, NO. 1 Two Shroom Pool Bob Upcavage July 2009 SWS Research Brief No. 2009-0005 WSP Mangrove Field of Dreams: If We Build It, Will They Come? Background Mangrove forests
AP Environmental Science
 AP Environmental Science Types of aquatic life zones MARINE Estuaries coral reefs mangrove swamps neritic zone pelagic zone FRESHWATER lakes and ponds streams and rivers wetlands Distribution of aquatic
Title: Wildlife Rescue. By Elizabeth Trowbridge. Theme: Oil spills can have a wide variety of effects on wildlife.
 Title: Wildlife Rescue By Elizabeth Trowbridge Theme: Oil spills can have a wide variety of effects on wildlife. Objectives: - Students will identify major habitats of southcoastal Alaska and their inhabitants.
OUR MISSION: To preserve, protect, and restore Delaware s Inland Bays the water that flows into them and the watershed around them.
 OUR MISSION: To preserve, protect, and restore Delaware s Inland Bays the water that flows into them and the watershed around them. OUR In 1988, the Delaware Inland Bays were declared an estuary of national
Informing Olympia Oyster Restoration: Evaluation of Factors That Limit Populations in a California Estuary
 Wetlands (2010) 30:449 459 DOI 10.1007/s13157-010-0056-4 ORIGINAL PAPER Informing Olympia Oyster Restoration: Evaluation of Factors That Limit Populations in a California Estuary Kerstin Wasson Received:
ANNUAL PLATTE RIVER SURFACE WATER FLOW SUMMARY
 ANNUAL PLATTE RIVER SURFACE WATER FLOW SUMMARY 4/3/213 Platte River Recovery Implementation Program 213 ANNUAL SURFACE WATER FLOW SUMMARY DRAFT Prepared by staff of the Platte River Recovery Implementation
A Case Study on Ocean Acidification By Sindia M. Rivera-Jiménez, Ph.D. Department of Natural Science, Santa Fe College, Gainesville Fl
 A Case Study on Ocean Acidification By Sindia M. Rivera-Jiménez, Ph.D. Department of Natural Science, Santa Fe College, Gainesville Fl Please read the following abstract of an article from the journal
Chapter Concepts LIFE IN WATER. The Hydrologic Cycle. The Hydrologic Cycle
 Chapter Concepts Chapter 3 LIFE IN WATER The hydrologic cycle exchanges water among reservoirs The biology of aquatic environments corresponds broadly to variations in physical factors such as light, temperature,
Settlement Agreement Report
 Settlement Agreement Report Fourth Quarter October December 2010 Prepared for the Technical Oversight Committee February 15, 2011 Prepared by: Cheol Mo, Violeta Ciuca, and Stuart Van Horn Restoration Sciences
Living Shorelines & Coastal Resiliency: A Consultants Perspective. Presented by: Bethany Bearmore, P.E. Louis Berger
 Living Shorelines & Coastal Resiliency: A Consultants Perspective Presented by: Bethany Bearmore, P.E. Louis Berger Living Shorelines & Coastal Resiliency A Consultants Perspective 1. Why 2. Process 3.
General Instream Flow Methods Overview. Agency Meeting on 2012 Draft Study Descriptions January 24, 2011
 General Instream Flow Methods Overview Agency Meeting on 2012 Draft Study Descriptions January 24, 2011 1 Susitna River 2 Main Channel and Side Channels 3 Sloughs and Side Channels 4 Turbidity Portage
The Hypoxic Zone in the Gulf of Mexico
 The Hypoxic Zone in the Gulf of Mexico References Council Committee on Environmental and Natural Resources. 2003. An Assessment of Coastal Hypoxia and Eutrophication in U.S. Water. National Science and
Chapter 11. A Regulatory Framework for Shoreline Structures. Summary of Issues and Recommendations
 Chapter 11. Summary of Issues and Recommendations The Massachusetts Waterways (Chapter 91) Regulations (310 CMR 9.32 (1)) prohibit the licensing of new, non-commercial structures (i.e., private docks and
Initial Application of a Landscape Evolution Model to a Louisiana Wetland
 Initial Application of a Landscape Evolution Model to a Louisiana Wetland by Carl F. Cerco PURPOSE: Corps planning projects encompass a wide variety of restoration goals. These include wetland restoration,
Coastal Resource Management Planning
 College of William and Mary W&M Publish Reports Spring 2011 Coastal Resource Management Planning Center for Coastal Resources Management, Virginia Institute of Marine Science Follow this and additional
WONDERFUL, WATERFUL WETLANDS
 WONDERFUL, WATERFUL WETLANDS OBJECTIVES The student will do the following: 1. List characteristics of wetlands. SUBJECTS: Science, Language Arts TIME: 60 minutes 2. Describe the functions of a wetland.
Sustainable exploitation and management of autogenic ecosystem engineers: application to oysters in Chesapeake Bay
 Ecological Applications, 23(4), 2013, pp. 766 776 Ó 2013 by the Ecological Society of America Sustainable exploitation and management of autogenic ecosystem engineers: application to oysters in Chesapeake
Potential use of Hydrophobic Aerogels in future oil spill clean-ups
 Potential use of Hydrophobic Aerogels in future oil spill clean-ups Hinna Hafeez, Undergraduate Student, Dalhousie University Abstract For thirty years, oil spill clean up methods did not change until
River Restoration in Japan
 River Restoration in Japan Keigo Nakamura, Ph.D Water Environment Research Group Public Works Research Institute Contents What is restoration? History of river restoration in Japan Basics for river restoration
1. Philippines Coastal & Marine Resources: An Introduction
 1. Philippines Coastal & Marine Resources: An Introduction Thousands of islands. With its thousands of. islands, the Philippines has one of the longest coastlines in the world estimated at 36,289 kilometers.
Lake Worth Lagoon Connections: Land-Based Sources of Pollution, Fisheries Habitats and the Florida Coral Reef Tract
 Lake Worth Lagoon Connections: Land-Based Sources of Pollution, Fisheries Habitats and the Florida Coral Reef Tract Kurtis Gregg, M.S. Coral Reef Fishery Biologist NOAA Fisheries Service Habitat Conservation
OUR OCEANS FACTSHEET. Ocean life
 The ocean makes our planet a wonderful place to live. It gives us more than half of the oxygen we breathe. It regulates the climate, absorbs a quarter of the carbon that we put into the atmosphere every
Virginia Shellfish Aquaculture Situation and Outlook Report
 Virginia Shellfish Aquaculture Situation and Outlook Report Results of the 2013 Virginia Shellfish Aquaculture Crop Reporting Survey April 2014 Karen Hudson Shellfish Aquaculture Specialist Thomas J. Murray
Influence of wave action on Mytilus
 Influence of wave action on Mytilus californianus mussel beds By Jaclyn Mann Biological Sciences Department College of Science and Mathematics California Polytechnic State University San Luis Obispo June
Duwamish Waterway Self Guided Tour: Turning Basin Number Three and Terminal 105 Aquatic Habitat Restoration Sites
 Duwamish Waterway Self Guided Tour: Turning Basin Number Three and Terminal 105 Aquatic Habitat Restoration Sites Text and illustrations in the following pages include: (1) summary information describing
Mississippi Coastal Improvements Program (MsCIP) Comprehensive Barrier Island Restoration Plan
 Comprehensive Barrier Island Restoration Plan") Mississippi Coastal Improvements Program (MsCIP) Comprehensive Barrier Island Restoration Plan BOEM Gulf of Mexico Sand Management Working Group October, 205 Justin McDonald, P.E. US Army Corps of Engineers
Mississippi Coastal Improvements Program (MsCIP) Comprehensive Barrier Island Restoration Plan BOEM Gulf of Mexico Sand Management Working Group October, 205 Justin McDonald, P.E. US Army Corps of Engineers
Bonner Bridge: Ensuring Connectivity and Resilience on North Carolina's Coastal Barrier Islands
 Bonner Bridge: Ensuring Connectivity and Resilience on North Carolina's Coastal Barrier Islands This article discusses how the North Carolina Department of Transportation is incorporating a unique coastal
Administration Division Public Works Department Anchorage: Performance. Value. Results.
 Administration Division Anchorage: Performance. Value. Results. Mission Provide administrative, budgetary, fiscal, and personnel support to ensure departmental compliance with Municipal policies and procedures,
Gulf of Mexico Program
 Gulf of Mexico Program Gulf of Mexico Program Mission Protect, restore, and maintain the Gulf of Mexico in ways consistent with the economic well-being of the region Committed to voluntary, non-regulatory
Ai Ning Loh Curriculum Vitae
 Ai Ning Loh Curriculum Vitae Assistant Professor of Marine Science Florida Gulf Coast University Phone: (239) 590-7261 College of Arts and Sciences Fax: (239) 590-7200 Division of Ecological Studies Email:
Biodiversity. The UNIVERSITY of OKLAHOMA
 Biodiversity The UNIVERSITY of OKLAHOMA Authors Paul Sandifer, PhD Director, Center for Coastal Environmental and Human Health Lee Bundrick Graduate Assistant, Stacey Weinstock Graduate Assistant, Susan
Oyster Culture. Vanessa Weldon extension
 Oyster Culture Vanessa Weldon extension vmaxwell24@gmail.com Overview Biology Lifecycle Hatchery Nursery Grow-out methods Extensive Intensive Advances in culture techniques Issues facing the oyster industry
Optimal Investment in Ecological Conservation and Restoration Projects under Climate Change: A Spatial Intertemporal Analysis
 Optimal Investment in Ecological Conservation and Restoration Proects under Climate Change: A Spatial Intertemporal Analysis Koel Ghosh James S. Shortle Pennsylvania State University Carl Hershner Virginia
Climate Change and Oysters in the Chesapeake Bay
 Climate Change and Oysters in the Chesapeake Bay Roger Mann and Ryan Carnegie Virginia Institute of Marine Science Gloucester Point, VA 23062 presentation to STAC, Development of Climate Projections for
Alternative Filter Media for Potable Water Treatment
 Alternative Filter Media for Potable Water Treatment M.E. Steele*, M.J. Chipps*, R. Bayley*, A. Mikol** & C.S.B. Fitzpatrick** * Thames Water Research & Development ** Department of Civil & Environmental
CERP System Status Reports The Evolution from
 CERP System Status Reports The Evolution from 2006-2009 Eliza Hines 22 July 2009 Everglades Restoration Comprehensive Everglades Restoration Plan (CERP) 18,000 sq mile ecosystem Everglades & South Florida
HYPOXIA Definition: ~63 µm; 2 mg l -1 ; 1.4 ml l -1 ; 30 %
 HYPOXIA Definition: ~63 µm; 2 mg l -1 ; 1.4 ml l -1 ; 30 % Consequences of hypoxia Reduce habitat for living resources Change biogeochemical processes P released from sediments Denitrification reduced
Aquatic Communities Aquatic communities can be classified as freshwater
 Aquatic Communities Aquatic communities can be classified as freshwater or saltwater. The two sets of communities interact and are joined by the water cycle. Gravity eventually returns all fresh water
Observing the Ocean. A series of activities that demonstrate how scientists study the ocean through modern technology
 Observing the Ocean A series of activities that demonstrate how scientists study the ocean through modern technology Objective Students investigate the many uses of ocean observing systems and how the
Coastal Restoration and Protection Projects - SLFPA-East and Vicinity
 Coastal Restoration and Protection Projects - SLFPA-East and Vicinity committed to our coast committed to our coast 2012 Master Plan Project Details 2012 Master Plan Projects in SLFPA-East Projects in
Natural Flood Management. Measures & Multiple Benefits. Steve Rose (JBA)
") Natural Flood Management Measures & Multiple Benefits Steve Rose (JBA) Definitions Natural Flood Management - NFM (SEPA): A range of techniques that aim to reduce flooding by working with natural features
Natural Flood Management Measures & Multiple Benefits Steve Rose (JBA) Definitions Natural Flood Management - NFM (SEPA): A range of techniques that aim to reduce flooding by working with natural features
The Currituck Sound Array: Introducing a new estuarine field site and test bed for Corps research. RSM Webinar, 18 February 2016
 The Currituck Sound Array: Introducing a new estuarine field site and test bed for Corps research. RSM Webinar, 18 February 2016 Heidi M. Wadman, Patrick J. Dickhudt U.S. Army Research and Development
Student Exploration: Coral Reefs 1 Abiotic Factors
 Name: Date: Per. Student Exploration: Coral Reefs 1 Abiotic Factors Vocabulary: consumer, coral, coral bleaching, coral reef, filter feeder, food chain, food web, grazer, nutrients, ocean acidification,
Department of the Army Permit Application
 Department of the Army Permit Application DA File Number U.S. Army Corps of Engineers Honolulu District Date Received by CEPOH-RO Send Completed Application to: Honolulu District, U.S. Army Corps of Engineers
Coastal Texas Protection and Restoration Project
 Coastal Texas Protection and Restoration Project Sharon Tirpak / Sheridan Willey / Janelle Stokes Project Management / Planning / Environmental USACE, Galveston District August 2014 US Army Corps of Engineers
The Importance of the Pearl River to Mississippi s Estuarine Habitats Jennifer Buchanan Education Coordinator
 The Importance of the Pearl River to Mississippi s Estuarine Habitats Jennifer Buchanan Education Coordinator 2006 Pearl River Basin Symposium May 5-6, 2006 Topics for Discussion What s an estuary? Pearl
The State of Everglades Restoration
 FCE-LTER All Scientist Meeting The State of Everglades Restoration Fred H. Sklar 14 March 2016 Deering Estate Restoration Update Outline 1. Reservoirs, STAs & FEBs 2. Broward WPA s 3. DPM 4. MFL & Seagrass
ESTUARY LESSON PLAN Eyes on the Estuaries
 Eyes on the Estuaries Lesson Plan ESTUARY LESSON PLAN Eyes on the Estuaries Focus Monitoring Living Resources in Estuaries Grade Level 9-12 Focus Question How can we monitor and compare living resources
Vibrio parahaemolyticus Control Plan
 Vibrio parahaemolyticus Control Plan June 1 August 31, 2017 New Jersey Department of Environmental Protection Division of Water Monitoring and Standards / Division of Fish & Wildlife and New Jersey Department
Natural and anthropogenic impact at the East Frisian coast - last 1000 years and future perspectives
 Natural and anthropogenic impact at the East Frisian coast - last 1000 years and future perspectives Alexander Bartholomä Senckenberg Institute Past: Present: Future: Past, Present and Future - development
COMPARISON OF GEOSYNTHETIC MATERIALS AS SUBSTRATES ON COASTAL STRUCTURES GOLD COAST (AUSTRALIA) AND ARABIAN GULF
 AND ARABIAN GULF") COMPARISON OF GEOSYNTHETIC MATERIALS AS SUBSTRATES ON COASTAL STRUCTURES GOLD COAST (AUSTRALIA) AND ARABIAN GULF Bobbie Corbett 1, L. Angus Jackson 1, Timothy Evans 1 and Simon Restall 2 Coastal structures
COMPARISON OF GEOSYNTHETIC MATERIALS AS SUBSTRATES ON COASTAL STRUCTURES GOLD COAST (AUSTRALIA) AND ARABIAN GULF Bobbie Corbett 1, L. Angus Jackson 1, Timothy Evans 1 and Simon Restall 2 Coastal structures
Spreading Dead Zones and the Consequences for Marine Ecosystems
 Spreading Dead Zones and the Consequences for Marine Ecosystems The most serious threat from eutrophication (an increase in the concentration of chemical nutrients in an ecosystem to an extent that increases
(1)(A)Inventory of the following existing natural resources on the USFSP Campus or within the context area adjacent to the University.
(A)Inventory of the following existing natural resources on the USFSP Campus or within the context area adjacent to the University.") 13. 6C-21.208 CONSERVATION ELEMENT Information Sources George F. Young, Interview notes, June 2002 Sasaki Associates, Inc., interview notes, April, 2000 Interviews between DRMP Staff and USF Staff, May,
13. 6C-21.208 CONSERVATION ELEMENT Information Sources George F. Young, Interview notes, June 2002 Sasaki Associates, Inc., interview notes, April, 2000 Interviews between DRMP Staff and USF Staff, May,
The Coastal Barrier Island Network (CBIN): Management Strategies for a Global Change Future
: Management Strategies for a Global Change Future") The Coastal Barrier Island Network (CBIN): Management Strategies for a Global Change Future William K. Smith, Department of Biology, Wake Forest University Coastalbarrierisland.org Global Distribution
The Coastal Barrier Island Network (CBIN): Management Strategies for a Global Change Future William K. Smith, Department of Biology, Wake Forest University Coastalbarrierisland.org Global Distribution
Science Plan. Executive Summary. Introduction
 Science Plan Executive Summary This Science Plan will establish and define the focus of the Peninsular Florida Landscape Conservation Cooperative (PFLCC) science investments. The data and products derived
Why Care About Impacts to Natural Systems? Using Ecosystem Functions, Goods, and Services to Scale Changes to
 Why Care About Impacts to Natural Systems? Using Ecosystem Functions, Goods, and Services to Scale Changes to Nearshore Ecosystems in Puget Sound Curtis D. Tanner, U.S. Fish and Wildlife Service Miles
Climate: describes the average condition, including temperature and precipitation, over long periods in a given area
 Ch. 6 - Biomes Section 6.1: Defining Biomes Biome: a group of ecosystems that share similar biotic and abiotic conditions, large region characterized by a specific type of climate, plants, and animals
Climate Change. Weather Patterns and Drinking Water Resources. WE CArE AbouT WATEr. IT s WHAT WE do.
 WE CArE AbouT WATEr. IT s WHAT WE do. Climate Change Weather Patterns and Drinking Water Resources Grade Level: 9-12 objective: Students will explore the potential impacts of climate change on drinking
School of Fisheries, Aquaculture and Aquatic Sciences
 School of Fisheries, Aquaculture and Aquatic Sciences 1 School of Fisheries, Aquaculture and Aquatic Sciences Fisheries science combines a general foundation in chemistry, mathematics and biological sciences
Current Trends in Marina Planning and Design
 ASSOCIATION OF PACIFIC PORTS 101 st Annual Conference, July 2014 Current Trends in Marina Planning and Design, PE, LEED AP, Reid Middleton Outline Introduction Market & Demand Planning Environmental Design
Rocky Intertidal Ecology
 Rocky Intertidal Ecology The Rocky Intertidal program at the Hatfield Marine Science Center is designed to be a 50-minute inquiry-based program that examines the dynamic environment of rocky shores and
Schedule for Big Bend Oyster Restoration Meeting. 11 April 2011 Florida Wildlife Research Institute Lab SW 153 rd Ct, Cedar Key, Florida
 Schedule for Big Bend Oyster Restoration Meeting 11 April 2011 Florida Wildlife Research Institute Lab 11350 SW 153 rd Ct, Cedar Key, Florida 0900 Meet at Florida Wildlife Research Institute Lab. This
Atlantic Coast of New York East Rockaway Inlet to Rockaway Inlet and Jamaica Bay, NY
 Atlantic Coast of New York East Rockaway Inlet to Rockaway Inlet and Jamaica Bay, NY Draft Reformulation Public Information October 2016 US Army Corps of Engineers Presentation Outline Project Overview
Environmental Literacy Question: How have humans affected the Chesapeake Bay and its watershed?
 Lesson: Land s Wonders and Worries: Pollution Solution Environmental Literacy Question: How have humans affected the Chesapeake Bay and its watershed? Topic/ Essential Question: What characteristics of
Using LIDAR to monitor beach changes: Goochs Beach, Kennebunk, Maine
 Maine Geologic Facts and Localities February, 2010 Using LIDAR to monitor beach changes: Goochs Beach, Kennebunk, Maine 43 o 20 51.31 N, 70 o 28 54.18 W Text by Peter Slovinsky, Department of Agriculture,
F2. Coastal General Coastal Marine Zone
 F2. Coastal General Coastal Marine Zone [The regional coastal plan [rcp] provisions are not operative until the Minister of Conservation has formally approved the regional coastal plan part of the Auckland
Design Features of Constructed Wetlands for Nonpoint Source Treatment. September 1995
 Design Features of Constructed Wetlands for Nonpoint Source Treatment September 1995 Brochure written by William W. Jones, School of Public and Environmental Affairs, Indiana University, Bloomington, Indiana.
Deer Island Aquatic Ecosystem Restoration Project
 ERDC TN-EWN-15-2 Deer Island Aquatic Ecosystem Restoration Project By Jennifer Gerhardt Smith, Justin McDonald, Susan Ivester Rees, and Nathan Lovelace PURPOSE: Implementation of Engineering With Nature
Climate Change, Human Activities, and the State of New Jersey. Michael J. Kennish Institute of Marine and Coastal Sciences Rutgers University
 Climate Change, Human Activities, and the State of New Jersey Michael J. Kennish Institute of Marine and Coastal Sciences Rutgers University New Jersey Climate and Environmental Change Conclusions from
EVALUATING SOUTH CAROLINA S SHELLFISH MANAGEMENT
 EVALUATING SOUTH CAROLINA S SHELLFISH MANAGEMENT Rebekah J. Walker, NOAA Coastal Management Fellow William D. Anderson, SC Department of Natural Resources Steve Moore, SC Ocean and Coastal Resource Management
Ecology. Limiting factors. Introduction to Marine Ecology. Ecological communities and ecosystems
 Introduction to Marine Ecology Physical limiting factors light, temperature, salinity, nutrients, gases variation within the ocean: depth and geography Marine habitats: where to make a living Marine feeding
Coastal acidification monitoring as part of the monitoring network in Casco Bay
 Coastal acidification monitoring as part of the monitoring network in Casco Bay National Estuary Program Tech Transfer meeting Boston, MA November 3, 2017 Matthew Liebman, US EPA Region 1 Curtis Bohlen,
Project sponsors provided a brief presentation on their project(s), followed by comments from the Committee.
, followed by comments from the Committee.") WRIA 14 Salmon Habitat Recovery Committee Meeting April 17, 2014 Summary notes Project sponsors provided a brief presentation on their project(s), followed by comments from the Committee. Allyn Shoreline
WRIA 14 Salmon Habitat Recovery Committee Meeting April 17, 2014 Summary notes Project sponsors provided a brief presentation on their project(s), followed by comments from the Committee. Allyn Shoreline
Chapter 8: Aquatic Biodiversity
 Chapter 8: Aquatic Biodiversity APES 2013 1 Aquatic Life Zones 71% of the Earth is covered in saltwater 2.2% is freshwater Aquatic life zones are the equivalent of biomes Two major types: saltwater (marine)
MIKE 21/3 FLOW MODEL HD FM
 MIKE 21/3 FLOW MODEL HD FM 2D and 3D hydrodynamic modelling using flexible mesh DHI/Photo Simon Mortensen, DHI-AUK component will teach you the fundamentals of 2D and 3D hydrodynamic modelling (HD) and
Science Lesson 18: Building a Tabletop Bioremediation System (TBS)
") Science Lesson 18: Building a Tabletop Bioremediation System (TBS) Hawaii DOE Content Standards: Science standards: All* (See A Note to HCPSIII Science Standards at end of lesson.) Key concepts: Cycles
Science Lesson 18: Building a Tabletop Bioremediation System (TBS) Hawaii DOE Content Standards: Science standards: All* (See A Note to HCPSIII Science Standards at end of lesson.) Key concepts: Cycles
Assessing Natural Resource Impacts from the Enbridge Pipeline Spill into the Kalamazoo River
 Assessing Natural Resource Impacts from the Enbridge Pipeline Spill into the Kalamazoo River Stephanie Millsap, Lisa Williams, and Joseph Haas - U.S. Fish & Wildlife Service Sharon Hanshue and Jay Wesley
Overview of Dredged Material Testing and Evaluation
 Overview of Dredged Material Testing and Evaluation Jeffery Steevens US Army Corps of Engineers Engineer Research and Development Center 23 July 2012 Guidance Documents for Management of Dredged Material
Virginia s Comprehensive Wetland Program Plan
 Summer 2011, Vol. 6, No. 2 In this issue: Virginia s Comprehensive Wetland Program Plan Virginia has a newly approved Wetland Program Plan (WPP). Virginia developed a wetland plan to assess current management
TIMELY INFORMATION Agriculture & Natural Resources
 FISHERIES & AQUACULTURE SERIES TIMELY INFORMATION Agriculture & Natural Resources OFF-BOTTOM OYSTER FARMING William C. Walton *1,2, Julie E. Davis 2, Glen I. Chaplin 2, F. Scott Rikard 2, Terrill R. Hanson
MARINE POLLUTION DEGRADATION MITIGATION MANAGEMENT IS ESSENTIAL FOR IMPROVING MARINE ENVIRONMENT
 MARINE POLLUTION DEGRADATION MITIGATION MANAGEMENT IS ESSENTIAL FOR IMPROVING MARINE ENVIRONMENT The health of the world s oceans and marine life is degrading rapidly as a result of excess human activities.
Climate-Informed Water Resources in the Southeast United States. Rachel M. Gregg June 2015
 Climate-Informed Water Resources in the Southeast United States Rachel M. Gregg June 2015 Responding to Climate Change Mitigation is what we do to decrease the potential of climate change itself. Adaptation
NEW RIVER INLET CHANNEL REALIGNMENT PROJECT UPDATE NOVEMBER 1, 2012
 NEW RIVER INLET CHANNEL REALIGNMENT PROJECT UPDATE NOVEMBER 1, 2012 Construction Schedule Preconstruction Conference Nov. 13 @ Town Hall Dredge Arrives Nov. 15 th Sand Placement Begins Nov. 17 th Dredging