NASA Goddard Institute for Space Studies, New York, NY 10025, USA. Northeast States for Coordinated Air Use Management, Boston, MA 02111, USA
|
|
|
- Hugo Barton
- 6 years ago
- Views:
Transcription
1 Sensitivity of air quality to potential future climate change and emissions in the United States and major cities M. Trail 1, A.P. Tsimpidi 1, P. Liu 1, 2, K. Tsigaridis 3, 4, J. Rudokas 5, P. Miller 5, A. Nenes 2, 6, Y. Hu 1 and A.G. Russell 1 1 School of Civil & Environmental Engineering, Georgia Institute of Technology, Atlanta, GA 30332, USA 2 School of Chemical and Biomolecular Engineering, Georgia Institute Technology, Atlanta, GA 30332, USA 3 Center for Climate Systems Research, Columbia University, New York, NY 10025, USA 4 NASA Goddard Institute for Space Studies, New York, NY 10025, USA 5 Northeast States for Coordinated Air Use Management, Boston, MA 02111, USA 6 School of Earth & Atmospheric Sciences, Georgia Institute of Technology, Atlanta, GA 30332, USA Abstract Simulated present and future air quality is compared for the years and over the contiguous United States (CONUS) using the Community Multi-scale Air Quality (CMAQ) model. Regionally downscaled present and future climate results are developed using GISS and the Weather Research Forecasting (WRF) model. Present and future emissions are estimated using MARKAL 9R model. O 3 and PM 2.5 sensitivities to precursor emissions for the years 2010 and 2050 are calculated using CMAQ-DDM (Direct Decoupled Method). We find major improvements in future U.S. air quality including generally decreased MDA8 (maximum daily 8-hr average O 3 ) mixing ratios and PM 2.5 concentrations and reduced frequency of NAAQS O 3 standard exceedances in most major U.S. cities. The Eastern and Pacific U.S. experience the largest reductions in summertime seasonal average MDA8 (up to 12 ppb) with localized decreases in the 4 th highest MDA8 of the year, decreasing by up to 25 ppb. Results from a Climate Penalty (CP) scenario isolate the impact of climate change on air quality and show that future climate change tends to increase O 3 mixing ratios in some regions of the U.S., with climate change causing increases of over 10 ppb in the annual 4 th highest MDA8 in Los Angeles. Seasonal average PM 2.5 decreases (2 to 4 µg m -3 ) over the Eastern U.S. are accounted for by decreases in sulfate and nitrate concentrations resulting from reduced mobile and point source emissions of NO X and SO X. 1
2 Introduction Regional air quality impacts public health [Ito et al., 2005; Lim et al., 2012; Murray et al., 2013; Zhou et al., 2011], visibility and ecosystem health [Likens et al., 1996; Mauzerall and Wang, 2001], and is significantly affected by changes in climate, land use and pollutant emissions [Weaver et al., 2009]. Predictions of regional air quality responses to such changes can help inform policy makers in the development of effective approaches to both reduce greenhouse gases and improve air quality. However, major sources of uncertainty exist in predicting future air quality including limitations in the tools used to project future emissions, land use changes and uncertainties associated with predicting future climate. Recently, technical advances in downscaling global climate simulations to regional scales, and, the development of bottom-up operational tools used to forecast emissions have enhanced our ability to account for the complex interactions between population, socio-economic development, technological change, and federal and regional environmental policies [EPA, 2012; Liu et al., 2012]. In this paper, we address the potential impacts of changing climate and emissions on regional PM 2.5 and O 3 levels in the U.S., focusing on major cities, by applying recent downscaling and emissions projection techniques to inputs of a chemical transport model. There is a consensus among most studies that future climate change, alone, would lead to an increase in O 3 concentrations over significant regions of the U.S. due to increased temperatures, surface insolation, stagnation, and biogenic VOC emissions [Mickley et al., 2004; Weaver et al., 2009]. Potential impacts of climate on PM 2.5 over the U.S. are more variable and likely small [Jacob and Winner, 2009]. Recent scientific efforts include investigating the effect of projected emissions changes on future air quality [Brown et al., 2013; Fann et al., 2013; Liao et al., 2007; Nolte et al., 2008; Tagaris et al., 2007]. Tagaris et al. [2007] used the Community Multiscale Air Quality (CMAQ) model with inputs of downscaled future climate [Leung and Gustafson, 2005] and emissions projected to the near future (2020) using the Clean Air Interstate Rule (CAIR) emissions inventory and to the more distant future (2050) using the Integrated Model to Assess the Global Environment (IMAGE). They find reductions of maximum daily 8-hr average (MDA8) O 3 mixing ratios over most of the U.S. and reductions in sulfate, nitrate and ammonium concentrations in aerosols, causing organic carbon to be the most abundant species in aerosols in Liao et al. [2007] expanded on the work of Tagaris et al. [2007] by calculating the present and future sensitivities of O 3 and particulate matter to emissions using CMAQ-DDM (Direct Decoupled Method). Nolte et al. [2008] also use the CMAQ model with inputs of downscaled future 2
3 climate from Leung and Gustafson [2005] and emissions projected from the 2001 National Emissions Inventory (NEI) according to the Asian Pacific Integrated Model (AIM) to compare recent ( ) and future ( ) O 3 levels over the U.S. This study predicted that decreases in O 3 precursor emissions lead to decreased MDA8 mixing ratios over large regions of the U.S. despite the tendency for future climate to increase MDA8 levels. Fann et al. [2013] use the Comprehensive Air Quality Model with Extensions (CAMx) photochemical model to estimate recent and future health burdens of air pollution attributable to U.S. anthropogenic emissions sectors. They projected the 2005 NEI to 2016 and found marked decreases in the health burdens associated with electricity generating units (EGU) and mobile sources due to the implementation of current emissions regulations. Some recent studies have investigated the feedbacks of changing aerosol concentrations to climate on a global scale [Leibensperger et al., 2012a; b; Ramanathan et al., 2001; Shindell et al., 2012]. These studies agree that changes in global scale radiative forcing from aerosols can significantly impact global climate. However, Leibensperger et al. [2012] conclude that climate change associated with changes in aerosol radiative forcing from U.S. emissions has already been realized and that future decreases in U.S. emissions will only have a small impact on future climate change associated with aerosols. In light of this research, the present study focuses on the impact of changing emissions and climate on air pollutants in the U.S. and does not consider global scale feedbacks of future aerosol concentrations on climate. This study takes advantage of recent technological advances in climate and emissionprediction modeling to simulate the response of future regional air quality in the U.S. to changes in climate and emissions. We employ several methods to improve upon the methods presented in Tagaris et al. [2007] and Liao et al. [2007]. We use spectral nudging to downscale global climate simulations [Liu et al., 2012; Trail, 2013]. We also use detailed emissions projections from the MARKAL 9R (MARKet ALlocation 9 Region) model [EPA, 2012; Fishbone et al., 1980; Loughlin et al., 2011], and use the Direct Decoupled Method (DDM) to calculate sensitivities of pollutants to precursor emissions. Liu et al. [2012] identified the benefit of using spectral nudging to downscale global meteorology in that using spectral nudging maintains the small-scale meteorological features driven by local topography while preserving large-scale forcings. The MARKAL energy system model responds to prescribed demand for regionally based energy services (in this case, energy required to meet the associated energy service demands of the residential, commercial, industrial and transportation sectors) and selects from available technologies to select the least-cost path which satisfies the specified demands. MARKAL is a flexible modelling framework that 3
4 considers mid-to-long-term technology choices that aim to reshape an energy system to meet specific environmental (or other) goals. The model also allows the implications of specific policy options to be examined and compared. In the present study, we use the CMAQ model to compare present and simulated future air quality for the years and over the contiguous United States. Inputs to CMAQ include the regionally downscaled present and future climate results developed using GISS and the Weather Research Forecasting (WRF) model from Trail et al. [2013], as well as, emissions processed using the Sparse Matrix Operator Kernel Emissions (SMOKE) model [CEP, 2003]. Emissions inventories are projected to future year levels using the MARKAL 9R model [Loughlin et al., 2011]. We also use CMAQ-DDM to calculate O 3 and PM 2.5 sensitivities to precursor emissions for the years 2010 and Results from a Climate Penalty (CP) scenario are also presented here in order to isolate the impact of climate change on air quality for comparison to past studies (e.g.; Weaver et al. [2009] and Nolte et al. [2008]). Present PM 2.5 and O 3 simulated concentrations are evaluated using in situ measurements. We also investigate and discuss the impacts of climate and emissions changes on air quality in major U.S. cities. 2. Model Approach Air pollutant concentrations and sensitivities are simulated using a chemical transport model with inputs from emissions and meteorological models. Meteorological inputs were downscaled from a Global Circulation Model (GCM) to the regional scale using a regional climate model as described in Trail et al. (2013). The components of the modeling system are described below along with an evaluation of the chemical transport model. 2.1 Global Climate The Goddard Institute for Space Studies (GISS) ModelE2 is used to provide base global scale meteorological fields which are used as initial and boundary conditions to the regional climate model [Schmidt et al., 2013]. As used, the model has a Cartesian grid point formulation with horizontal resolution of 2 o 2.5 o latitude by longitude. The vertical discretization has 40 layers and follows a sigma coordinate up to 150 hpa and constant pressure layers between 150 and 0.1 hpa. Simulations are carried out for years , and, with a 3 year spin-up time starting either from 2003 or 2045, are driven by future atmospheric conditions over the 21 st century and follow the scenario development process for IPCC AR5. The Representative Concentration Pathway (RCP) 4.5 [Lamarque et 4
5 al., 2011; Moss et al., 2010] is used for this study, which is a scenario of decadal global emissions of greenhouse gases, short-lived species, and land-use-land-cover producing a 4.5 W m 2 anthropogenic radiative forcing (corresponding to 650 ppm CO 2 -equivalent) in the year Outputs of physical parameters were produced at 6-hr intervals for regional downscaling by WRF (section 2.2). 2.2 Regional Climate The regional climate model used is the non-hydrostatic Weather Research and Forecasting (WRF) Model [Skamarock and Klemp, 2008] version 3.4. Simulations were carried out for years and with a 10 day spin-up time period. The model domain covers the contiguous United States (CONUS) and portions of southern Canada and northern Mexico and is centered at 40 N and 97 W with dimensions of horizontal grid cells with a grid-spacing of 36 km. It contains 35 vertical levels, with the top pressure of 50hPa. The model scheme configuration is as follows: the long-wave Rapid Radiative Transfer Model (RRTM) [Mlawer et al., 1997] and Dudhia scheme [Dudhia, 1989] are used for longwave and shortwave radiation respectively; the Yonsei University (YSU) [Hong et al., 2006] scheme is used for the planetary boundary layer; the Noah scheme [Ek et al., 2003] is used for the land surface model (LSM); a revised version of the Kain-Fritsch scheme [Kain and Fritsch, 1993] is used to represent the effects of both deep and shallow cumulus clouds; and Lin et al. [Lin et al., 1983] is chosen for cloud microphysics. Spectral nudging is applied to temperature, horizontal winds, and geopotential heights with a wave number of 3 in both zonal and meridional directions at 6 hour intervals [Liu et al., 2012]. Only horizontal winds are nudged at all vertical levels, while no nudging is conducted for other variables within the planetary boundary layer (PBL). The ability of GISS-WRF to reproduce the long-term yearly climatic means and the meteorological fields that strongly impact air quality are evaluated in Trail et al. (2013). Trail et al. [2013] found that the distribution of model predictions agree well with observations when conducted for Emissions Hourly, gridded and speciated emissions are generated for input to CMAQ using the Sparse Matrix Operator Kernel Emissions (SMOKE V3) model [CEP, 2003] based on the 2005 National Emissions Inventory (NEI) and ancillary data which include temporal, spatial and chemical allocation of emissions according to source category. Spatial surrogates (e.g., population and landuse distributions) are used to allocate the NEI s county-level emissions to 5
6 the modeling gridded domain. The Biogenic Emissions Inventory System (BEIS) and Biogenic Emissions Landcover Database 3.0 (BELD3) are used here to compute hourly emissions from U.S. vegetation. The resulting inventory consists of pollutants emitted from area, mobile, point, fire, ocean, biogenic, agricultural and other sources. NEI 2005 energy related emissions are projected to the years 2010 and 2050 using factors calculated by the EPA MARKAL 9R model. MARKAL 9R [EPA, 2012; Fishbone et al., 1980; Loughlin et al., 2011] models the energy system of the nine Census Divisions of the U.S. and estimates future energy dynamics. Future emissions projections were calculated assuming the implementation of the following policies: Clean Air Act Title IV (Acid Rain Program) SO 2 and NO X requirements, Clean Air Interstate Rule (CAIR), Utility Mercury and Air Toxics Standards (MATS), aggregated state Renewable Portfolio Standards (RPS) by region, Federal Corporate Average Fuel Economy (CAFE) standards as modeled in AEO 2012, Tier 2 light duty vehicle tailpipe emission standards and heavy duty vehicle fuel and engine rules. Non-energy related emissions were projected according to the Intergovernmental Panel on Climate Change Special Report on Emissions Scenarios [IPCC SRES], using the A1B scenario [Woo et al., 2008]. Fire emissions represent average emissions of a typical year from the 2005 NEI are constant for present and future simulation. The overall emissions rates of CO, NO X and VOC decrease from 2010 levels over all nine regions of the U.S. by 2050 (Tables 1 and 2). Emissions of SO 2 decrease in most regions except East North Central and South Atlantic while primary PM 2.5 emissions increase in the Mid and South Atlantic regions and decrease over the rest of the U.S. Mobile sector emission decreases account for most of the total decreased CO, NO X, VOC and PM 2.5 emissions. Increased emissions of SO 2 and PM 2.5 in some regions are attributed to increased emissions from point sources such as power plants and refineries. Woo et al. [2008] projected large reductions SO 2 from 2001 to 2050 with most of the decreased emissions taking place between 2001 and SO 2 emissions are not projected to decrease much from 2010 to 2050 in the present study because a large portion of the reductions have been realized by Relative reduction of NO X, and VOC emissions, on the other hand, compare well with Woo et al. [2008]. 2.4 Air Quality The Community Multiscale Air Quality Model (CMAQ 4.7.1) [Foley et al., 2010] is used to simulate the transformation and fate of air pollutants for the present ( ) and future years ( ) and for a climate penalty scenario (CP). The climate penalty 6
7 scenario uses future emissions and present climate as inputs to determine the sensitivity of future air quality to the simulated climate change. Gas-phase chemistry is modeled using the SAPRC-99 [Carter, 2000] chemical mechanism. The modeling domain uses a Lambert Conformal Projection centered at 40ºN, 97ºW with true latitudes of 33ºN and 45ºN (Figure 1). The domain uses a 36-km horizontal grid-spacing that covers the entire continental US as well as portions of Canada and Mexico ( horizontal grid cells) with thirteen vertical layers extending ~15.9 km above ground, with 7 layers below 1 km and the first layer is 18 m thick. Boundary conditions are dynamic over the course of a year, although they are held constant between the present and future year simulations in order to isolate the impact of regional climate change and changing emissions on US air quality. The default CMAQ initial conditions are used here and a spin-up period of 10 days is used to minimize the influence of initial conditions. Pollutant sensitivities, S (1) ij, to perturbations in an input parameter (e.g. emission rate, initial condition or boundary condition) are calculated in CMAQ using the Decoupled Direct Method in Three Dimensions DDM-3D: S (1) ij where Ci Pj P j (1) C i is the ambient concentration of species i, and Pj is the unperturbed base case emissions rate of source j. The sensitivities, S ij, are computed for all modeled species over space and time. In CMAQ, DDM-3D uses the same numerical algorithms and operator splitting processes as for calculating concentrations [Napelenok et al., 2006; Yang et al., 1997]. DDM-3D has been successfully integrated into CMAQ and updated to include algorithms for computing particulate matter (PM) sensitivity coefficients. First-order sensitivities are typically accurate for up to 30% perturbations in input parameters [Dunker et al., 2002]. Our focus is on calculating the sensitivities of ambient O 3 and PM, S (1) ij, to total emissions of NO X, SO 2, and VOCs and emissions from mobile, point, and biogenic sources. 3. Results 3.1 Model Evaluation Cumulative distribution functions (CDFs) of observed and modeled PM 2.5 (during 1 January to 31 December, 2010) and maximum daily 8-hr O 3 (MDA8; during 1 May to 30 September, 2010) concentration at observational sites are compared for each of the 9 U.S. 7
8 census regions (Figures S1 and S2). The modeled air quality was not evaluated by comparing observed and modeled pollutant concentrations coupled in space and time because the simulations were driven using boundary conditions from a global climate model rather than reanalysis data. Comparison using CDFs, on the other hand, evaluates the model s ability to capture distributions of pollutant concentrations and enables the evaluation of concentrations of pollutants at the upper and lower tails of the distributions. Pollutant concentrations used in for the evaluation were simulated using 2010 emissions and meteorology (sections ). Observed ambient 2010 O 3 and PM 2.5 concentrations were downloaded from the Environmental Protection Agency (EPA) Air Quality System (AQS) website ( Since present day emissions were projected to the year 2010, evaluations were carried out only for the year In each of the 9 U.S. census regions, modeled MDA8 mixing ratios show good agreement with observations (Figure S1). The Mid-Atlantic and Mountain regions modeled MDA8 agrees best with observations when MDA8 exceeds 60 ppb while modeled MDA8 is biased high at the lower end of the distribution. Modeled MDA8 mixing ratio is biased high in every region with the largest high biases occurring at the lower end of the distributions. Other studies have shown that CMAQ tends to overestimate O 3 on days when O 3 mixing ratios are low [Nolte et al., 2008]. The mean bias (MB) and normalized mean bias (NMB) were also calculated using mean observed and modeled PM 2.5 and O 3 at each site where observations are available (Table S1 and S2) to evaluate the model configuration. Overall the simulated O 3 and PM 2.5 surface concentrations show good agreement with observed concentrations (Tables S1 and S2). Daily max 1-hr and 8-hr O 3 are simulated best during the spring with a small positive bias (NMB<10%). Simulated 1-hr O 3 and 8-hr O 3 also show good agreement with observations during the spring. During summertime, 1-hr and 8-hr O 3 simulations show very little bias (NMB = 0.17 and 1.1 %). However, the model tends to over-predict daily max 1-hr and 8-hr O 3 (NMB = 13% and 25% respectively) during the summer. The distributions of modeled PM2.5 show overall good agreement with observations in the 9 U.S. regions (Figure S2). The model tends to underestimate PM 2.5 concentrations at the upper 99 th percentile of the distributions. The Mountain region shows a large underestimation of PM 2.5 in the upper 90 th percentile of the distribution, which is likely due to the models underestimation of wildfire emissions. Mean bias and normalized mean biases were also calculated for mean PM 2.5 modeled and observed concentrations for four seasons (Table S2). The model tends to be biased low for 24-hr PM 2.5 during winter, spring and 8
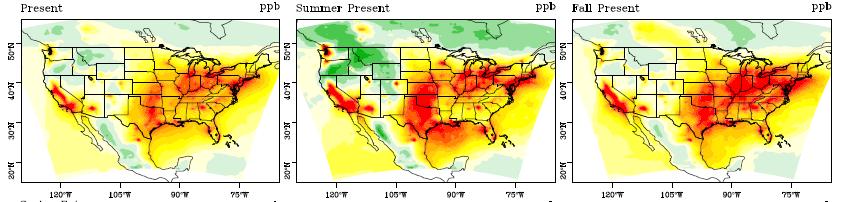
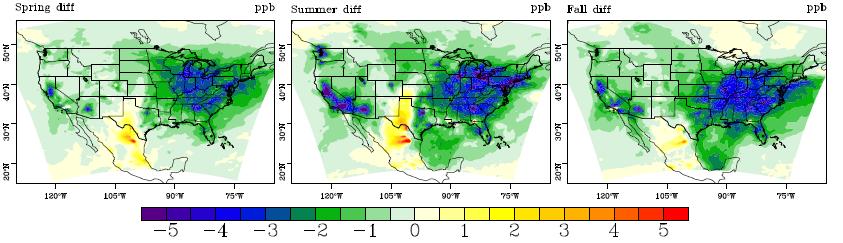
9 summer with the greatest bias occurring during the summer (NMB = -39%). The bias is smaller during winter and spring (NMB = -21% and -23%, respectively) and is the least during the fall (NMB = -1%). 3.3 Surface Ozone The National Ambient Air Quality Standards for O 3 is based on the maximum daily 8- hr average O 3 (MDA8). Currently, an area exceeds the standard if the 4 th highest MDA8 of a year, averaged over three continuous years, is greater than 75 ppb. Health analyses, however, are often based upon longer term exposures (e.g., seasonally or annually averaged changes in daily 8-hr ozone), and may differ between warm and cool seasons, so the analyses here presents both 4 th highest ozone responses, as well as seasonal responses in the MDA8. 5-year seasonal averages of daily MDA8 (SA-MDA8) decrease over most of the U.S during spring (Mar - May), summer (Jun - Aug) and fall (Sep - Nov) (Figure 2). The largest SA-MDA8 decreases of 6-12 ppb occur over the Eastern U.S. and along the Pacific Coast during summer. Average SA-MDA8 also decrease by up to 4 ppb over the Eastern U.S. during spring while increases of up to 3 ppb are simulated over New England and East North Central regions during fall. In part, this is due to decreases in NO X emissions that can lead to increases in ozone on less photochemically active days. A map of the 4 th highest MDA8, averaged over all five present years, shows regions of California, Arizona, and much of the Eastern U.S. with NAAQS exceedances (Figure 3a). In the future simulation, the 4 th highest MDA8 decreases by 15 to 20 ppb in the regions with greatest present day 4 th highest MDA8 (Figure 3c). The climate penalty simulation (CP) isolates the sensitivity of future air quality to climate change from the emission changes by simulating air quality using future emission rates and present climate (Figure 2c). The CP results indicate a climate induced increase in SA-MDA8 mixing ratio of up to 3 ppb in West, South Central, South Atlantic, Mid Atlantic, and New England regions during the summer. Climate also induces increases up to 10 ppb in the 4 th highest MDA8 of the year over southern California, the southern Mountain region, Texas, and some portions of the South and Mid-Atlantic regions (Figure 3b and 3c). Increased MDA8 in the CP scenario means that efforts directed at improving O 3 air quality will be less effective with climate change than without. Using the same two 5-year meteorological datasets as in this study, Trail et al. [2013] examined the changes in meteorological trends related to air quality and predicted increased O 3 mixing ratio in Texas during the summer and in most of the U.S. during fall. Similarly, Leung and Gustafson 9
10 [2005] used downscaled meteorology and predicted worsening air quality over Texas during summer due to increased temperature and stagnation and Nolte et al. [2008] confirmed their results. The CP simulation results also show increased MDA8 mixing ratio during the spring over most of the U.S. except West North Central U.S. and increases during fall in Pacific and Eastern regions which indicates that the O 3 season is extending into spring and fall (Figure 2c). Climate change causes an increase in the 4 th highest MDA8 of up to 10 ppb in Texas, the Mountain region, the Southern Pacific region and in the Mid-Atlantic (Figure 3c). The largest increases in 4 th highest MDA8 occur over Los Angeles, with increases exceeding 10ppb. Cumulative distribution plots of urban MDA8 show changes in the frequency of extreme O 3 events and exceedances in major cities that are representative of various regions of the U.S. (Figure 4). The upper 95 th percentile MDA8 decreases in all cities analyzed except Los Angeles. A localized increase in summertime MDA8 occurs over Los Angeles and, like the Northeast during the fall, is caused by a future decrease in O 3 titration by NO X emissions from mobile sources (Figure 5). Similar localized patterns of increased MDA8 occur during the spring and fall in other urban areas. Atlanta experiences the greatest decrease in the upper 95 th percentile MDA8 from 85 ppb to 68 ppb. The percentile above which MDA8 mixing ratios are greater than 75 ppb indicates the frequency of MDA8 exceedances of the current standard for a particular year. In Atlanta, the frequency of MDA8 exceedances of 75 ppb decreases from just over 10% to around 1% of the year. Future MDA8 exceeds 75 ppb 2 3% less of the year than present day in Chicago and 3 5% less of the year in New York and Philadelphia. Seattle present day MDA8 rarely exceeds the standard and no future exceedances were simulated. In Phoenix, simulated MDA8 exceeds 75 ppb up to 20% of the year while future MDA8 exceeds 75 ppb between 2 and 10%. The cumulative distribution of the CP scenario shows that future MDA8 exceedances under present day climate would be less frequent than those under the predicted future climate in all cities except Seattle and Chicago given the same level of anthropogenic emissions. Climate penalty results indicate that most of the future MDA8 reductions result from emissions changes. CMAQ-DDM results show that during present day summers, the SA- MDA8 sensitivity to emissions of NO X is from 5-20 ppb over the U.S. with the highest sensitivities in the Eastern U.S. and along the southern Pacific region (Figure 5a). In other words, a 10% reduction in NO X emissions would result in a 0.5 to 2 ppb decrease in the annual average MDA8 in the Eastern U.S. The summertime MDA8 sensitivity to NO X experiences little change between the present and future simulation. The MDA8 sensitivity to NO X emissions from mobile sectors, however, decreases in the future in regions with high 10
11 NO X sensitivity with the largest decreases exceeding 8 ppb (Figure 5b). The decreased MDA8 sensitivity to mobile NO X corresponds to decreases in NO X from the mobile sector. Interestingly, New England, East North Central, and Mid-Atlantic regions are characterized by a negative present day sensitivity of average MDA8 to emissions of NO X during fall which indicates the titration of O 3 by NO X. Future reductions in mobile NO X emissions in those regions leads to less titration of O 3 and therefore higher average MDA8 mixing ratios seen in the Northeast during the fall (Figure 5). The sensitivity of MDA8 to VOC also decreases during spring, summer and fall in Eastern and Pacific regions by up to 5 ppb between 2010 and 2050 (Figure 5c). Although mobile VOC emissions are reduced in the future, the sensitivity of MDA8 to mobile VOC emissions does not undergo much change in the future; rather most of the change in sensitivity occurs in the sensitivity to biogenic emissions of VOC (Figures S3 and S4). The change in MDA8 sensitivity to VOC is due to decreased NO X emissions, causing these regions to become more NO X -limited. 3.4 Fine Particulate Matter (PM 2.5 ) Understanding the response of PM 2.5 concentration and composition becomes important and complex in the face of changing climate and emissions rates. In the U.S., PM 2.5 is typically composed of sulfate (SO 4 ), organic matter (OM), elemental carbon (EC), nitrate (NO 3 ), ammonium (NH 4 ), and other components. PM 2.5 comes from both primary emissions and secondary production and undergoes complex chemistry and transport in the atmosphere. Total annual average PM 2.5 tends to decrease with future emissions and climate change with the greatest decreases in the Eastern U.S. ranging from 1 3 µg m -3 (Figure 6). During winter, PM 2.5 decreases of 1 3 µg m -3 occur in the New England and West North Central regions. Nitrate aerosol concentration decreases along with the sensitivity of PM 2.5 to emissions of NO X (Figures 7b and 8). OM and EC concentration changes show similar spatial patterns in the Northeast during winter corresponding to further decreases in PM 2.5 from regionally decreased emissions of primary PM 2.5 from mobile sources (Figure S5a and b). EC decreases during the entire year over Northeastern U.S. and the Pacific region, with the exception of some localized increases, corresponding to reductions in primary PM from mobile and area sources. Sulfate aerosol increases during winter in East North Central are caused by increased emissions of SO X from point sources in the region (Figures 7a and S6). While wintertime PM 2.5 decreases occur in the Northeastern regions, the CP simulation shows that, in the absence of reduced emissions, climate change would lead to PM 2.5 increases in the region (Figure 6c). Also, in Texas, wintertime PM 2.5 increases of up to 11
12 µg m -3 are caused by climate change in the region. Summertime PM 2.5 decreases of µg m -3 span the Eastern U.S. and share similar spatial patterns as decreased concentration of sulfate aerosol and reduced sensitivity of PM 2.5 to emissions of total SO X and SO X from point sources. Along with decreased emissions of SO X from point sources, climate change also contributes to decreased PM 2.5 in the region except along the Atlantic Coast where increases of up to 1 µg m -3 develop (Figure 6c). Decreased summertime PM 2.5, especially over the eastern US, likely results from increased temperatures as well as decreased stagnation [Trail, 2013]. Increased temperature leads to lower concentrations of organic carbon and ammonium nitrate aerosol resulting from increased gas phase partitioning of these compounds. Further, the number of summertime stagnation days decreases over the most of the eastern US, leading to reduced aerosol concentrations. While increased temperature reduces the concentrations of secondary aerosol species (e.g. from biogenic VOCs), decreased stagnation leads to decreased secondary and primary aerosol species (e.g. elemental carbon). Increased summertime PM 2.5 concentrations over Georgia and the Carolinas result from a lower planetary boundary layer (PBL) height. Changes in the PBL height also result in increased wintertime PM 2.5 over the eastern US. 4. Summary and Conclusions In the present study, we determine the potential impact of changing climate and emissions on future ambient O 3 and PM 2.5 in the U.S. Present and future emissions were estimated using the NEI and MARKAL-9R. In comparing the impact of present and potential future climate and emissions changes on air quality, we find major improvements in future U.S. air quality including generally decreased MDA8 mixing ratios and PM 2.5 concentrations and reduced frequency of NAAQS O 3 standard exceedances in most major U.S. cities. Reductions in mobile and point source emissions account for reduced PM 2.5 concentrations while climate change reinforces the reduced concentrations in some regions during the spring, summer and fall. Increased temperatures and decreased stagnation leads to decreased summertime PM 2.5 concentrations. Tagaris et al. [2007] also found that increased temperature lead to reduced summertime PM 2.5 in their simulations. However, the same study found some increased PM 2.5 as a result of increased stagnation. In some regions, e.g. the East Coast, emissions reductions are necessary to overcome the climate change induced increases in PM 2.5. Future decreases in MDA8 mixing ratio are mainly attributed to decreased emissions rate of VOC and NO X from mobile sources. Even though reductions are predicted to occur in the future from current efforts, the CP scenario of future emissions with present meteorology 12
13 indicates that the extent of air quality improvement is less due to predicted climate change. In other words, present emission reduction efforts will lead to less O 3 in the future, but these efforts will be less effective with climate change than without. This means additional costs due to climate change because deeper emission reductions will be required to compensate for a warmer climate, even if current efforts are predicted to show improvement. The sensitivity results agree well with the results presented by Liao et al. [2007]. Both studies find that reduced NO X emissions lead to lower MDA8 O 3 concentrations and that reduced SO X emissions lead to lower PM 2.5 concentrations. Both studies also note that future PM 2.5 is more highly sensitive to biogenic VOC emissions. While most U.S. cities potentially exceed the MDA8 NAAQS standard less frequently in the future, decreased titration of O 3 by NO X could increase the frequency of exceedances in Los Angeles and increase spring and fall average MDA8 mixing ratio in other urban areas. However, as these cities become more NO X -limited, further reductions in NO X emissions in these urban environments will lead to reduced levels of O 3. While there are uncertainties in current and future emissions estimates, and uncertainties in climate, emissions sensitivities can be used to determine the major sources of O 3 and PM 2.5 and the current modeling platform can be used to isolate the effects of climate on air quality. Further, the MARKAL 9R model can be used to develop a range of alternative policy based emissions scenarios to address the uncertainties associated with estimating future emissions. Our results further the findings of Tagaris et al. [2007], showing that emissions reductions strategies will continue to play a vital role in improving air quality over the U.S., especially in regions where climate change threatens to degrade O 3 and PM air quality. Future research will consider the impact of alternative future emissions, using the MARKAL 9R model, and land use scenarios on U.S. air quality. 5 Acknowledgments While this work was supported, in part, by grants from the US EPA (EPA-G2008- STAR-J1) and NASA, reference herein to any specific commercial products, process, or service by trade name, trademark, manufacturer, or otherwise, does not necessarily constitute or imply their endorsement or recommendation. The views and opinions of authors expressed herein are those of the authors and do not necessarily state or reflect those of the United States Government. 13
14 References Brown, K. E., et al. (2013), Accounting for Climate and Air Quality Damages in Future US Electricity Generation Scenarios, Environmental Science & Technology, 47(7), , doi: /es304281g. Carter, W. P. L. (2000), Documentation of the SAPRC-99 chemical mechanism for VOC reactivity assessment, University of California, Riverside, Riverside, CA. CEP (2003), Sparse Matrix Operator Kernel Emissions Modeling System (SMOKE) User Manual, edited, Chapel Hill, NC. Dudhia, J. (1989), Numerical study of convection observed during the winter monsoon experiment using a mesoscale two-dimensional model, J. Atmos. Sci., 46(20), Dunker, A. M., et al. (2002), The decoupled direct method for sensitivity analysis in a threedimensional air quality model - Implementation, accuracy, and efficiency, Environmental Science & Technology, 36(13), Ek, M. B., et al. (2003), Implementation of Noah land surface model advances in the National Centers for Environmental Prediction operational mesoscale Eta model, Journal of Geophysical Research-Atmospheres, 108(D22), 16, doi: /2002jd EPA (2012), (U.S. Environmental Protection Agency): Models, Methods & Tools. U.S. EPA Air and Climate Change Research. edited. Fann, N., et al. (2013), The Recent and Future Health Burden of Air Pollution Apportioned Across US Sectors, Environmental Science & Technology, 47(8), , doi: /es304831q. Fishbone, L. G., et al. (1980), MARKAL, a Multiperiod Linear-Programming Model for Energy-Systems Analysis Applied to the United-States, Bulletin of the American Physical Society, 25(4), Foley, K. M., et al. (2010), Incremental testing of the Community Multiscale Air Quality (CMAQ) modeling system version 4.7, Geoscientific Model Development, 3(1), Hong, S. Y., et al. (2006), A new vertical diffusion package with an explicit treatment of entrainment processes, Mon. Weather Rev., 134(9), Ito, K., et al. (2005), Associations between ozone and daily mortality - Analysis and metaanalysis, Epidemiology, 16(4), , doi: /01.ede f. Jacob, D. J., and D. A. Winner (2009), Effect of climate change on air quality, Atmospheric Environment, 43(1), 51-63, doi: /j.atmosenv Kain, J. S., and J. M. Fritsch (1993), Convective parameterization models: The Kain Fritsch scheme. Cumulus Convection in Numerical Models, American Meteorological Society, 46, Lamarque, J. F., et al. (2011), Global and regional evolution of short-lived radiatively-active gases and aerosols in the Representative Concentration Pathways, Clim. Change, 109(1-2), , doi: /s Leibensperger, E. M., et al. (2012a), Climatic effects of changes in US anthropogenic aerosols - Part 1: Aerosol trends and radiative forcing, Atmospheric Chemistry and Physics, 12(7), , doi: /acp Leibensperger, E. M., et al. (2012b), Climatic effects of changes in US anthropogenic aerosols - Part 2: Climate response, Atmospheric Chemistry and Physics, 12(7), , doi: /acp
15 Leung, L. R., and W. I. Gustafson (2005), Potential regional climate change and implications to US air quality, Geophysical Research Letters, 32(16), 4, doi:l /2005gl Liao, K. J., et al. (2007), Sensitivities of ozone and fine particulate matter formation to emissions under the impact of potential future climate change, Environmental Science & Technology, 41(24), , doi: /es070998z. Likens, G. E., et al. (1996), Long-term effects of acid rain: Response and recovery of a forest ecosystem, Science, 272(5259), , doi: /science Lim, S. S., et al. (2012), A comparative risk assessment of burden of disease and injury attributable to 67 risk factors and risk factor clusters in 21 regions, : a systematic analysis for the Global Burden of Disease Study 2010 (vol 380, pg 2224, 2012), Lancet, 381(9874), Lin, Y. L., et al. (1983), Bulk parameterization of the snow field in a cloud model, Journal of Climate and Applied Meteorology, 22(6), , doi: / (1983)022<1065:bpotsf>2.0.co;2. Liu, P., et al. (2012), Differences between downscaling with spectral and grid nudging using WRF, Atmospheric Chemistry and Physics, 12(8), , doi: /acp Loughlin, D. H., et al. (2011), ESP v1.0: methodology for exploring emission impacts of future scenarios in the United States, Geoscientific Model Development, 4(2), , doi: /gmd Mauzerall, D. L., and X. P. Wang (2001), Protecting agricultural crops from the effects of tropospheric ozone exposure: Reconciling science and standard setting in the United States, Europe, and Asia, Annu. Rev. Energ. Environ., 26, , doi: /annurev.energy Mickley, L. J., et al. (2004), Effects of future climate change on regional air pollution episodes in the United States, Geophysical Research Letters, 31(24), 4, doi:l /2004gl Mlawer, E. J., et al. (1997), Radiative transfer for inhomogeneous atmospheres: RRTM, a validated correlated-k model for the longwave, Journal of Geophysical Research- Atmospheres, 102(D14), , doi: /97jd Moss, R. H., et al. (2010), The next generation of scenarios for climate change research and assessment, Nature, 463(7282), , doi: /nature Murray, C. J. L., et al. (2013), Disability-adjusted life years (DALYs) for 291 diseases and injuries in 21 regions, : a systematic analysis for the Global Burden of Disease Study 2010, Lancet, 380(9859), Napelenok, S., et al. (2006), Implementation of the Decoupled Direct 3D Sensitivity Analysis Method for Particulate Matter and Analysis of Pollutant Responses in the Southeastern United States, Atmospheric Environment, in press Nolte, C. G., et al. (2008), Linking global to regional models to assess future climate impacts on surface ozone levels in the United States, Journal of Geophysical Research- Atmospheres, 113(D14), D14307, doi: /2007jd Ramanathan, V., et al. (2001), Atmosphere - Aerosols, climate, and the hydrological cycle, Science, 294(5549), , doi: /science Schmidt, G. A., et al. (2013), Configuration and assessment of the GISS ModelE2 contributions to the CMIP5 archive, J. Adv. in Modeling Earth Systems, Submitted Shindell, D., et al. (2012), Simultaneously Mitigating Near-Term Climate Change and Improving Human Health and Food Security, Science, 335(6065), , doi: /science
16 Skamarock, W. C., and J. B. Klemp (2008), A time-split nonhydrostatic atmospheric model for weather research and forecasting applications, Journal of Computational Physics, 227(7), , doi: /j.jcp Tagaris, E., et al. (2007), Impacts of global climate change and emissions on regional ozone and fine particulate matter concentrations over the United States, Journal of Geophysical Research-Atmospheres, 112(D14), D14312, doi: /2006jd Trail, M., Tsimpidi, A. P., Liu, P., Tsigaridis, K., Hu, Y., Nenes, A., and Russell, A. G. (2013), Downscaling a global climate model to simulate climate change impacts on US regional and urban air quality, Geosci. Model Dev., 6, , doi: /gmd Weaver, C. P., et al. (2009), A preliminary synthesis of modeled climate change impacts on US regional ozone concentrations, Bulletin of the American Meteorological Society, 90(12), , doi: /2009bams Woo, J. H., et al. (2008), Development of North American Emission Inventories for Air Quality Modeling under Climate Change, Journal of the Air & Waste Management Association, 58(11), , doi: / Yang, Y. J., et al. (1997), Fast, direct sensitivity analysis of multidimensional photochemical models, Environmental Science & Technology, 31(10), Zhou, J. A., et al. (2011), Time-Series Analysis of Mortality Effects of Fine Particulate Matter Components in Detroit and Seattle, Environ. Health Perspect., 119(4), , doi: /ehp
17 Table 1 Present day anthropogenic emission rates of NO X, VOC, SO 2 and primary PM 2.5 emitted by area, point and mobile sources from each of the 9 U.S. census regions. The last four columns are the total anthropogenic emissions from each census track and the bottom row shows the total emissions of each pollutant over the entire U.S Area [tons/yr *10 3 ] Point [tons/yr *10 3 ] Mobile [tons/yr *10 3 ] Total Anthropogenic [tons/yr *10 3 ] Census Track NOX VOC SO2 PM2_5 NOX VOC SO2 PM2_5 NOX VOC SO2 PM2_5 NOX VOC SO2 PM2_5 New England Mid Atlantic East North Central West North Central South Atlantic East South Central West South Central Mountain Pacific Total
18 Table 2 Percent change (future minus present divided by present) in annual emission rates of NO X, VOC, SO 2 and primary PM 2.5 emitted by area, point and mobile sources from each of the 9 U.S. census regions. Change ( ) Area [%] Point [%] Mobile [%] Total Anthropogenic [%] Census Track NOX VOC SO2 PM2_5 NOX VOC SO2 PM2_5 NOX VOC SO2 PM2_5 NOX VOC SO2 PM2_5 New England Mid Atlantic East North Central West North Central South Atlantic East South Central West South Central Mountain Pacific Total

19 Figure 1 CMAQ modeling domain with the 9 US census regions used in the EPA MARKAL 9R modeling 19
 5-year Average present SA-MDA8,")


20 576 (a) (b) (c) Figure 2 (a) 5-year Average present SA-MDA8, (b) change in SA-MDA8 (future minus present) and (c) change in SA-MDA8 for the CP scenario (SA-MDA8 simulated using 2050 climate and 2050 emissions minus SA-MDA8 simulated using 2010 climate and 2050 emissions) 20
 and (c) difference in 4 th highest MDA8 for the Climate Penalty scenario (4 th highest MDA8 using 2050 climate minus 4 th highest MDA8 using 2010")
21 588 (a) (b) (c) Figure 3 (a) Average of 5 years ( ) 4 th Highest MDA8 of each year (b) Average difference of 4 th highest yearly MDA8 (5 future years minus 5 present years) and (c) difference in 4 th highest MDA8 for the Climate Penalty scenario (4 th highest MDA8 using 2050 climate minus 4 th highest MDA8 using 2010 climate) 21
 and present (dark blue) and CP scenario (2010 climate and 2050 emissions) (red).")
22 Figure 4 CDF plots of daily max 8 hr O3 future (light blue) and present (dark blue) and CP scenario (2010 climate and 2050 emissions) (red). 22
 619 620 621 622 623")

")
 and (c) SA-MDA8 sensitivity")
23 (a) (b) (c) Figure 5 (a) Average present SA-MDA8 sensitivity to total NO X emissions (top) and sensitivity change (difference of future minus present sensitivities) (bottom), (b) SA-MDA8 sensitivity to mobile NO X (top) and sensitivity change (difference of future minus present sensitivities) (bottom) and (c) SA-MDA8 sensitivity to total VOC emissions (top) and sensitivity change (difference of future minus present sensitivities) (bottom) 23
 628 629 630 631 (b) Future minus Present (µg m -3 ) 632 633 (c) Climate Penalty (µg m -3 ) 634 635 636 637 638 639 Figure 6 (a) Average simulated present day PM")
24 627 (a) Annual PM 2.5 Winter Spring Summer Fall (µg m -3 ) (b) Future minus Present (µg m -3 ) (c) Climate Penalty (µg m -3 ) Figure 6 (a) Average simulated present day PM 2.5 µg m -3, (b) change in PM 2.5 (future minus present) and (c) change in PM 2.5 for the CP scenario (PM 2.5 simulated using 2050 climate and 2050 emissions minus PM 2.5 simulated using 2010 climate and 2050 emissions) 24

 Average present day SO 4 (top) and difference (bottom; future minus present)")
25 2- Annual SO 4 (a) Winter Spring Summer Fall (µg m -3 ) (b) Figure 7 Simulated present and future PM species concentrations across the U.S. (a) Average present day SO 4 (top) and difference (bottom; future minus present) and (b) NO 3 (top) and difference (bottom; future minus present) 25
26 PM 2.5 sensitivity to Total NO X Annual sensitivity Winter Spring Summer Fall (µg m -3 ) Figure 8 Average present PM 2.5 sensitivity to total NO X emissions (top) and difference (bottom; future minus present) 26
27 Supplementary Table S1 Seasonal performance of simulated O 3 for the year Simulated O 3 concentrations were compared with EPA_AQS O 3 data. The number of data points (number), mean observed concentration (MOC), mean bias (MB) and normalized mean bias (NMB) are shown for hourly O 3 (O3) and 8-hr average O 3 (8hrO3) without a cutoff and with a cutoff of 40 ppb and for maximum daily 1-hr and 8-hr average O 3 (M1hO3 and M8hO3). Winter O3 O3 cutoff 0.04 nocut number MOC (ppm) MB (ppm) NMB (%) Spring O3 O3 8hrO3 8hrO3 M1hO3 M8hO3 cutoff 0.04 nocut 0.04 nocut 0 0 number MOC (ppm) MB (ppm) NMB (%) Summer O3 O3 8hrO3 8hrO3 M1hO3 M8hO3 cutoff 0.04 nocut 0.04 nocut 0 0 number MOC (ppm) MB (ppm) NMB (%) Fall O3 O3 8hrO3 8hrO3 M1hO3 M8hO3 cutoff 0.04 nocut 0.04 nocut 0 0 number MOC (ppm) MB (ppm) NMB (%)
28 Table S2 Seasonal performance of simulated PM 2.5 for the year Simulated PM 2.5 concentrations were compared with EPA_AQS PM 2.5 data. The number of data points (number), mean observed concentration (MOC), mean bias (MB) and normalized mean bias (NMB) are shown for hourly PM 2.5 PM2.5 Winter Spring Summer Fall number MOC (ug m -3 ) MB (ug m -3 ) NMB (%)
 of observed (blue) and modeled (red) maximum daily 8-hr average (MDA8) ozone")

29 167 sites 104 sites 162 sites sites 163 sites 60 sites sites 134 sites 205 sites Figure S1 Cumulative distribution functions (CDFs) of observed (blue) and modeled (red) maximum daily 8-hr average (MDA8) ozone mixing ratios (ppb) for the nine U.S. census regions during 1May, 2010 to 30 September, Observed MDA8 mixing ratios were retrieved from the EPA-AQS data. The number of observation sites in each region is reported in the bottom right corner of each plot. 29
 daily 24-hr average PM 2.5 concentrations (µg m -3 ) for the nine U.S. census regions during the year 2010. Observed PM 2.5 concentrations were retrieved from the EPA-AQS data.")
30 sites 80 sites 160 sites sites 122 sites 62 sites sites 83 sites 99 sites Figure S2 Cumulative distribution functions (CDFs) of observed (blue) and modeled (red) daily 24-hr average PM 2.5 concentrations (µg m -3 ) for the nine U.S. census regions during the year Observed PM 2.5 concentrations were retrieved from the EPA-AQS data. The number of observation sites in each region is reported in the bottom right corner of each plot. 30
 and difference between present and future (future minus present)")
 31")
31 Figure S3 Average present SA-MDA8 sensitivity to mobile sector emissions of VOC (top) and difference between present and future (future minus present) (bottom) Figure S4 Average present SA-MDA8 sensitivity to biogenic emissions of VOC (top) and difference between present and future (future minus present) (bottom) 31
 712 713 714 715 716 (b) Annual EC")

 Average present day OM (top) and")
 EC (top) and difference (bottom; future")
32 (a) Annual OM Winter Spring Summer Fall (µg m -3 ) (b) Annual EC Winter Spring Summer Fall (µg m -3 ) Figure S5 Simulated present and future PM species concentrations across the U.S. (a) Average present day OM (top) and difference (bottom; future minus present) and (b) EC (top) and difference (bottom; future minus present) 32

 (a) and Average present PM 2.")
33 724 (a) (b) Figure S6 Average present PM 2.5 sensitivity to total SO X emissions (top) and difference (bottom) (a) and Average present PM 2.5 sensitivity to point SO X (top) and difference (bottom) (b) 33

 and future change (bottom) (b) and average present PM 2.")
34 737 (a) (b) (c) Figure S7 Average present PM 2.5 sensitivity to total VOC (top) and future change (bottom) (a), average present PM 2.5 sensitivity to mobile VOC (top) and future change (bottom) (b) and average present PM 2.5 sensitivity to biogenic VOC (top) and future change (bottom) (c) 34
 Annual sensitivity Winter Spring Summer Fall (µg m -3 ) 759 760 761 762 763 764 Figure S8 (a) Average present PM")
35 PM 2.5 sensitivity to Mobile NO X (b) Annual sensitivity Winter Spring Summer Fall (µg m -3 ) Figure S8 (a) Average present PM 2.5 sensitivity to mobile sector NO X (top) and difference in PM 2.5 sensitivity to mobile NO X (bottom; future minus present) 35
High-Resolution Air Quality Modeling of New York City to Assess the Effects of Changes in Fuels for Boilers and Power Generation
 High-Resolution Air Quality Modeling of New York City to Assess the Effects of Changes in Fuels for Boilers and Power Generation Final Report June 23, 2014 Submitted to: New York City Department of Health
Joseph K. Vaughan*, Serena H. Chung, Farren Herron-Thorpe, Brian K. Lamb, Rui Zhang, George H. Mount
 TOWARD A CHEMICAL CLIMATOLOGY OF OZONE CONTRIBUTIONS FROM LONG RANGE TRANSPORT IN THE PACIFIC NORTHWEST -- INCORPORATION OF OZONE TRACERS IN THE AIRPACT-4 AIR QUALITY FORECAST SYSTEM Joseph K. Vaughan*,
Comparison of Source Apportionment and Sensitivity Analysis in a Particulate Matter Air Quality Model
 Environ. Sci. Technol. 2009, 43, 6669 6675 Comparison of Source Apportionment and Sensitivity Analysis in a Particulate Matter Air Quality Model BONYOUNG KOO,*, GARY M. WILSON, RALPH E. MORRIS, ALAN M.
CMAQ Simulations of Long-range Transport of Air Pollutants in Northeast Asia
 CMAQ Simulations of Long-range Transport of Air Pollutants in Northeast Asia Fan Meng Youjiang He Chinese Research Academy of Environmental Sciences A&WMA International Specialty Conference: Leapfrogging
Prediction of Future North American Air Quality
 Prediction of Future North American Air Quality Gabriele Pfister, Stacy Walters, Mary Barth, Jean-Francois Lamarque, John Wong Atmospheric Chemistry Division, NESL/NCAR Greg Holland, James Done, Cindy
Ozone smog in surface air: Background contributions and climate connections. Arlene M. Fiore
 Haze over Boston, MA http://www.airnow.gov/index.cfm?action=particle_health.page1#3 Ozone smog in surface air: Background contributions and climate connections Arlene M. Fiore www.ldeo.columbia.edu/~amfiore
Processing Mobile Emissions in SMOKE: Is it worth simulating everyday onroad mobile emissions to support 8-hr ozone modeling?
 Processing Mobile Emissions in SMOKE: Is it worth simulating everyday onroad mobile emissions to support 8-hr ozone modeling? Mike Abraczinskas North Carolina Department of Environment and Natural Resources
Overview of Predicting the PBL. Robert Elleman EPA Region 10
 Overview of Predicting the PBL Robert Elleman EPA Region 10 Predicting the PBL Why might we be interested Review of PBL air quality studies Regional-scale, Eulerian PBL Performance in the PNW Interested
Local and Global Impacts of Climate Change: Predictions of the 5th IPCC Report
 Local and Global Impacts of Climate Change: Predictions of the 5th IPCC Report Peter Schlosser Department of Earth and Environmental Sciences and Department of Earth and Environmental Engineering The Earth
A Multi-model Operational Air Pollution Forecast System for China Guy P. Brasseur
 A Multi-model Operational Air Pollution Forecast System for China Guy P. Brasseur Max Planck Institute for Meteorology Hamburg, Germany and National Center for Atmospheric Research, Boulder, CO Ying Xie
SOURCE APPORTIONMENT MODELING FOR AIR QUALITY FOR OIL AND GAS DEVELOPMENTS UNDER NEPA
 SOURCE APPORTIONMENT MODELING FOR AIR QUALITY FOR OIL AND GAS DEVELOPMENTS UNDER NEPA Krish Vijayaraghavan, John Grant, Tejas Shah, Zhen Liu, Ralph Morris Ramboll Environ, Novato, CA PERF Meeting November
Recent and future changes in high surface ozone events over the Eastern United States
 Recent and future changes in high surface ozone events over the Eastern United States Harald E. Rieder 1,2* and Arlene M. Fiore 1,3 1 Lamont-Doherty Earth Observatory, Columbia University, NY, USA 2 Applied
Effect of chemistry-aerosol-climate coupling on predictions of future climate and future levels of tropospheric ozone and aerosols
 Click Here for Full Article JOURNAL OF GEOPHYSICAL RESEARCH, VOL. 114,, doi:10.1029/2008jd010984, 2009 Effect of chemistry-aerosol-climate coupling on predictions of future climate and future levels of
Co-benefits of mitigating global greenhouse gas emissions for future air quality and human health
 Co-benefits of mitigating global greenhouse gas emissions for future air quality and human health J. Jason West Department of Environmental Sciences & Engineering University of North Carolina, Chapel Hill
TROPOSPHERIC AEROSOL PROGRAM - TAP
 THE DEPARTMENT OF ENERGY'S TROPOSPHERIC AEROSOL PROGRAM - TAP AN EXAMINATION OF AEROSOL PROCESSES AND PROPERTIES RG99060050.3 American Geophysical Union, Fall Meeting, San Francisco, December 12-17, 1999
Multi-Scale Applications of U.S. EPA s Third-Generation Air Quality Modeling System (Models-3/CMAQ)
") Multi-Scale Applications of U.S. EPA s Third-Generation Air Quality Modeling System (Models-3/CMAQ) Carey Jang, Pat Dolwick, Norm Possiel, Brian Timin, Joe Tikvart U.S. EPA Office of Air Quality Planning
Multi-Scale Applications of U.S. EPA s Third-Generation Air Quality Modeling System (Models-3/CMAQ) Carey Jang, Pat Dolwick, Norm Possiel, Brian Timin, Joe Tikvart U.S. EPA Office of Air Quality Planning
Quantifying Regional Background Ozone for the Houston-Galveston-Brazoria (HGB) Nonattainment Area
 Nonattainment Area") Quantifying Regional Background Ozone for the Houston-Galveston-Brazoria (HGB) Nonattainment Area Mark Estes, Jim Smith & Fernando Mercado Texas Commission on Environmental Quality, Austin, TX Presented
Quantifying Regional Background Ozone for the Houston-Galveston-Brazoria (HGB) Nonattainment Area Mark Estes, Jim Smith & Fernando Mercado Texas Commission on Environmental Quality, Austin, TX Presented
Evaluation of Options for Addressing Secondary PM 2.5 and Ozone Formation. Bruce Macdonald, PhD Jason Reed, CCM
 Evaluation of Options for Addressing Secondary PM 2.5 and Ozone Formation Bruce Macdonald, PhD Jason Reed, CCM 1 Overview Timeline and reasoning Regulatory drivers in the U.S. Emerging approaches Qualitative
U.S. Air Quality and Health Benefits from Avoided Climate Change under Greenhouse Gas Mitigation
 U.S. Air Quality and Health Benefits from Avoided Climate Change under Greenhouse Gas Mitigation The MIT Faculty has made this article openly available. Please share how this access benefits you. Your
CAMS Emissions. Mark Parrington ECMWF. Atmosphere Monitoring
 CAMS Emissions Monitoring Mark Parrington ECMWF mark.parrington@ecmwf.int Overview Monitoring Emissions in CAMS Background to emissions in CAMS. Surface boundary conditions currently used in the operational
Kitimat Airshed Emissions Effects Assessment and CALPUFF Modelling
 Kitimat Airshed Emissions Effects Assessment and CALPUFF Modelling EMA of BC - May 2016 Session - Regional Air Topics Anna Henolson Topics to Cover What is Air Dispersion Modelling? Types of Models CALPUFF
Leif Backman HENVI Seminar February 19, 2009
 Methane Sources and Sinks Leif Backman HENVI Seminar February 19, 2009 Background Atmospheric methane Sources & Sinks Concentration variations & trends Objective & methods Objective & Goals Research plan
INFLUX (The Indianapolis Flux Experiment)
") INFLUX (The Indianapolis Flux Experiment) A top-down/bottom-up greenhouse gas quantification experiment in the city of Indianapolis Paul Shepson, Purdue University Kenneth Davis, Natasha Miles and Scott
INFLUX (The Indianapolis Flux Experiment) A top-down/bottom-up greenhouse gas quantification experiment in the city of Indianapolis Paul Shepson, Purdue University Kenneth Davis, Natasha Miles and Scott
17th International Conference on Harmonisation within Atmospheric Dispersion Modelling for Regulatory Purposes 9-12 May 2016, Budapest, Hungary
 17th International Conference on Harmonisation within Atmospheric Dispersion Modelling for Regulatory Purposes 9-12 May 2016, Budapest, Hungary APPLICATION OF A PHOTOCHEMICAL MODEL TO THE ASSESSMENT OF
Tropospheric Ozone Status and Links to Climate Issues
 Tropospheric Ozone Status and Links to Climate Issues David Simpson 1,2, Birthe Marie Steensen 1 Michael Gauss 1 1. Norwegian Meteorological Institute, Oslo, Norway 2. Chalmers University of Technology,
Detailed Criteria and Hazardous Air Pollutant Emission Inventories for the Ports of Savannah and the Savannah Metro Area
 Detailed Criteria and Hazardous Air Pollutant Emission Inventories for the Ports of Savannah and the Savannah Metro Area Executive Summary Garden City Terminal at Dawn. Container ships working at the Georgia
A physical modeling approach for identification of source regions of primary and secondary air pollutants
 Atmos. Chem. Phys. Discuss., 6, 6467 6496, 06 www.atmos-chem-phys-discuss.net/6/6467/06/ Author(s) 06. This work is licensed under a Creative Commons License. Atmospheric Chemistry and Physics Discussions
Background Ozone Levels
 Background Ozone Levels Sunil Kumar MWAQC TAC May 11, 2010 1 Introduction What is Background ozone level? Ozone level of an area in absence of any anthropogenic influence. True background ozone level existed
Use of the UAM-V Modeling System as an Air Quality Planning Tool and for Examining Heat Island Reduction Strategies
 Use of the UAM-V Modeling System as an Air Quality Planning Tool and for Examining Heat Island Reduction Strategies Sharon G. Douglas, ICF Consulting/SAl A. Belle Hudischewskyj, ICF Consulting/SAl Virginia
Climate system dynamics and modelling
 Climate system dynamics and modelling Hugues Goosse Chapter 6 Future climate changes Outline Methods used to estimate future climate changes. Description of the main results at different timescales. Interpretation
The Globalization of Air Pollution:
 The Globalization of Air Pollution: Implications for Air Quality, Climate and Health Regional and Global Perspectives of Air Pollution Urban Environments Interactions involve Local to Global Scales WMO
NATIONAL AND REGIONAL IMPACTS OF CLIMATE CHANGE ON THE INDIAN ECONOMY
 NATIONAL AND REGIONAL IMPACTS OF CLIMATE CHANGE ON THE INDIAN ECONOMY PARTHA SEN and SHREEKANT GUPTA Delhi School of Economics University of Delhi sgupta@econdse.org Climate Change and Developing Countries
NH3 Emissions for Regional Air Quality Modeling
 NH3 Emissions for Regional Air Quality Modeling Motivation and Questions Motivation NH3 plays a key role in secondary aerosol formation impact on health & regional haze NH3 deposits readily and contributes
The Fifth Assessment: A Discussion of the IPCC Working Group 1 AR5 Report
 The Fifth Assessment: A Discussion of the IPCC Working Group 1 AR5 Report Prof. Chris E. Forest The Pennsylvania State University (ceforest@psu.edu) Lead Author - Chapter 9 - Evaluation of Climate Models!
Air Quality Assessment of the Canadian Pulp and Paper Industry. Gregory Crooks, M.Eng., P.Eng. July 14, 2009
 Air Quality Assessment of the Canadian Pulp and Paper Industry Gregory Crooks, M.Eng., P.Eng. July 14, 2009 Study Overview Health Canada is currently conducting a study of the effects on human health of
Carbon Dioxide and Global Warming Case Study
 Carbon Dioxide and Global Warming Case Study Key Concepts: Greenhouse Gas Carbon dioxide El Niño Global warming Greenhouse effect Greenhouse gas La Niña Land use Methane Nitrous oxide Radiative forcing
NATURAL AND TRANSBOUNDARY INFLUENCES ON PARTICULATE MATTER IN THE UNITED STATES: IMPLICATIONS FOR THE EPA REGIONAL HAZE RULE. Rokjin J.
 NATURAL AND TRANSBOUNDARY INFLUENCES ON PARTICULATE MATTER IN THE UNITED STATES: IMPLICATIONS FOR THE EPA REGIONAL HAZE RULE Rokjin J. Park ACCESS VII, September 5, 2003 EPA REGIONAL HAZE RULE Federal
Lightning and Atmospheric Chemistry
 Lightning and Atmospheric Chemistry 1785 Cavendish performed the first experiments with a spark discharge in glass tube. Discovered that oxidized nitrogen (NO x =NO + NO 2 ) compounds resulted from the
OBSERVED AND MODELED SUMMER THERMAL GRADIENTS AND SEA-BREEZE IN SOUTHERN CALIFORNIA
 OBSERVED AND MODELED SUMMER THERMAL GRADIENTS AND SEA-BREEZE IN SOUTHERN CALIFORNIA Jorge E. González, Pedro Sequera, Kyle McDonald Daniel Comarazamy Steve LaDochy Robert Bornstein The City College of
Journal of Geophysical Research - Atmosphere. Supplementary Information for
 Journal of Geophysical Research - Atmosphere Supplementary Information for Incorporating An Advanced Aerosol Activation Parameterization into WRF-CAM5: Model Evaluation and Parameterization Intercomparison
Pittsburgh Modeling for the PM 2.5 NAAQS EPA Regional/State/Local Modelers Workshop. May 2, 2012
 Pittsburgh Modeling for the PM 2.5 NAAQS 2012 EPA Regional/State/Local Modelers Workshop Chicago, IL May 2, 2012 Jason Maranche Allegheny County Health Department Pittsburgh, PA Nonattainment Areas Before/After
SPECIAL PROJECT FINAL REPORT
 SPECIAL PROJECT FINAL REPORT Project Title: Modelling interactions between atmospheric composition and climate changes with the Earth system model EC-Earth Computer Project Account: spnlcece Start Year
Air Transportation: Emissions and Effects
 Air Transportation: Emissions and Effects Joyce E. Penner University of Michigan Report Co-ordinator: IPCC Special Report on Aviation and the Global Atmosphere Presentation to the First Regional Symposium
Red Deer Region Air Zone Canadian Ambient Air Quality Standards Response Government of Alberta Action Plan
 Red Deer Region Air Zone Canadian Ambient Air Quality Standards Response Government of Alberta Action Plan September 2017 Any comments or questions regarding the content of this document may be directed
The Chemistry of Climate Change. Reading: Chapter 8 Environmental Chemistry, G. W. vanloon. S. J. Duffy
 The Chemistry of Climate Change Reading: Chapter 8 Environmental Chemistry, G. W. vanloon. S. J. Duffy The Science of Global Climate There's a lot of differing data, but as far as I can gather, over the
History of significant air pollution events
 Ch17 Air Pollution A thick layer of smoke and haze covers Santiago, Chile. History of significant air pollution events Many of the worst air pollution episodes occurred in the last two centuries in London
Influence of climate change and variability on (mostly U.S. ozone) air quality
 air quality") Influence of climate change and variability on (mostly U.S. ozone) air quality Arlene M. Fiore Acknowledgments: M. Lin, V. Naik, C. Raphael, J. Schnell (NOAA GFDL), E. Leibensperger (SUNY Plattsburgh),
Influence of climate change and variability on (mostly U.S. ozone) air quality Arlene M. Fiore Acknowledgments: M. Lin, V. Naik, C. Raphael, J. Schnell (NOAA GFDL), E. Leibensperger (SUNY Plattsburgh),
Air Pollution. GEOL 1350: Introduction To Meteorology
 Air Pollution GEOL 1350: Introduction To Meteorology 1 Overview Types and Sources of Air Pollutants Factors That Affect Air Pollution Air Pollution and the Urban Environment 2 Air pollutants are airborne
Quantifying Impacts of Land-use and Land Cover Change in a Changing Climate at the Regional Scale using an Integrated Earth System Modeling Approach
 Quantifying Impacts of Land-use and Land Cover Change in a Changing Climate at the Regional Scale using an Integrated Earth System Modeling Approach Maoyi Huang 1, Guoyong Leng 1, Yannick Le Page 1,2,
Emission Projections. National RPO Meeting St. Louis, MO November 6, Presented by: Gregory Stella VISTAS Technical Advisor Emission Inventories
 Emission Projections National RPO Meeting St. Louis, MO November 6, 2003 Presented by: Gregory Stella VISTAS Technical Advisor Emission Inventories VISTAS - Regional Haze Timeline Regional Haze Rule 1999
ATM S 211 Final Examination June 4, 2007
 ATM S 211 Final Examination June 4, 2007 Name This examination consists of a total of 100 points. In each of the first two sections, you have a choice of which questions to answer. Please note that you
Understanding the Causes of Global Climate Change
 FACT SHEET I: Attribution Environment Understanding the Causes of Global Climate Change Average air temperatures at the Earth s surface have increased by approximately 0.6 o C (1 o F) over the 20 th century.
Chapter 3 - ATMOSPHERIC TRANSPORT AND MERCURY DEPOSITION
 Chapter 3 - ATMOSPHERIC TRANSPORT AND MERCURY DEPOSITION A. Introduction Mercury is an especially dynamic pollutant because of its unique physical, chemical, and bioaccumulative properties. The volatility
Effect of Climate Change on Air Quality
 Effect of Climate Change on Air Quality The Harvard community has made this article openly available. Please share how this access benefits you. Your story matters. Citation Published Version Accessed
Air Pollution and Climate:
 Air Pollution and Climate: Short and longer-term research for the IAMC IAMC Meeting September 23, 2008 Baden, Austria Steven J Smith Joint Global Change Research Institute ssmith@pnl.gov With substantial
Human Activity and Climate Change
 Human Activity and Climate Change Textbook pages 482 501 Section 11.1 11.2 Summary Before You Read How might climate change affect the region where you live? Record your thoughts in the lines below. What
Climate Change : Facts and Future Scenarios
 Climate Change : Facts and Future Scenarios Dr Jim Salinger National Institute of Water & Atmospheric Research, Auckland, NZ FOA/MAF 6 th Annual Forest Biosecurity Workshop 8-9 th March 2007 Outline Facts
The role of light duty vehicles in future air pollution: a case study of Sacramento
 Transportation Planning and Technology Vol. 33, No. 6, August 2010, 541549 The role of light duty vehicles in future air pollution: a case study of Sacramento Guihua Wang* Institute of Transportation Studies,
Health Co-benefits of Carbon Standards for Existing Power Plants
 Health Co-benefits of Carbon Standards for Existing Power Plants Part 2 of the Co-Benefits of Carbon Standards Study September 30, 2014 Joel Schwartz, Harvard School of Public Health, Harvard University;
Estimating present and future wildfire pollution in the U.S.
 Estimating present and future wildfire pollution in the U.S. (and a bit about the 2015 haze in Indonesia) Shannon N. Koplitz and Christopher G. Nolte USEPA/ORD/NERL/SED/EFAB In support of the Air Climate
USE OF RPO MODELING TO MEET REGIONAL HAZE AND NAAQS REQUIREMENTS
 USE OF RPO MODELING TO MEET REGIONAL HAZE AND NAAQS REQUIREMENTS James W. Boylan Georgia Department of Natural Resources (Chair for Inter-RPO Modeling Workgroup) 2005 CMAS Models-3 Conference Chapel Hill,
Health co-benefits of mitigating nearterm climate change through black carbon and methane emission controls
 Health co-benefits of mitigating nearterm climate change through black carbon and methane emission controls Susan Casper Anenberg, U.S. EPA Woodrow Wilson Center China Environment Forum March 14, 2012
Methane in the 21 st Century: Projections with RCP scenarios in GEOS-Chem
 Methane in the 21 st Century: Projections with RCP scenarios in GEOS-Chem Christopher D. Holmes Dept. of Earth System Science University of California, Irvine Coauthors: Michael Prather (UC Irvine) O.
SA Climate Ready Climate projections for South Australia
 Northern and Yorke SA Climate Ready Climate projections for South Australia This document provides a summary of rainfall and temperature (maximum and minimum) information for the Northern and Yorke (NY)
PM status for 2012 and the main issues regarding the EMEP measurement program
 PM status for 2012 and the main issues regarding the EMEP measurement program Outline Status of PM levels in rural Europe in 2012 Including high episode in jan/febr in central Europe EMEP intensive measurement
USE OF RPO MODELING TO MEET REGIONAL HAZE AND NAAQS REQUIREMENTS
 USE OF RPO MODELING TO MEET REGIONAL HAZE AND NAAQS REQUIREMENTS James W. Boylan* Georgia Department of Natural Resources, Air Protection Branch, Atlanta, GA, USA 1. INTRODUCTION In order to help meet
Dr David Karoly School of Meteorology
 Global warming: Is it real? Does it matter for a chemical engineer? Dr David Karoly School of Meteorology Email: dkaroly@ou.edu Recent global warming quotes Senator James Inhofe (R, Oklahoma), Chair, Senate
SA Climate Ready Climate projections for South Australia
 South East SA Climate Ready Climate projections for South Australia This document provides a summary of rainfall and temperature (maximum and minimum) information for the South East (SE) Natural Resources
[1] {Universidade Tecnológica Federal do Paraná, Londrina, PR, Brazil} [2] {Universidade de São Paulo, São Paulo, SP, Brazil}
![[1] {Universidade Tecnológica Federal do Paraná, Londrina, PR, Brazil} [2] {Universidade de São Paulo, São Paulo, SP, Brazil}](/thumbs/74/70154735.jpg "[1] {Universidade Tecnológica Federal do Paraná, Londrina, PR, Brazil} [2] {Universidade de São Paulo, São Paulo, SP, Brazil}") [1] {Universidade Tecnológica Federal do Paraná, Londrina, PR, Brazil} [2] {Universidade de São Paulo, São Paulo, SP, Brazil} Introduction The main goal of this study is: To improve the vehicular emission
[1] {Universidade Tecnológica Federal do Paraná, Londrina, PR, Brazil} [2] {Universidade de São Paulo, São Paulo, SP, Brazil} Introduction The main goal of this study is: To improve the vehicular emission
A dynamic air pollution prediction system for Cape Town, South Africa
 A dynamic air pollution prediction system for Cape Town, South Africa M. Zunckel 1, E. C. Cairncross 2, E. Marx 3, V. Singh 4 & V. Reddy 5 1 CSIR Environmentek, Durban, South Africa 2 Peninsula Technikon,
A comparison of CALPUFF air quality simulation results with monitoring data for Krakow Poland
 A comparison of CALPUFF air quality simulation results with monitoring data for Krakow Poland John S. Irwin 1, Joanna Niedzialek 2, Jerzy Burzynski 3 1 Atmospheric Sciences Modeling Division (Mail Drop
Interactive comment on Temperature-dependence of aerosol optical depth over the southeastern US by Tero Mielonen et al.
 Atmos. Chem. Phys. Discuss., doi:10.5194/acp-2016-625-ac1, 2016 Author(s) 2016. CC-BY 3.0 License. Interactive comment on Temperature-dependence of aerosol optical depth over the southeastern US by Tero
The Health Co-Benefits of Short-lived Climate Forcing Air Pollutants
 The Health Co-Benefits of Short-lived Climate Forcing Air Pollutants Michael Jerrett, PhD Professor, Environmental Health and Geographic Information Sciences School of Public Health UC Berkeley Good News
Emissions Processing and Sensitivity Air Quality Modeling of Category 3 Commercial Marine Vessel Emissions
 Emissions Processing and Sensitivity Air Quality Modeling of Category 3 Commercial Marine Vessel Emissions Rich Mason and Pat Dolwick U. S. Environmental Protection Agency, Office of Air Quality Planning
Atmosphere, the Water Cycle and Climate Change
 Atmosphere, the Water Cycle and Climate Change OCN 623 Chemical Oceanography 16 April 2013 (Based on previous lectures by Barry Huebert) 2013 F.J. Sansone 1. The water cycle Outline 2. Climate and climate-change
GLOBAL CLIMATE CHANGE
 1 GLOBAL CLIMATE CHANGE From About Transportation and Climate Change (Source; Volpe center for Climate Change and Environmental forecasting, http://climate.volpe.dot.gov/trans.html Greenhouse effect has
Discussion of the NASA OCO-2 Satellite Measurements of CO 2 Concentrations
 Physics Journal Vol. 1, No. 3, 2015, pp. 189-193 http://www.aiscience.org/journal/pj Discussion of the NASA OCO-2 Satellite Measurements of CO 2 Concentrations A. Parker * School of Engineering and Physical
GLOBAL CLIMATE AND MICROCLIMATE. Dr. Muhammad Asif Hanif, Department of Chemistry, University of Agriculture, Faisalabad, Pakistan
 GLOBAL CLIMATE AND MICROCLIMATE Perhaps the single most important influence on Earth s environment is climate, consisting of long-term weather patterns over large geographical areas. One important example
GCM-Simulated Surface Energy Fluxes in Climate Change Experiments
 DECEMBER 1997 WILD ET AL. 3093 GCM-Simulated Surface Energy Fluxes in Climate Change Experiments MARTIN WILD AND ATSUMU OHMURA Department of Geography, Swiss Federal Institute of Technology, Zurich, Switzerland
Simulation of Climate Change Impact on Runoff Using Rainfall Scenarios that Consider Daily Patterns of Change from GCMs
 Simulation of Climate Change Impact on Runoff Using Rainfall Scenarios that Consider Daily Patterns of Change from GCMs F.H.S. Chiew a,b, T.I. Harrold c, L. Siriwardena b, R.N. Jones d and R. Srikanthan
Lecture 2: Greenhouse Gases - Basic Background on Atmosphere - GHG Emission and Concentration Rise - California Regulation (AB32)
") Lecture 2: Greenhouse Gases - Basic Background on Atmosphere - GHG Emission and Concentration Rise - California Regulation (AB32) METR 113/ENVS 113 Spring Semester 2011 February 15, 2011 Suggested Reading
Lecture 2: Greenhouse Gases - Basic Background on Atmosphere - GHG Emission and Concentration Rise - California Regulation (AB32) METR 113/ENVS 113 Spring Semester 2011 February 15, 2011 Suggested Reading
The Fourth Assessment of the Intergovernmental
 Hydrologic Characterization of the Koshi Basin and the Impact of Climate Change Luna Bharati, Pabitra Gurung and Priyantha Jayakody Luna Bharati Pabitra Gurung Priyantha Jayakody Abstract: Assessment of
NO2, SO2, PM2.5, Oh my!?! Information Session EPA R/S/L Modelers Workshop May 10, 2010
 NO2, SO2, PM2.5, Oh my!?! Information Session EPA R/S/L Modelers Workshop May 10, 2010 Purpose & Outline Provide background and updates on permit modeling processes and technical aspects related to new
Air Pollution in the Los Angeles Basin
 Air Pollution in the Los Angeles Basin Pollutants in L.A. Air Ozone Carbon Monoxide Nitrogen Oxides Heavy Metals Particulate Matter PAHs (polyaromatic hydrocarbons) Other things 1 Primary Pollutants The
AIR DISPERSION MODELING
 Click to edit Master title style AIR DISPERSION MODELING Use of AERMOD for NAAQS Area Designations and State Implementation Plan Submittals SPEAKER Stewart McCollam DATE February 10, 2016 USE OF AERMOD
21 st Century Climate Change Impacts on Marine Fisheries
 21 st Century Climate Change Impacts on Marine Fisheries Anne B. Hollowed, NOAA, NMFS, Alaska Fisheries Science Center, Seattle, WA USA International Workshop on Climate and Oceanic Fisheries, Rarotonga,
Climate Engineering with Aerosols -- Predictable Consequences?
 Climate Engineering with Aerosols -- Predictable Consequences? David S. Battisti, University of Washington Collaborators: Kelly McCusker, Cecilia Bitz and Phil Rasch Introduction: what is out there? Engineering
THE IMPACT OF CLIMATE CHANGE ON HYDRO-ELECTRICITY GENERATION
 Report for CEATI INTERNATIONAL INC. 1010 Sherbrooke Street West, Suite 2500 Montreal, Quebec, Canada H3A 2R7 Website: www.ceati.com WATER MANAGEMENT INTEREST GROUP (WMIG) CEATI REPORT No. T072700-0409
Application of the AERMOD modeling system for air pollution dispersion in the South Pars oilfield
 First International Symposium on Urban Development: Koya as a Case Study 339 Application of the AERMOD modeling system for air pollution dispersion in the South Pars oilfield 1,2 1,2 3 M. Rouhi, H. Moradi
Modeling For Managers. aq-ppt5-11
 Modeling For Managers aq-ppt5-11 Types of Models Near-field *Preferred: EPA AERMOD model 50km CLASS II; Increment Far-field CALPUFF 50km 100+km CLASS I; Chemical Transformation What is used at MPCA History
Emissions Modeling For Photochemical Modelers. Mark Janssen LADCO Photochemical Modelers Training August 3-4 th 2010
 Emissions Modeling For Photochemical Modelers Mark Janssen LADCO Photochemical Modelers Training August 3-4 th 2010 Overview Emissions Modeling (EM) Issues Every Photochemical Modeler Needs To understand
ESTIMATING THE IMPACTS OF CLIMATE CHANGE AND URBANIZATION ON BUILDING PERFORMANCE. Drury B. Crawley
 ESTIMATING THE IMPACTS OF CLIMATE CHANGE AND URBANIZATION ON BUILDING PERFORMANCE Drury B. Crawley U. S. Department of Energy Washington, DC 2585, USA ABSTRACT While the scientific literature is full of
Single-Source Impacts on Secondary PM 2.5 Formation A Case Study
 Single-Source Impacts on Secondary PM 2.5 Formation A Case Study Midwest Environmental Compliance Conference Joe Stolle, PE, Senior Environmental Engineer Wendy Vit, PE, Senior Environmental Engineer May
Optical properties of light absorbing organic aerosols(brown carbon) in North Nanjing. Reporter: Bao Mengying
 in North Nanjing. Reporter: Bao Mengying") Optical properties of light absorbing organic aerosols(brown carbon) in North Nanjing Reporter: Bao Mengying 2017.12.08 Outline Current work 1 2 3 4 Background Experiment Results and discussion Conclusion
Optical properties of light absorbing organic aerosols(brown carbon) in North Nanjing Reporter: Bao Mengying 2017.12.08 Outline Current work 1 2 3 4 Background Experiment Results and discussion Conclusion
Intermountain West Data Warehouse Western Air Quality Study (IWDW-WAQS) Applicability of the IWDW-WAQS beyond the West
 Applicability of the IWDW-WAQS beyond the West") Intermountain West Data Warehouse Western Air Quality Study (IWDW-WAQS) Applicability of the IWDW-WAQS beyond the West 2 NPS Air Quality Conditions & Trends Tools (nps.gov) Partners: NPS/ARD Databases
Intermountain West Data Warehouse Western Air Quality Study (IWDW-WAQS) Applicability of the IWDW-WAQS beyond the West 2 NPS Air Quality Conditions & Trends Tools (nps.gov) Partners: NPS/ARD Databases
Introduction of CMIP5 Experiments Carried out with the Climate System Models of Beijing Climate Center
 ADVANCES IN CLIMATE CHANGE RESEARCH 4(1): 41 49, 2013 www.climatechange.cn DOI: 10.3724/SP.J.1248.2013.041 CHANGES IN CLIMATE SYSTEM Introduction of CMIP5 Experiments Carried out with the Climate System