CONTENTS. Fact Sheet 10: Hotspots - Varanasi. Summary & Recommendations
|
|
|
- Polly Byrd
- 6 years ago
- Views:
Transcription
1


 For more")
2 CONTENTS Overview Fact Sheet 1: Hotspots - Ahmedabad Fact Sheet 2: Hotspots - Chennai Fact Sheet 3: Hotspots - Delhi Fact Sheet 4: Hotspots - Hyderabad Fact Sheet 5: Hotspots - Kolkata Fact Sheet 6: Hotspots - Madhya Pradesh Fact Sheet 7: Hotspots - Mumbai Fact Sheet 8: Hotspots - Orissa Fact Sheet 9: Hotspots - Punjab Fact Sheet 10: Hotspots - Varanasi Summary & Recommendations Investigators: M.L. Mittal, Sr. Scientist Ohio Supercomputer Center, Columbus, Ohio (USA) C. Sharma National Physical Laboratory, New Delhi (India) Dr. Moti Mittal (pictured) For more information, please contact Dr. Moti Mittal at moti@osc.edu or visit
 as well as Sri Lanka and Maldives.")
 is the most dangerous air pollutant in terms of damage to crop plants and human health. O 3 constitutes of three oxygen atoms and is a light blue gas.")
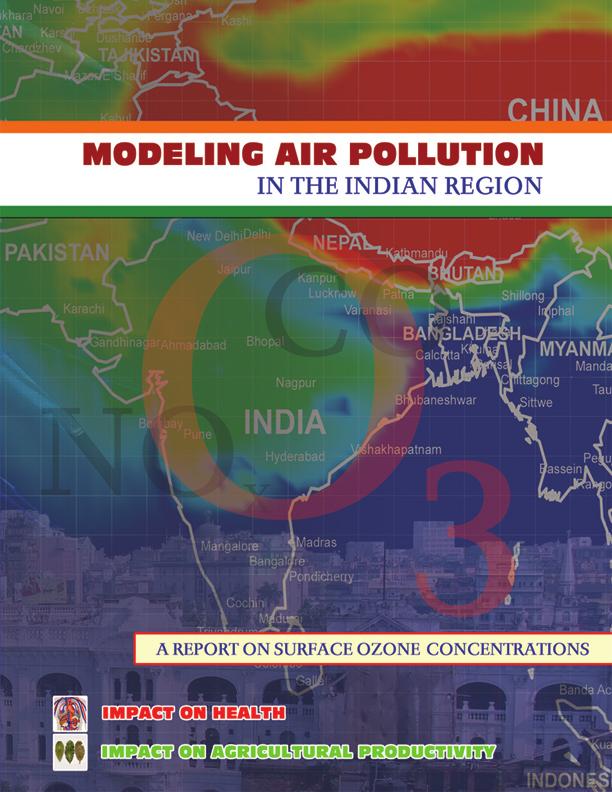
3 Air-pollutant Ozone in the Indian Region Air pollution in Asian cities has grown and will continue to grow with further industrialization and urbanization. The regions most affected are China and the South Asian Region, which includes the Indian subcontinent (India, Pakistan, Bangladesh, Nepal and Bhutan) as well as Sri Lanka and Maldives. Three fourths of this region s population live in rural areas, and approximately one third of these inhabitants are living in poverty. Ozone (O 3 ) is the most dangerous air pollutant in terms of damage to crop plants and human health. O 3 constitutes of three oxygen atoms and is a light blue gas. It is rare in the atmosphere, but has significant bearing on both physical and biological properties of the Earth s environment. O 3 is a highly reactive and toxic substance that absorbs infrared radiations from the lower atmosphere and thus contributes to the greenhouse effect. O 3 is found in two regions of the Earth s atmosphere. Most O 3 (about 90 %) resides in the upper atmosphere ( approximately 10 kilometers to 50 kilometers), also known as stratosphere. This layer provides protection from exposure to ultraviolet radiation to the Earth s inhabitants. Remaining O 3 in the lower atmosphere is known as tropospheric ozone (also surface ozone). Tropospheric ozone is formed in the atmosphere from photochemical reactions of volatile organic compounds (VOC) and oxides of nitrogen (NOx) in the presence of sunlight. VOC and NOx are the precursor gases in the ozone formation. O 3 combines with water to form hydroxyl radical OH, which helps in cleansing the atmosphere from toxic gases. Surface ozone is also known as bad ozone because it oxidizes biologically active molecules. Surface ozone has harmful effects on crop production, forest growth, and human health. Hotspots exist at one or several locations in a city, at places where the conditions are ripe for its formation and/or transportation. The life cycle of surface ozone is typically 5 to 8 days. O 3 concentration greater than 40 parts per billion by volume (ppbv) persisted over a period of 8 hours, is considered harmful to crop plants. The United States Environmental Protection Agency (USEPA) has estimated that due to ambient O 3 concentrations, the yields of about one-third of US crops decreased by 10%. Similar studies for Europe estimate the yield losses ranging between 5% and 10%. Another study estimates 1-9 % loss in yields of wheat, rice, and corn and 23-27% loss in the yields of soybeans in China, Japan, and South Korea in 1990 due to the prevailing levels of O 3. O 3 concentration greater than 80 ppbv is considered harmful to human health. The National Institute of Environmental Health Sciences (USA) reports a 5 to 10% reduction in lung capacity occurred in volunteers engaged in moderate exercise for 6.5 hours at 80 ppbv. O 3 reacts with molecules in the lining of our airways. There is clinical evidence that exposure to ozone and particles, significantly increases the frequency of occurrence of symptoms, increases the (continuted on reverse side)

4 Air-pollutant Ozone in the Indian Region (continued) requirement for medication and adversely affects lung function. O 3 also triggers asthma and may aggravate other respiratory illnesses such as pneumonia and bronchitis. Children with asthma are especially vulnerable to adverse health effects from high levels of O 3 and children s vulnerability to ozone s ill effects provokes great concern. People spending much of their time outdoors to earn a living, such as, vendors, construction workers, rickshaw pullers, traffic police, cyclists, two-wheeler users and the likes, are most likely to have high risk of exposure to bad ozone This study, sponsored by USAID/India s Office of Environment, Energy and Enterprise, demonstrates the gridded concentration of ozone and other air pollutants over the Indian region for a four month period. Risk assessment of the pollutants requires a complete understanding of the gridded concentrations of the primary and secondary pollutants, unavailable until now for the Indian sub-continent. Computer model MM5 is used to compute meteorological fields (temperature, pressure, wind velocity etc.) and a chemistry transport model HANK to obtain ozone (O 3 ) and other chemical species (CO, NO x etc.). The territory covers the Indian sub-continent from Afghanistan in the west, to parts of Southeast Asian countries in the east, parts of China in the north, and to Sri Lanka in the south. Supercomputer CRAY X1 at The Ohio State University/Ohio Supercomputer Center is used for these simulations. This is the first study that estimates surface ozone over the entire Indian subcontinent. The Figure on the right panel shows the average daytime O 3 levels during the months of February, March, April and May. O 3 values are averaged over an 8- hour period and for each month. Ozone hot spots (most affected regions in India) are shown on the separate sheets. This study makes it possible to quantify the productivity losses from surface ozone by estimating the losses in agricultural yields and increase in respiratory diseases ppbv ppbv ppbv ppbv
5 Fact Sheet 1 of 10: Hotspots - Ahmedabad The Ahmedabad region covers the area between 20º N to 25º N and 70º E to 75º E. This region covers parts of Gujarat, Rajasthan, and a small part of Pakistan. Population density in this region is: Gujarat 258 persons/km 2 and Rajasthan 165 persons/km 2. This figure shows the number of days when the average daytime ozone concentration during January 15 to May 29, 2000 (135 days) was higher than 60 ppbv in the region. The whole region is divided into 100 parts of 60 x 60 km area. Blue numbers indicate the number of days that the daytime average ozone concentration was between 80 and 89 ppbv; green refers to the number of days that the daytime average was between 70 and 79 ppbv; and purple expresses the number of days that the daytime average was between 60 and 69 ppbv. In the space between 22.5º N to 23º N and 72.5º E to 73º E, which includes Ahmedabad (3.6 million population), there were 5 days when the daytime average ozone concentration was between ppbv, and 1 day when the concentration reached ppbv. In the space between 20.5º N to 21º N and 72º E to 72.5º E, which includes Daman (Gujarat) and the Gulf of Khambat, there were 20 days when the daytime average ozone concentration was between ppbv, and 5 days when the concentration reached ppbv. Similarly in the region between 24º N to 24.5º N and 73.5º E to 74º E, which includes Udaipur (Rajasthan), there were 6 days when the daytime average ozone concentration was between ppbv. Ozone levels are highest in the area between 22º N to 23.5º N and 72.5ºE to 75º E and on the adjacent oceanic areas. Main crops in this area are wheat, maize, groundnut, and cotton. All these crops are affected by exposure to high levels of ozone. There has not been any scientific analysis or study to determine the exact loss in these crops from exposure to high levels of ozone in this area. Based on the laboratory experiments, a 10-35% loss in wheat, 10-65% loss in cotton, and 20-40% loss in groundnut crops is expected. Similarly, no studies are available on number of people affected by exposure to high levels of ozone or severity in their respiratory illnesses. 1
6 Fact Sheet 2 of 10: Hotspots - Chennai The Chennai region indicates the area in India between 10ºN to 15ºN and 75º E to 80.5º E. This region covers parts of Tamil Nadu (TN), Karnataka, Kerala and parts of the Arabian Sea and the Bay of Bengal. Population density in this region is TN 478 persons/km 2, Karnataka 275 persons/km 2, and Kerala 819 persons/km 2. This figure shows the number of days that the average daytime ozone concentration during January 15 to May 29, 2000 (135 days) was higher than 60 ppbv in the region. The whole region is divided into 110 parts of 60 x 60 km area. Blue numbers indicate the number of days when the daytime average was between 80 and 89 ppbv; green refers to the number of days when the daytime average was between 70 and 79 ppbv; and purple expresses the number of days when daytime average was between 60 and 69 ppbv. The square representing 10.5º N to 11º N and 76º E to 76.5ºE, which includes Trichu in Kerala state (population 2-3 million) shows that the ozone concentration in surface air was between ppbv on 19 separate days in the 135 day period, and there were only 3 days when concentration reached ppbv. In the area between13.5º N to 14º N and 80º E to 80.5ºE which includes Chennai (Madras) with more than 3 million people had only 6 days during January 16 to May 29, 2000, when ozone levels were greater than 60 ppbv. In the area that includes Mysore in Karnataka, population between 2-3 million, there were 9 days when ozone concentration was between 6-69 ppbv during this period. Compared to land ozone levels were higher in the coast of Kerala. In the region between between10.5º N to 11º N and 75.5º E to 76ºE in the Arabian Sea, there were 24 days when the daytime average ozone concentration was between 60-69, 19 days when the concentration reached 70-79; 7 days when ozone levels were between ppbv, and also, there were 3 days when the ozone concentration was greater than 90 ppbv Main crops in this area are rice, maize, ragi, and cotton. All these crops are affected by exposure to high levels of ozone. There has not been any scientific analysis or study to determine the exact loss in these crops from exposure to high levels of ozone in this area. Based on the laboratory experiments, 10-65% loss in cotton and 20-40% loss in rice crop is expected. Similarly, no studies are available on number of people affected by exposure to high levels of ozone or severity in their respiratory illnesses. 2

7 Fact Sheet 3 of 10: Hotspots - Delhi The Delhi region is spread over all the land between 25º N to 30º N and 75º E to 79.5º E. This region covers parts of Uttar Pradesh (UP), Haryana, and Rajasthan. Population density in this region is Delhi 9294 persons/km 2, Haryana 384 persons/km 2, Rajasthan 165 persons/km 2, and Uttar Pradesh 472 persons/km 2. This figure shows the number of days when the average daytime ozone concentration during January 15 to May 29, 2000 (135 days) was higher than 60 ppbv in the region. The whole region is divided into 100 parts of 60 x 60 km area. Blue numbers indicate the number of days that the daytime average ozone concentration was between 80 and 89 ppbv; green refers to the number of days that the daytime average was between 70 and 79 ppbv; and purple expresses the number of days that the daytime average was between 60 and 69 ppbv. In the space between 28º N to 28.5º N and 77º E to 77.5º E, which includes Delhi (13 million population), there were 17 days when the daytime average ozone concentration was between ppbv, and there were 8 days when the concentration reached ppbv. In the space between 27º N to 27.5º N and 75.5º E to 76º E, which includes Jaipur (more than 3 million population), there were 41 days when the daytime average ozone concentration was between ppbv, and there were 6 days when the concentration reached ppbv; also, there was 1 day when the ozone concentration reached ppbv. Similarly in the region between 27º N to 27.5º N and 78º E to 78.5º E, which includes Agra (between 3 and 4 million population), there were 31 days when the daytime average ozone concentration was between ppbv, and there were 10 days when the concentration reached ppbv; also, there was 1 day when the ozone concentration reached ppbv. Ozone levels are highest in the area between 25º N to 28º N and 77.5ºE to 80º E (UP). In this area there are days when ozone levels are above 80 ppbv, and this is considered harmful for human health also. Main crops in this area are wheat, rice, maize, different kinds of beans, and sugar cane. All these crops are affected by exposure to high levels of ozone. There has not been any scientific analysis or study to determine the exact loss in these crops from exposure to levels of ozone in this area. Based on the laboratory experiments, a 10-30% loss in wheat, 10-35% loss in beans, and 20-40% loss in rice crop is expected. Similarly, no studies are available on number of people affected by exposure to high levels of ozone or severity in their respiratory illnesses. 3
8 Fact Sheet 4 of 10: Hotspots - Hyderabad The Hyderabad region covers the land between 15º N to 20º N and 75º E to 80º E. This region covers parts of Andhra Pradesh (AP), Karnataka, and Maharastra. Population density in this region is AP 275 persons/km 2, Karnataka 275 persons/km 2, and Maharastra 314 persons/km 2. This figure shows the number of days when the average daytime ozone concentration during January 15 to May 29, 2000 (135 days) was higher than 60 ppbv in the region. The whole region is divided into 100 parts of 60 x 60 km area. Blue numbers indicate the number of days that the daytime average ozone concentration was between 80 and 89 ppbv; green refers to the number of days that the daytime average was between 70 and 79 ppbv; and purple expresses the number of days that the daytime average was between 60 and 69 ppbv. In the space between 17º N to 17.5º N and 78º E to 78.5º E, which includes Hyderabad (3.8 million population), there were 24 days when the daytime average ozone concentration was between ppbv, and there were 3 days when the concentration reached ppbv. In the space between 16.5º N to 17º N and 75.º E to 75.5º E, which includes Bijapur (Karnataka), there were 18 days when the daytime average ozone concentration was between ppbv and 4 days when the concentration reached ppbv. Similarly in the region between 19.5º N to 20º N and 78º E to 78.5º E, area near Chandrapur Thermal Power Station in Maharastra, there were 35 days when the daytime average ozone concentration was between ppbv, and 10 days when the concentration reached ppbv. Ozone levels are highest in the area between 17.5º N to 20º N and 77.5ºE to 80º E. Main crops in this area are wheat, rice, and cotton. All these crops are affected by exposure to high levels of ozone. There has not been any scientific analysis or study to determine the exact loss in these crops from exposure to levels of ozone in this area. Based on the laboratory experiments, a 10-35% loss in wheat, 10-65% loss in cotton, and 20-40% loss in rice crop is expected. Similarly, no studies are available on number of people affected by exposure to high levels of ozone or severity in their respiratory illnesses. 4
9 Fact Sheet 5 of 10: Hotspots - Kolkata The Kolkata region is spread over all the land between 20º N to 25º N and 85º E to 90º E. This region covers parts of West Bengal (WB), Orissa, and Bangladesh. Population density in this region is: WB 904 persons/km 2, Orissa persons/km 2, and Bangladesh 1024 persons/km 2. This figure shows the number of days when the average daytime ozone concentration during January 15 to May 29, 2000 (135 days) was higher than 60 ppbv in the region. The whole region is divided into 100 parts of 60 x 60 km area. Blue numbers indicate the number of days that the daytime average ozone concentration was between 80 and 89 ppbv; Green refers to the number of days that the daytime average was between 70 and 79 ppbv; and purple expresses the number of days that the daytime average was between 60 and 69 ppbv. Thus, in the space between 22º N to 22.5º N and 88º E to 88.5º E, which includes Kolkata (about 13 million population), there were 35 days when the daytime average ozone concentration was between ppbv, there were 17 days when the concentration reached ppbv, 8 days when it was between ppbv, and there were 3 days when the concentration reached above 90 ppbv. In the space between 22º N to 20.5º N and 85.5º E to 86º E, which includes Bhubaneswar (between 1 and 2 million population), there were 29 days when the daytime average ozone concentration was between ppbv, there were 13 days when the concentration reached ppbv; and 6 days when it was between 80 and 89 ppbv, also, there were 4 days when the ozone concentration reached above 90 ppbv. Similarly in the region between 23.5º N to 24º N and 88.5º E to 89º E, which includes Rajshahi (Bangladesh), there were 48 days when the daytime average ozone concentration was between ppbv, there were 21 days when the concentration reached ppbv; 10 days when it was between ppbv, also, there was 1 day when the ozone concentration reached above 90 ppbv. Ozone concentration reached more than 90 ppbv for 16 times in the area between 86ºE to 87º E and 20º N to 21º N. Main crops in this area are wheat, rice, jute, and sugar cane. All these crops are affected by exposure to high levels of ozone. There has not been any scientific analysis or study to determine the exact loss in these crops from exposure to high levels of ozone in this area. Effect of ozone on the yield of jute and sugarcane has not been studied. Based on the laboratory experiments, a 10-35% loss in wheat and 20-40% loss in rice crop is expected. Similarly, no studies are available on number of people affected by exposure to high levels of ozone or severity in their respiratory illnesses. 5
10 Fact Sheet 6 of 10: Hotspots - Madhya Pradesh The Madhya Pradesh region covers the area between 20º N to 25º N and 75º E to 80º E. This region includes parts of Madhya Pradesh (MP), and Maharastra. Population density in this region is: MP 196 persons/km 2 and Maharastra 314 persons/km 2. This figure shows the number of days when the average daytime ozone concentration during January 15 to May 29, 2000 (135 days) was higher than 60 ppbv in the region. The whole region is divided into 100 parts of 60 x 60 km area. Blue numbers indicate the number of days that the daytime average ozone concentration was between 80 and 89 ppbv; green refers to the number of days that the daytime average was between 70 and 79 ppbv; and purple expresses the number of days that the daytime average was between 60 and 69 ppbv. In the space between 23º N to 23.5º N and 77º E to 77.5º E, which includes Bhopal (1.8 million population), there were 30 days when the daytime average ozone concentration was between ppbv, and 1 day, the concentration was in the range of ppbv. In the space between 20º N to 20.5º N and 78º E to 78.5º E, which includes Wardha (Maharastra), there were 33 days when the daytime average ozone concentration was between ppbv, and there were 16 days when the concentration reached ppbv; also, there was 1 day when the ozone concentration reached ppbv. Similarly in the region between 20º N to 20.5º N and 75.5º E to 76º E, which includes Ajanta (Maharastra), there were 22 days when the daytime average ozone concentration was between ppbv and 2 days when the concentration reached ppbv. Ozone concentrations are higher in the region between 77.5ºE to 80º E. Main crops in this area are wheat, rice, maize, jowar, cotton, different kinds of beans, and sugar cane. All these crops are affected by exposure to high levels of ozone. There has not been any scientific analysis or study to determine the exact loss in these crops from exposure tohigh levels of ozone in this area. Based on the laboratory experiments, a 10-35% loss in wheat, 10-35% loss in beans, 10 65% loss in cotton, and 20-40% loss in rice crop is expected. Similarly, no studies are available on number of people affected by exposure to high levels of ozone or severity in their respiratory illnesses. 6
11 Fact Sheet 7 of 10: Hotspots - Mumbai The Mumbai region rests in the area between 15º N to 20º N and 70º E to 74.5º E. This region covers parts of Maharastra, Goa, and the Arabian Sea. Population density in this region is Maharastra 314 persons/km 2, Goa 363 persons/km 2. This figure shows the number of days when the average daytime ozone concentration during January 15 to May 29, 2000 (135 days) was higher than 60 ppbv in the region. The whole region is divided into 100 parts of 60 x 60 km area. Blue numbers indicate the number of days that the daytime average ozone concentration was between 80 and 89 ppbv; Green refers to the number of days that the daytime average was between 70 and 79 ppbv; and purple expresses the number of days that the daytime average was between 60 and 69 ppbv. In the area between 18.5º N to 19º N and 72.5º E to 73º E, which includes Mumbai (more than 18 million population), there were 16 days when the daytime average ozone concentration was between ppbv. In the space between 18º N to 18.5º N and 73.5º E to 74º E, which includes Pune (more than 4.5 million population), there were 19 days when the daytime average ozone concentration was between ppbv and 6 days when the concentration reached ppbv. Ozone concentrations are higher over the water of the Arabian Sea than over the adjoining land. In the area between 18º N to 18.5º N and 72º E to 72.5º E, near the Murud town, there were 17 days when the daytime average ozone concentration was between ppbv, 14 days when the concentration reached ppbv; and 4 days when it was between ppbv, also, there were 2 days when the ozone concentration reached 90+ ppbv. Main crops in this area are wheat, rice, cotton, and sugar cane. All these crops are affected by exposure high levels of ozone. There has not been any scientific analysis or study to determine the exact loss in these crops from exposure to high levels of ozone in this area. Based on the laboratory experiments, a 10-35% loss in wheat, 10-65% loss in cotton, and 20-40% loss in rice crop is expected. No studies are available on the effects of exposure to high ozone concentrations on sea food. Similarly, no studies are available on number of people affected by exposure to high levels of ozone or severity in their respiratory illnesses. 7
12 Fact Sheet 8 of 10: Hotspots - Orissa The Orissa region is somewhat larger, spanning 15º N to 20º N and 80º E to 85º E. This region covers parts of Andhra Pradesh (AP), Orissa, and the Bay of Bengal. Population density in this region is AP 275 persons/km 2 and Orissa 236 persons/km 2. This figure shows the number of days when the average daytime ozone concentration during January 15 to May 29, 2000 (135 days) was higher than 60 ppbv in the region. The whole region is divided into 100 parts of 60 x 60 km area. Blue numbers indicate the number of days that the daytime average ozone concentration was between 80 and 89 ppbv; green refers to the number of days that the daytime average was between 70 and 79 ppbv; and purple expresses the number of days that the daytime average was between 60 and 69 ppbv. In the space between 19º N to 19.5º N and 83.5º E to 84º E, which includes Ramagiri-Udayagiri (Orissa), there were 22 days when the daytime average ozone concentration was between ppbv, 14 days when the concentration reached ppbv, also, there was 1 day when the ozone concentration reached ppbv. In the space between 17.5º N to 18º N and 83º E to 83.5º E, which includes Vishakhapatnam (AP), there were 14 days when the daytime average ozone concentration was between ppbv, 12 days when the concentration reached ppbv; also, there were 5 days when the ozone concentration reached ppbv. Similarly in the region between 17º N to 17.5º N and 81.5º E to 82º E, which includes Rajahumundry (AP), there were 14 days when the daytime average ozone concentration was between ppbv, 2 days when the concentration reached ppbv; also, there was 1 day when the ozone concentration reached ppbv In the area between 18º N to 18.5º N and 84º E to 84.5º E, which covers water of the Bay of Bengal, ozone concentration reached above the 90 ppbv mark a total of 3 times over the 135 day period, and 7 times in the ppbv range. This area also had ozone levels in the ppbv range for 11 days, and the ppbv range for 21 days. The area within Orrisa with the highest prevalence of hotspots in the 135 day time period fell between 83.5º E to 85º E and 17.5º N to 18.5º N.. Main crops in this area are wheat, rice, ragi, and jowar. All these crops are affected by exposure to high levels of ozone. There has not been any scientific analysis or study to determine the exact loss in these crops from exposure to high levels of ozone in this area. Based on the laboratory experiments, a 10-35% loss in wheat and 20-40% loss in rice crop is expected. Similarly, no studies are available on number of people affected by exposure to high levels of ozone or severity in their respiratory illnesses. 8
, Jammu and Kashmir, and small parts of China.")
13 Fact Sheet 9 of 10: Hotspots - Punjab The Punjab region is spread over all the land between 30º N to 35º N and 75º E to 80º E. This region covers parts of Punjab, Himachal Pradesh (HP), Jammu and Kashmir, and small parts of China. Population density in this region is Punjab 482 persons/km 2, Himachal Pradesh 109 persons/km 2, and Jammu and Kashmir 99 persons/km 2. This figure shows the number of days when the average daytime ozone concentration during January 15 to May 29, 2000 (135 days) was higher than 60 ppbv in the region. The whole region is divided into 100 parts of 60 x 60 km area. Blue numbers indicate the number of days that the daytime average ozone concentration was between 80 and 89 ppbv; green refers to the number of days that the daytime average was between 70 and 79 ppbv; and purple expresses the number of days that the daytime average was between 60 and 69 ppbv. In the space between 30.5º N to 31º N and 75.5º E to 76º E, which includes Patiala (Punjab), there were just 5 days when the daytime average ozone concentration was between ppbv, otherwise ozone concentration was always below 60 ppbv during this period. In the space between 32.5º N to 33º N and 77º E to 77.5º E, near Dharmsala (Himachal Pradesh), there were 38 days when the daytime average ozone concentration was between ppbv, and there were 5 days when the concentration reached ppbv. Similarly in the region between 34.5º N to 35º N and 78º E to 78.5º E, near Leh (Jammu and Kashmir), there were 38 days when the daytime average ozone concentration was between ppbv, and there were 12 days when the concentration reached ppbv. Ozone levels are highest in the area between 33º N to 35º N and 77.5ºE to 80º E. In this area there are days when ozone levels are above 80 ppbv, and this is considered harmful for human health also. Main crops in this area are wheat, rice, maize, and sugar cane. All these crops are affected by exposure to high levels of ozone. There has not been any scientific analysis or study to determine the exact loss in these crops from exposure to high levels of ozone in this area. Based on the laboratory experiments, a 10-30% loss in wheat, 10-35% loss in beans, and 20-40% loss in rice crop is expected. Similarly, no studies are available on number of people affected by exposure to high levels of ozone or severity in their respiratory illnesses. 9
, Nepal, and part of China s Himalayan region.")
14 Fact Sheet 10 of 10: Hotspots - Varanasi The Varanasi region is spread over all the land area between 25º N to 30º N and 80º E to 85º E. This region covers parts of Uttar Pradesh (UP), Nepal, and part of China s Himalayan region. Population density in this region is: Uttar Pradesh 472 persons/km 2, Nepal persons/km 2, and China persons/km 2. This figure shows the number of days that the average daytime ozone concentration during January 15 to May 29, 2000 (135 days) was higher than 60 ppbv in the region. The whole region is divided into 100 parts of 60 x 60 km area. Blue numbers indicate the number of days that the daytime average was between 80 and 89 ppbv; green refers to the number of days that the daytime average was between 70 and 79 ppbv; and purple expresses the number of days where daytime average was between 60 and 69 ppbv. In the space between 25º N to 25.5º N and 82.5º E to 83º E, which includes Varanasi (between 3 and 4 million population), there were 55 days when the daytime average ozone concentration was between 60-69, there were 30 days when the concentration reached 70-79, and 1 day when the concentration was between ppbv. In the space between 26º N to 26.5º N and 80º E to 80.5º E, which includes Kanpur (more than 4 million population), there were 57 days when the daytime average ozone concentration was between 60-69, 14 days when the concentration reached 70-79; also, there was 1 day when the ozone concentration reached ppbv. Similarly in the region between 28.5º N to 29º N and 84º E to 84.5º E, which is part of Nepal (23.1 million population), there were 43 days when the daytime average ozone concentration was between 60-69, and there were 32 days when the concentration reached 70-79; also, there were 5 days when the ozone concentration reached ppbv, and there was 1 day when ozone levels were above 90 ppbv. Ozone levels are highest in the area between 28.5º N to 30º N and 82.5ºE to 85º E (Nepal and part of China). Main crops in this area are wheat, rice, maize, potato, and sugar cane. All these crops are affected by exposure to high levels of ozone. There has not been any scientific analysis or study to determine the exact loss in these crops from exposure to high levels of ozone in this area. Based on the laboratory experiments, a 10-35% loss in wheat, 5-10% loss in potato, and 20-40% loss in rice crop is expected. Similarly, no studies are available on number of people affected by exposure to high levels of ozone or severity in their respiratory illnesses. 10


15 Summary Ozone is a pale blue gas with a strong odor. Tropospheric ozone is toxic to all living things that breathe it or come in contact with it, including human beings and plants. At the same time, tropospheric ozone is like an intercontinental traveler, crossing geographic and political boundaries. Where ozone forms and where it travels have become key concerns for health and economic policy-making. Understanding the chemical and physical dynamics of ozone and other trace gases is becoming increasingly urgent as world population rises and economic activity increases among developing nations. The lifetime of ozone precursors in the troposphere is long enough to produce ozone hundreds or even thousands of miles away. This ozone production occurs before further chemical reactions transform ozone into oxygen and other species. It is imperative that governments adopt a holistic perspective when designing a strategy to meet regional and local ambient air quality objectives. ozone levels over the entire Indian region. Ozone measurements have been reported at a few sites in India, but these are mostly expedition type, except for the continuous measurements at the National Physical Laboratory, New Delhi, Indian Meteorological Department, and the Physical Research Laboratory, Ahmedabad. A systematic detailed study is needed to evaluate the effects of exposure to surface ozone on human health and crop yields. Atmospheric Modeling Chemical and physical dynamics of ozone The U.S. Environmental Protection Agency (EPA) has designated ozone as one of six criteria air pollutants. In India, recent measurement studies have shown that surface ozone levels are at critical levels and rising. An integral part of studying complex atmosphere is using computer models where chemistry and dynamics are simulated by mathematical equations. Present research, based on computer models as described in the coversheet, has enabled us to estimate the prevailing surface Ozone damage to human beings occurs without any noticeable signs. Otherwise healthy people can expect to experience acute but reversible effects from exposure to high levels of ozone. A database needs to be created for people with respiratory illnesses, and then the database should correlate these illnesses with the ozone levels in the area where these people live and work. Health effects of ozone

16 Summary (continued) A National Crop Loss Assessment Network (NCLAN) research study in India should be initiated to assess the losses from increased levels of surface ozone. Agricultural researchers in India need to study ozone s effects on major crops which include wheat, rice, cotton, soybeans, and sugarcane that are important to India s agricultural economy. Crops exposure to ozone appears in soil and plants; overexposure specifically effects plant growth and soil fertility. Most farmers are unaware that increasing ozone concentrations can reduce their crop yields. Leaf effected by ozone Recommendations Increase public awareness of the harmful effects of surface ozone Estimate daily surface ozone concentrations throughout the Indian region by modeling Make continuous measurements of ozone concentrations in metro-cities of India for assessing human exposure and calibration Assess losses in crop yields from exposure to ozone Assess human health vulnerability from exposure to ozone Publicize daily predictions and measured levels of surface ozone in cities and towns, particularly where ozone will be at critical levels (Ozone warning) Evolve mitigation and adaptation strategies
Progress and Potential of Horticulture in India
 Ind. Jn. of Agri.Econ. Vol.63, No.3, July-Sept. 2008 SUBJECT I TRIGGERING AGRICULTURAL DEVELOPMENT THROUGH HORTICULTURE CROPS Progress and Potential of Horticulture in India Ramesh Chand, S.S. Raju and
1 What are three cropping seasons of India? Explain any one in brief. 2 Discuss three main impacts of globalization on Indian agriculture.
 1 What are three cropping seasons of India? Explain any one in brief. 2 Discuss three main impacts of globalization on Indian agriculture. 3.Distinguish between rabi and kharif season? 4. What is Horticulture?
Ozone and trace gases in India: Effects of transport and emissions. Shyam Lal Physical Research Laboratory, Ahmedabad
 Ozone and trace gases in India: Effects of transport and emissions Shyam Lal Physical Research Laboratory, Ahmedabad Second Workshop on Atmospheric Composition and the Asian Monsoon (ACAM), 8-10 June,
Cellulosic Ethanol Emerging Opportunities in India Feb 2015
 Cellulosic Ethanol Emerging Opportunities in India Feb 2015 Safe Harbor Statement This presentation and its related comments contain forwardlooking statements, including financial expectations. Forward-looking
IMPACT OF AIR POLLUTION ON AGRICULTURE
 IMPACT OF AIR POLLUTION ON AGRICULTURE GUFRAN BEIG Program Director -SAFAR Indian Institute of Tropical Meteorology, Pune Ministry of Earth Sciences, INDIA OUTLINE OF TALK 1. Why Agriculture should care
Economic implications of land degradation on sustainability and food security in India
 Agropedology 23, 13(2), 19-27 Economic implications of land degradation on sustainability and food security in India A. K. VASISHT, R. P. SINGH AND V. C. MATHUR Division of Agricultural Economics, Indian
6. LAND RESOURCES : AGRICULTURE
 6. LAND RESOURCES : AGRICULTURE 38 MT EDUCARE LTD. Q.1 (A) Choose the correct alternative from the brackets and rewrite the statements : 1. India ranks... in the world regarding area under cultivation.
Quality of Water and Water Related Diseases in Urban Areas
 5.1.2 Incidence of water borne diseases in states of India The water borne diseases in India are occurring over the years despite various water quality management plans by the Government of India. Regardless
Indian Poultry Market Update
 Indian Poultry Market Update Billion Indian Poultry Market Overview 2 1,100 1,000 900 Indian Poultry Market by Value; 2010-16 900 1,000 800 700 600 500 400 Source: Company Reports 470 2010 2013 2016 Exports
Criteria Pollutants. Sulfur Dioxide (SO 2 ) Nitrogen Oxides (NOx)
 Nitrogen Oxides (NOx)") 1) Sulfur dioxide 2) Nitrogen oxides 3) Carbon monoxide 4) Ozone 5) Particulates 6) Lead Criteria Pollutants Sulfur Dioxide (SO 2 ) SO 2 is a colorless gas that is formed from the combustion of sulfur-containing
1) Sulfur dioxide 2) Nitrogen oxides 3) Carbon monoxide 4) Ozone 5) Particulates 6) Lead Criteria Pollutants Sulfur Dioxide (SO 2 ) SO 2 is a colorless gas that is formed from the combustion of sulfur-containing
Instruction for filling the AIN application form
 Instruction for filling the AIN application form 1. Form is to be filled legibly in ENGLISH in BLOCK LETTERS. 2. While filling the form, each box, wherever provided, should contain only one character (alphabet/number/punctuation
IMPO P RT R AN A C N E C E O F G RO R UN U D N W
 Introduction IMPORTANCE OF GROUNDWATER Global Groundwater Situation ACWADAM s database Sources for presentation CGWB, various publications FAO-database Various United Nations publications. UN World Water
Page 1 of 6. Agriculture. I. Answer the Following
 Agriculture Page 1 of 6 I. Answer the Following Q1. What is the importance of agriculture in the Indian economy? Ans. Two-thirds of India s population is engaged in agricultural activities. Agriculture
Name: Class: Date: 6. Most air pollution is produced by a. thermal inversions. c. ozone layer depletion. b. fuel burning. d. volcanic eruptions.
 Name: Class: Date: Air Test Multiple Choice Identify the choice that best completes the statement or answers the question. 1. Which of the following is often used to remove poisonous gases from industrial
The Good, the Bad, and the Ugly of Ozone
 Name: Date: Period: Background The Good, the Bad, and the Ugly of Ozone Ozone (O 3 ) is colorless and consists of three oxygen atoms (the third oxygen makes it highly reactive). There are two main types
Trends and Patterns of Urbanization in India: A State Level Analysis
 International Journal of Humanities and Social Science Invention ISSN (Online): 2319 7722, ISSN (Print): 2319 7714 Volume 3 Issue 6ǁ June. 2014ǁ PP.09-17 Trends and Patterns of Urbanization in India: A
SCENARIO OF GOAT SECTOR: MAHARASHTRA STATE (INDIA)
") SCENARIO OF GOAT SECTOR: MAHARASHTRA STATE (INDIA) Goat keeping is spread over all parts of the state. On goat rearing approximately 48 lakhs families are engaged. Goat rearing is highly preferred occupation
SCENARIO OF GOAT SECTOR: MAHARASHTRA STATE (INDIA) Goat keeping is spread over all parts of the state. On goat rearing approximately 48 lakhs families are engaged. Goat rearing is highly preferred occupation
History of significant air pollution events
 Ch17 Air Pollution A thick layer of smoke and haze covers Santiago, Chile. History of significant air pollution events Many of the worst air pollution episodes occurred in the last two centuries in London
Status of Poverty in India A State wise Analysis
 Status of Poverty in India A State wise Analysis Dr Waheeda Sunny Thomas Faculty Economics, SEMCOM, Gujarat, India ABSTRACT First millennium development goal is to eradicate extreme poverty and hunger.
Section 4 The Air We Breathe
 Section 4 The Air We Breathe Key Concept Air is an important natural resource that is affected by human activities. What You Will Learn Air pollution is caused by human activities, such as burning fossil
Regional Pattern of Agricultural Growth and Rural Employment in India: Have Small Farmers Benefitted?
 Agricultural Economics Research Review Vol. 26 (Conference Number) 2013 pp 1-11 Regional Pattern of Agricultural Growth and Rural Employment in India: Have Small Farmers Benefitted? M.L. Nithyashree* and
International Journal of Commerce and Business Management. Volume 5 Issue 2 October,
 IJCBM Volume 5 Issue 2 October, 2012 159-163 International Journal of Commerce and Business Management RESEA RCH PAPER Growth trends in area, production and export of onion from India -An economic analysis
Output and Employment Growth in Registered Manufacturing Industries in India: Testing Kaldor s Hypothesis
 Output and Employment Growth in Registered Manufacturing Industries in India: Testing Kaldor s Hypothesis Dr. Panchanan Das Taki Government College West Bengal This paper carries out GMM estimation in
STATISTICAL EVALUATION OF AGRICULTURAL DEVELOPMENT IN ASIAN COUNTRIES
 STATISTICAL EVALUATION OF AGRICULTURAL DEVELOPMENT IN ASIAN COUNTRIES Bhatia, V.K. Indian Agricultural Statistics Research Institute Library Avenue, Pusa, New Delhi-110012 (INDIA) E-mail: vkbhatia@iasri.res.in
GOVERNMENT OF INDIA MINISTRY OF ENVIRONMENT, FOREST AND CLIMATE CHANGE. LOK SABHA STARRED QUESTION No. 334 TO BE ANSWERED ON
 GOVERNMENT OF INDIA MINISTRY OF ENVIRONMENT, FOREST AND CLIMATE CHANGE LOK SABHA STARRED QUESTION No. 334 TO BE ANSWERED ON 09.08.2016 Ecological Impact of Mining *334. SHRI JANARDAN SINGH SIGRIWAL state:
JICA s Support to India (Forestry Sector)
") JICA s Support to India (Forestry Sector) January 6, 2015 JICA India office 1 Introduction of JICA Japan International Cooperation Agency President: Akihiko Tanaka Establishment: August 1974 and Reorganized
JICA s Support to India (Forestry Sector) January 6, 2015 JICA India office 1 Introduction of JICA Japan International Cooperation Agency President: Akihiko Tanaka Establishment: August 1974 and Reorganized
1 Characteristics of the Atmosphere
 CHAPTER 22 1 Characteristics of the Atmosphere SECTION The Atmosphere KEY IDEAS As you read this section, keep these questions in mind: What are the layers of Earth s atmosphere? How has Earth s atmosphere
Status, Quality and Management of Groundwater in India
 International Journal of Information and Computation Technology. ISSN 0974-2239 Volume 3, Number 7 (2013), pp. 717-722 International Research Publications House http://www. irphouse.com /ijict.htm Status,
Chapter 4 Agriculture
 Chapter 4 Agriculture Types of Farming Primitive Subsistence Farming Practiced on small patches of land. Involves family/community labour. Uses primitive tools such as hoe, digging sticks etc. Predominance
India. India Grain Voluntary Update - October 2017
 THIS REPORT CONTAINS ASSESSMENTS OF COMMODITY AND TRADE ISSUES MADE BY USDA STAFF AND NOT NECESSARILY STATEMENTS OF OFFICIAL U.S. GOVERNMENT POLICY Voluntary - Public Date: 10/3/2017 GAIN Report Number:
Directions 1. Activate students' prior knowledge about secondary pollutants. 1 of 10. Activitydevelop
 Activitydevelop Pollutants Making More Pollutants How do pollutants interact with the environment to create more pollution, and what effects do secondary pollutants have on the environment and human health?
Indian Pulses Market.
 Indian Pulses Market Indian Pulses Market India is the largest producer, importer and consumer of pulses, accounting for 25% of global production from 35% of global area under pulses. However, the productivity
Smart City Initiative in India: Addressing Climate Change Concerns
 Smart City Initiative in India: Addressing Climate Change Concerns Aashish Deshpande National Institute of Technical Teachers Training & Research, Bhopal, India Manmohan Kapshe Department of Architecture
Facts of PAT Cycle 1 & 2. A Bicon Consultants Report. Bicon Report 12/30/16 Energy Knowledge Hub
 Facts of PAT Cycle 1 & 2 A Bicon Consultants Report Bicon Report 12/30/16 Energy Knowledge Hub About Bicon Consultants: bicon Bicon Consultants is a Chartered Engineering firm, accredited by BEE as an
CDM and NAMA in India
 CDM and NAMA in India looking back (1) and looking forward (2) Mumbai, 8 th of October 2014 Enrico Rubertus Project Director GIZ New Delhi Seite 1 Background The first commitment period of Kyoto Protocol
Climate Change and Ozone Loss
 Climate Change and Ozone Loss During the past 900,000 years, the earth has undergone a series of cold glacial periods followed by warmer interglacial periods. The past 10,000 years has been an interglacial
Announcements. Pollution week continues. Thinking about pollution. Why are polar bears so contaminated?
 Announcements Grades for exam 2 have been posted March 7 th - Last day to submit LEAD summary to TA, extra credit videos due next Tuesday (no late videos will be accepted) Next Thursday, Environmental
Lecture 29 Air Pollution. Air Pollution. Clean Boundary Layer. Clean Boundary Layer
 Lecture 29 Air Pollution Air Pollution Conditions that promote air pollution episodes Ozone Hole Air Pollution Elevated levels of aerosols and harmful gases Most pollution enters atmosphere near the surface.
Drip and Sprinkler Irrigation in India: Benefits, Potential and Future Directions
 Drip and Sprinkler Irrigation in India: Benefits, Potential and Future Directions A.Narayanmoorthy Alagappa University, Karaikudi, Tamil Nadu, India Background Water is becoming increasingly scarce worldwide
Maryland Clean Air Progress Report
 Maryland Clean Air 217 Progress Report In 216, it was hot. Really hot. Maryland experienced the sixth-warmest summer ever recorded. Despite that type of weather -- which usually ushers in high levels of
Atmosphere Web quest
 Atmosphere Web quest 1. What are the four main layers of the atmosphere? Troposphere Stratosphere Mesosphere Thermosphere Ionosphere Exsosphere 2. Which layer is closest to space? Exosphere (upper layer
Teaching Time: 1 hour and 15 minutes
 Lesson Summary Students will discuss human output of greenhouse gasses and then calculate the amount of CO2 that their family cars produce per gallon. Prior Knowledge & Skills Data interpreting skills
Ozone Impacts on Crop Yields: Regional and Global Assessments and Mitigation Potential Denise L. Mauzerall and Rita Van Dingenen
 Ozone Impacts on Crop Yields: Regional and Global Assessments and Mitigation Potential Denise L. Mauzerall and Rita Van Dingenen with Shiri Avnery, Larry Horowitz, Arlene Fiore, Junfeng Liu, and Frank
GAO AIR POLLUTION. Air Quality and Respiratory Problems in and Near the Great Smoky Mountains. Testimony
 GAO United States General Accounting Office Testimony Before the Subcommittee on Legislative, Committee on Appropriations, House of Representatives For Release on Delivery Expected at 2:00 p.m., Friday,
CHRONIC POVERTY AND SOCIALLY DISADVANTAGED GROUPS: ANALYSIS OF CAUSES AND REMEDIES. Sukhadeo Thorat Motilal Mahamallik
 WORKING PAPER CHRONIC POVERTY AND SOCIALLY DISADVANTAGED GROUPS: ANALYSIS OF CAUSES AND REMEDIES Sukhadeo Thorat Motilal Mahamallik Working Paper 33 CPRC-IIPA Chronic Poverty Research Centre Indian Institite
Challenges of Retailing in India (A Short Note)
") World Bank From the SelectedWorks of Mohammad Amin February, 2010 Challenges of Retailing in India (A Short Note) Mohammad Amin Available at: https://works.bepress.com/mohammad_amin/23/ Challenges of Retailing
World Bank From the SelectedWorks of Mohammad Amin February, 2010 Challenges of Retailing in India (A Short Note) Mohammad Amin Available at: https://works.bepress.com/mohammad_amin/23/ Challenges of Retailing
Chapter 11: Atmosphere
 To get you thinking This is our atmosphere. All life on Earth exists within this tiny protective blanket. Why is the atmosphere important to us? What do you think it does for us? Chapter 11: Atmosphere
GOVERNMENT OF INDIA MINISTRY OF ENVIRONMENT, FOREST AND CLIMATE CHANGE LOK SABHA UNSTARRED QUESTION NO.2282 TO BE ANSWERED ON
 GOVERNMENT OF INDIA MINISTRY OF ENVIRONMENT, FOREST AND CLIMATE CHANGE LOK SABHA UNSTARRED QUESTION NO.2282 TO BE ANSWERED ON 29.11.2016 Common Effluent Treatment Plants 2282. DR. C.GOPALAKRISHNAN: PROF.
THE GREEN BOND IMPACT REPORT
 THE GREEN BOND IMPACT REPORT FY 16-17 PIONEER OF GREEN BONDS IN INDIA www.yesbank.in Environmental Risk Mitigation Annually, projects receiving proceeds from the Green Bonds issued by YES BANK, will potentially
Waste to Energy and Waste Management Market in India
 Waste to Energy and Waste Management Market in India - 2018 Examining Opportunities, Economics, Technologies, Market Trends, Challenges & Outlook E-REP Business & Market Research Series May 2018 Waste
MEAN ANNUAL EXPOSURE OF CHILDREN AGED 0-4 YEARS TO ATMOSPHERIC PARTICULATE POLLUTION
 MEAN ANNUAL EXPOSURE OF CHILDREN AGED 0-4 YEARS TO ATMOSPHERIC PARTICULATE POLLUTION GENERAL CONSIDERATIONS Issues Type of indicator Rationale Issues in indicator design Respiratory disease Exposure (proximal)
MODULE I. Learning Objectives
 MODULE I Learning Objectives To make the students aware of history of air pollution; definition of air pollution and various types of sources and classification of air pollutants. Lecture 1 Lecture 2 Lecture
SWACHH BHARAT MISSION (GRAMIN)
") SWACHH BHARAT MISSION (GRAMIN) Knowledge Exchange Seminar on Sanitation Facilities 10 th September, 2015 Ministry of Drinking Water & Sanitation 60% people globally that defecate in the open reside in
SWACHH BHARAT MISSION (GRAMIN) Knowledge Exchange Seminar on Sanitation Facilities 10 th September, 2015 Ministry of Drinking Water & Sanitation 60% people globally that defecate in the open reside in
Department of Hydrology A Unique School for Hydrological Education in India (Indian Institute of Technology Roorkee)
") Department of Hydrology A Unique School for Hydrological Education in India (Indian Institute of Technology Roorkee) Dr D S Arya Professor & Head Department of Hydrology, Indian Institute of Technology
Department of Hydrology A Unique School for Hydrological Education in India (Indian Institute of Technology Roorkee) Dr D S Arya Professor & Head Department of Hydrology, Indian Institute of Technology
 +91-8079450188 Patel Material Handling Equipment http://www.patelequipmentindia.com/ We Are Leading Manufacturers & Exporters Of Hydraulic Handling Equipment, Drum Handling Equipment, Aluminium Ladder,
Production and Market Arrivals Pattern of Paddy in APMC Bangarpet Karnataka: A Trend Analysis
 Trends in Biosciences 8(9), Print : ISSN 0974-8, 2183-2191, 2015 Production and Market Arrivals Pattern of Paddy in APMC Bangarpet Karnataka: A Trend Analysis SYED RIZWAN AHMED*, T.N. VENKATA REDDY**,
LIBERSALISATION AND POLICIES OF FOOD SECURITY: THE INDIAN EXPERIENCE
 LIBERSALISATION AND POLICIES OF FOOD SECURITY: THE INDIAN EXPERIENCE A background note for presentation at the Meeting of the Ethiopian Economic Association, January 3-5, Addis Ababa Madhura Swaminathan,
CDM Developments in India & Challenges Ahead. Pamposh Bhat Head, GTZ CDM - India Indo German Energy Programme Bureau of Energy Efficiency
 CDM Developments in India & Challenges Ahead Pamposh Bhat Head, GTZ CDM - India Indo German Energy Programme Bureau of Energy Efficiency CDM in India India signed Kyoto Protocol in December, 1997 & ratified
A Study on Farm Households Coping Strategies Against the Impact of Climate Change on Agriculture: A Study in Cuddalore District
 INTERNATIONAL JOURNAL OF BUSINESS MANAGEMENT, ECONOMICS AND INFORMATION TECHNOLOGY Vol. 3, No. 1, January-June 2011: 151-156 A Study on Farm Households Coping Strategies Against the Impact of Climate Change
Pollution of the Yangtze and Ganges Rivers & Air Pollution and Flooding in India and China
 Pollution of the Yangtze and Ganges Rivers & Air Pollution and Flooding in India and China Pollution of the Yangtze and Ganges Rivers & Air Pollution and Flooding in India and China fdsafs The Ganges
Proceedings of the Annual Conference of NEEA held at Dibrugarh, Assam in February POVERTY AND ENVIRONMENTAL DEGRADATION IN RURAL INDIA: A NEXUS
 POVERTY AND ENVIRONMENTAL DEGRADATION IN RURAL INDIA: A NEUS Purusottam Nayak Abstract Inspired by the worldwide debate on the issue, the present paper is a humble attempt to test the nexus between poverty
CH2356 Energy Engineering Wind Power. Dr. M. Subramanian
 CH2356 Energy Engineering Wind Power Dr. M. Subramanian Associate Professor Department of Chemical Engineering Sri Sivasubramaniya Nadar College of Engineering Kalavakkam 603 110, Kanchipuram(Dist) Tamil
Food Sector Fruits & Vegetables
 Food Sector Fruits & Vegetables Sector overview and Industry Structure Trade Statistics Market Size Top companies present in the market Key players Distribution Channels Regulatory Framework Manufacturing
Impact of air pollution on crops in South Asia and southern Africa
 Impact of air pollution on crops in South Asia and southern Africa Patrick Büker, Lisa Emberson and RAPIDC participants Stockholm Environment Institute, Malé Declaration and Air Pollution Information Network
Developing Socio-Economic Scenarios for India
 Developing Socio-Economic Scenarios for India Purnamita Dasgupta Institute of Economic Growth, Delhi National Workshop 1 Objectives To develop alternative socio-economic scenarios that take into consideration
S E A S O N A L COMMODITY INSIGHT
 S E A S O N A L COMMODITY INSIGHT 09 th February 2015 Rice (Non - Basmati) Domestic Scenario India is the second largest producer of rice in the world after China, contributing to about 21.45 per cent
Confederation of Indian Industry. Opportunities in. Fisheries. Sector in India. Ministry of Food Processing Industries. Government of India
 Confederation of Indian Industry Opportunities in Fisheries Sector in India Ministry of Food Processing Industries Government of India Advantage India One of the fastest growing economies in the world
JICA s Experiences towards Better Air
 JICA s Experiences towards Better Air February, 2017 Takema Sakamoto Chief Representative Japan International Cooperation Agency (JICA) India Office Contents 1. About JICA 2. JICA s Approaches to Air Pollution
Environmental Impacts of. Energy Production
 CH2356 Energy Engineering Environmental Impacts of Energy Production Dr. M. Subramanian Associate Professor Department of Chemical Engineering Sri Sivasubramaniya Nadar College of Engineering Kalavakkam
CLIMATE CHANGE AND ACID RAIN. Mr. Banks 7 th Grade Science
 CLIMATE CHANGE AND ACID RAIN Mr. Banks 7 th Grade Science COMPOSITION OF AIR? COMPOSITION OF AIR? 78% Nitrogen 21% Oxygen 0.93% Argon and other noble gases 0.04% carbon dioxide Variable amounts of water
National Ambient Air Quality Standards, Implementation Plans and Public Participation. Laura McKelvey U.S. EPA
 National Ambient Air Quality Standards, Implementation Plans and Public Participation Laura McKelvey U.S. EPA mckelvey.laura @epa.gov Topics What are the NAAQS? Why are they important? What is the air
Labour Demand and Labour-saving Options: A Case of Groundnut Crop in India
 Agricultural Economics Research Review Vol. 24 (Conference Number) 2011 pp 423-428 Labour Demand and Labour-saving Options: A Case of Groundnut Crop in India G. Govindaraj* and A.P. Mishra Directorate
Air Pollution. GEOL 1350: Introduction To Meteorology
 Air Pollution GEOL 1350: Introduction To Meteorology 1 Overview Types and Sources of Air Pollutants Factors That Affect Air Pollution Air Pollution and the Urban Environment 2 Air pollutants are airborne
Tropospheric Ozone Status and Links to Climate Issues
 Tropospheric Ozone Status and Links to Climate Issues David Simpson 1,2, Birthe Marie Steensen 1 Michael Gauss 1 1. Norwegian Meteorological Institute, Oslo, Norway 2. Chalmers University of Technology,
Organic by Design TEXTILE EXCHANGE
 Organic by Design TEXTILE EXCHANGE We work closely with organic cotton producer groups to help build supply and closer value chain relations. Five years of production growth Fiber (mt) Over the past five
GUIDE FOR VAT, SALES TAX & OTHER LEVIES ( Updated On 31st -Jan-17)
") NO. OF INVOICE TYPE OF FORM / PERMIT NO. REQUIRED ENTRY TAX OCTROI CODE SR. COPIES APPLICABLE APPLICABLE FOR TIN NO. INWARD OUTWARD 1 ANDHRA PRADESH 2 VAT FORM-X(600) VAT FORM-X(600) YES* NO 37 2 ANDAMAN
NO. OF INVOICE TYPE OF FORM / PERMIT NO. REQUIRED ENTRY TAX OCTROI CODE SR. COPIES APPLICABLE APPLICABLE FOR TIN NO. INWARD OUTWARD 1 ANDHRA PRADESH 2 VAT FORM-X(600) VAT FORM-X(600) YES* NO 37 2 ANDAMAN
AIR POLLUTION TRAGEDY: A CASE STUDY. {Air & Air Pollution
 AIR POLLUTION TRAGEDY: A CASE STUDY {Air & Air Pollution Why Should You Be Concerned About Air Pollution? You could go days without food and hours without water, but you would last only a few minutes without
Accenture Services Private Limited Corporate Social Responsibility (CSR) Policy
 Policy") Accenture Services Private Limited Corporate Social Responsibility (CSR) Policy Accenture Services Private Limited Corporate Social Responsibility (CSR) Policy Introduction and Background Accenture is
Accenture Services Private Limited Corporate Social Responsibility (CSR) Policy Accenture Services Private Limited Corporate Social Responsibility (CSR) Policy Introduction and Background Accenture is
Air Pollution. Asian Brown Cloud. Developed Countries have reduced emissions recently
 Study Questions 1. Compare and contrast primary vs. secondary pollutants, giving examples of each. 2. Compare and contrast indoor vs. outdoor pollution, listing specific examples and sources of each. 3.
Major Air Pollutants
 Major Air Pollutants 1 Particulate Matter Particulate refers to all substances that are not gases. It can be suspended droplets / solid particles / mixture of two. Size: 100 µm to 0.1 µm and less. Particulates
The Need for Institutional Capacity Building for Developing Solar Rooftop Markets: Experience of the USAID PACE-D TA Program in India
 PARTNERSHIP TO ADVANCE CLEAN ENERGY-DEPLOYMENT (PACE-D) TECHNICAL ASSISTANCE PROGRAM The Need for Institutional Capacity Building for Developing Solar Rooftop Markets: Experience of the USAID PACE-D TA
National Vegetable Initiative for Urban Clusters. Value chain integration, technology dissemination and accessing investments and markets
 National Vegetable Initiative for Urban Clusters Value chain integration, technology dissemination and accessing investments and markets Progress and Prospects Vegetable Initiative for Urban Clusters FPO
Country Resource Assessments: Support for Livestock and Agro-Industrial Waste Program Development
 Country Resource Assessments: Support for Livestock and Agro-Industrial Waste Program Development M2M Expo 2010 in India Miguel Franco, PA Consulting Group for Kurt Roos, Director, Agricultural Methane
Farmer Suicides in India: Levels and Trends across Major States,
 University of Massachusetts - Amherst ScholarWorks@UMass Amherst Economics Department Working Paper Series Economics 2016 Farmer Suicides in India: Levels and Trends across Major States, 1995-2011 Deepankar
Chapter 3 - ATMOSPHERIC TRANSPORT AND MERCURY DEPOSITION
 Chapter 3 - ATMOSPHERIC TRANSPORT AND MERCURY DEPOSITION A. Introduction Mercury is an especially dynamic pollutant because of its unique physical, chemical, and bioaccumulative properties. The volatility
THE COMBUSTION OF HYDROCARBONS. I love the smell of napalm in the morning smells like victory!
 THE COMBUSTION OF HYDROCARBONS I love the smell of napalm in the morning smells like victory! Carbon monoxide is a toxic gas that can be produced during the combustion of a carbon-based fuel such as propane.
ANSWERS: Combustion. 2C3H8(g) + 7O2(g) 6CO(g) + 8H2O(g)
 + 7O2(g) 6CO(g) + 8H2O(g)") ANSWERS: Combustion organic molecule methane equation for complete combustion CH4(g) + 2O2(g) CO2(g) + 2H2O(g) equation for incomplete combustion 4CH4(g) + 5O2(g) 2CO(g) + 2C(s) + 8H2O(g) methanol 2CH3OH(l)
ANSWERS: Combustion organic molecule methane equation for complete combustion CH4(g) + 2O2(g) CO2(g) + 2H2O(g) equation for incomplete combustion 4CH4(g) + 5O2(g) 2CO(g) + 2C(s) + 8H2O(g) methanol 2CH3OH(l)
Hydro & Small Hydro Outlook in India 2017
 Hydro & Small Hydro Outlook in India 217 Evaluating Business Case & Future Scenario of Large & Small Hydro Power Plants in India Report Summary enincon consulting llp, 217, New Delhi, India Enincon s Key
Government of India. Ministry of Communication and Information Technology
 Government of India Ministry of Communication and Information Technology Invitation for Expression of Interest (EOI) For Implementation of August 2015 (The Department of Electronics and Information Technology
Page 1 of 26 (www.unapcaem.org)
") Farm Mechanization in Punjab: Social, Economic and Environmental Implications Gurharminder Singh Sr. Scientific Officer, Punjab State Council for Science & Technology, INDIA Page 1 of 26 () Page 2 of 26
Farm Mechanization in Punjab: Social, Economic and Environmental Implications Gurharminder Singh Sr. Scientific Officer, Punjab State Council for Science & Technology, INDIA Page 1 of 26 () Page 2 of 26
HUMAN IMPACT on the BIOSPHERE part 4
 HUMAN IMPACT on the BIOSPHERE part 4 Charting a course for the Future http://www.claybennett.com/pages2/mistletoe.html ENVIRONMENTAL PROBLEMS DEAD ZONES OZONE DEPLETION ACID RAIN GLOBAL WARMING WASTE http://www.acmecompany.com/stock_thumbnails/13808.greenhouse_effect_2.jpg
MT 154 MT 154 SOCIAL SCIENCE (73) GEOGRAPHY & ECONOMICS PRELIM I PAPER I (E) (Pages 3) Max. Marks : 40
 GEOGRAPHY & ECONOMICS PRELIM I PAPER I (E) (Pages 3) Max. Marks : 40") 03...... 00 MT 5 Seat No. MT 5 SOCIAL SCIENCE (73) GEOGRAPHY & ECONOMICS PRELIM I PAPER I (E) Time : Hours (Pages 3) Max. Marks : 0 Note : (i) All figures are compulsory. Figures to the right indicate
03...... 00 MT 5 Seat No. MT 5 SOCIAL SCIENCE (73) GEOGRAPHY & ECONOMICS PRELIM I PAPER I (E) Time : Hours (Pages 3) Max. Marks : 0 Note : (i) All figures are compulsory. Figures to the right indicate
Global Environment Outlook 5 Environnent for the future we want
 Global Environment Outlook 5 Environnent for the future we want International workshop on Strengthening Planning and Implementation Capacities for Sustainable Development in Post Rio Context 14-16 Nov
Fuzzy Logic for Design of Air Quality Analyser
 uzzy Logic for Design of Air Quality Analyser uzzy Logic for Design of Air Quality Analyser Manjeet Chemistry Department, BRCM CET, Bahal, M.D University, Rohtak, Haryana, India, E-mail: manjeetvijay@rediffmail.com.
Nova Scotia Air Zone Report. Nova Scotia Air Quality Unit, 2015
 Nova Scotia Air Zone Report Nova Scotia Air Quality Unit, 2015 Acronyms AQHI Air Quality Health Index AQMS Air Quality Management System AQU Nova Scotia Environment s Air Quality Unit CAAQS Canadian Ambient
The atmosphere. The atmosphere is layered. Inversions affect air quality 3/2/2015. The sun influences weather and climate
 The atmosphere Chapter 13 Atmosphere Absorbs radiation and moderates climate Transports and recycles water and nutrients Human activity is now changing the amount of some gases CO 2, methane (CH 4 ), ozone
Visible and Invisible Pollutants How do different types of pollutants affect human and environmental health?
 Activitydevelop Visible and Invisible Pollutants How do different types of pollutants affect human and environmental health? Overview Students explore data about the sources and consequences of different