Brussels, 19 July 2012 COUNCIL OF THE EUROPEAN UNION 12747/12 ADD 1. Inte rinstitutional File: 2012/0191 (COD) ENV 630 ENT 182 CODEC 1945 COVER NOTE
|
|
|
- Reynold Higgins
- 6 years ago
- Views:
Transcription

1 COUNCIL OF THE EUROPEAN UNION Brussels, 19 July 2012 Inte rinstitutional File: 2012/0191 (COD) 12747/12 ADD 1 COVER NOTE from: ENV 630 ENT 182 CODEC 1945 Secretary-General of the European Commission, signed by Mr Jordi AYET PUIGARNAU, Director date of receipt: 12 July 2012 to: Mr Uwe CORSEPIUS, Secretary-General of the Council of the European Union No Cion doc.: SWD(2012) 213 final Subject: Commission Staff Working Paper Impact Assessment accompanying the documents Proposal for a Regulation of the European Parliament and of the Council amending Regulation (EC) No 443/2009 to define the modalities for reaching the 2020 target to reduce CO 2 emissions from new passenger cars and Proposal for a Regulation of the European Parliament and of the Council amending Regulation (EU) No 510/2011 to define the modalities for reaching the 2020 target to reduce CO 2 emissions from new light commercial vehicles. Delegations will find attached Commission document SWD(2012) 213 final (part I). Encl.: SWD(2012) 213 final 12747/12 ADD 1 KZV/mp 1 DG E 1B EN
2 EUROPEAN COMMISSION Brussels, SWD(2012) 213 final Part I COMMISSION STAFF WORKING DOCUMENT IMPACT ASSESSMENT Accompanying the documents Proposal for a regulation of the European Parliament and of the Council amending Regulation (EC) No 443/2009 to define the modalities for reaching the 2020 target to reduce CO2 emissions from new passenger cars and Proposal for a regulation of the European Parliament and of the Council amending Regulation (EU) No 510/2011 to define the modalities for reaching the 2020 target to reduce CO2 emissions from new light commercial vehicles {COM(2012) 393 final} {COM(2012) 394 final} {SWD(2012) 214 final} EN EN
3 TABLE OF CONTENTS 1. Procedural Issues and Consultation of Interested Parties Procedural issues External expertise and consultation of interested parties Consultation of the Impact Assessment Board Policy context, problem definition, evaluation of the existing legislation and subsidiarity Policy context The nature of the problem The underlying causes of the problem Evaluation of the existing legislation How will the problem evolve? How is the problem likely to evolve without new EU action? The Adaptation to Lisbon Treaty Form and stringency of legislation beyond Who is affected and how? The EU's right to act and justification Objectives Policy Options Methodology Do nothing option Confirmation of feasibility of the 2020 target for LCVs Policy options for the modalities of meeting the car and van targets Policy options for the limit value curve Policy options for other modalities in the Regulations Alternative modalities considered Simplification and reduction of administrative burden Conclusions of the preliminary assessment Adaptation to new test cycle Form and stringency of legislation beyond Assessment of policy options EN 2 EN
4 5.1. Criteria to compare the options Main criteria Detailed aspects of assessment Utility parameter - cars Slope of the limit value curve - cars Utility parameter - vans Slope of the limit value curve - vans Derogations for cars and vans Summary of the economic impacts for cars and vans Summary of the environmental impacts for cars and vans Summary of the social impacts for cars and vans How do the main options compare in terms of effectiveness, efficiency and coherence? Comparison of options Monitoring and Evaluation Core indicators of progress Monitoring arrangements Annexes (see Part II of the Document) EN 3 EN
5 COMMISSION STAFF WORKING DOCUMENT IMPACT ASSESSMENT Accompanying the documents Proposal for a regulation of the European Parliame nt and of the Council amending Regulation (EC) No 443/2009 to define the modalities for reaching the 2020 target to reduce CO2 emissions from new passenger cars and Proposal for a regulation of the European Parliame nt and of the Council amending Regulation (EU) No 510/2011 to define the modalities for reaching the 2020 target to reduce CO2 e missions from ne w light comme rcial vehicles Introduction Regulation (EC) 443/2009 and Regulation (EU) 510/2011 set mandatory fleet-based CO 2 reduction targets for the new car and van fleets respectively. They are the main tools of the 2007 Strategy to reduce Light Duty Vehicle (LDV) CO 2 emissions. The Regulations include two reduction steps: short-term targets phased-in from 2012 to 2015 for cars and 2014 to 2017 for vans; and long-term targets to be met in Article 13(5) of Regulation (EC) 443/2009 and Article 13(1) of Regulation (EU) 510/2011 request the Commission to review the "modalities" 1 of achieving the targets set for cars and vans for 2020 and to make proposals to amend the Regulations in a way that is "as neutral as possible from the point of competition, socially equitable and sustainable". 2 The Commission is also asked to assess the feasibility of attaining the 2020 target for vans. As part of this review, the Commission could consider alternative car and van CO 2 targets for Several stakeholders, mainly environmental NGOs, component suppliers and many individuals who took part in the public consultation, argued that the 2020 targets should be tightened. In view of the updated cost curves, and in the case of vans lower baseline emissions compared to those assumed in the original proposal, more ambitious 2020 targets could be considered, in particular for vans. However, neither of the Commission's original proposals contained a target for 2020, these were introduced and agreed during the co-decision process. That process was fairly recent: the 2020 car target was established three years ago, the van target one year ago. Establishing these targets involved balancing at a political level many varying interests and the outcome of the political process sent an important signal to industry. It would be extremely destabilising to propose alternative values so soon after the current values have been agreed. Doing so would effectively undermine the value of any new longterm targets that are set, since it would send a signal that these too might be altered after a few years. 1 2 A glossary of this and other terms is set out in Annex 7.1.Error! Reference source not found. Article 13(5) of Regulation (EC) 443/2009 and Article 13(1) of Regulation (EU) 510/2011 EN 4 EN
6 While manufacturers can relatively easily adapt vehicle specifications and alter incentives so as to affect their average sales emissions, the less time that is available for this, the more costly would be any change. More substantial adaptations of the target could require longer lead times for product planning. For vans, there is an additional uncertainty relating to the implementation of a procedure to measure emissions from multi-stage vehicles 3 which is currently under development. It is also clear that the stringency of any future targets beyond 2020 and how the manufacturers choose to meet them may have direct implications on the average 2020 emissions from vans. In view of these considerations, in particular the fact that any change to the targets would undermine manufacturer certainty, the current review and this Impact Assessment do not consider any alteration to the level of the 2020 car and van CO 2 targets. However, in view of the benefits of planning certainty for industry, the need for an understanding of developments beyond 2020 and potential future is discussed. 1. PROCEDURAL ISSUES AND CONSULTATION OF INTERESTED PARTIES 1.1. Procedural issues The review of the car and van Regulations is a strategic initiative on the 2012 Commission Work Programme 2012/CLIMA/016. The Impact Assessment Steering Group (IASG) established in July 2011 was composed of the following DGs: COMP, ECFIN, ENER, ENTR, ENV, LS, MOVE, RTD, SANCO, SG, TAXUD. Five meetings of the IASG took place between July 2011 and April External expertise and consultation of inte rested parties External expertise Two external studies 4 have provided the main analysis underlying this impact assessment. These are: 'Support for the revision of Regulation (EC) 443/2009 on CO 2 emissions from cars' 5 referred to as 'the car study' and 'Support for the revision of Regulation (EU) 510/2011 on CO 2 emissions from light commercial vehicles' 6 referred to as 'the van study'. Both reports present an evaluation of different modalities and assess their costs. The PRIMES-TREMOVE model has been used to assess the overall impacts of the 2020 targets. Consultation of interested parties Stakeholders have been formally consulted through an online questionnaire and through a stakeholder meeting. In addition there has been a continuing dialogue with interested stakeholders in bilateral meetings. Input from stakeholders has been taken into account in assessing the different possible options to regulate CO 2 emissions from light-duty vehicles, Multi-stage vehicles are vans that are sold as chassis-cabin combinations only and are completed with a dedicated build-up after the vehicles are sold by manufacturers to final users or third companies installing these build-ups. These structures are often constructed to buyers' specifications. Under framewo rk contract ENV.C.3/ FRA/ 2009/0043 on vehicle emissions EN 5 EN
7 particularly with regard to the design of the legislation, possible unwanted effects, and implications for competition on automotive markets, global industrial competitiveness and environmental outcome. External expertise was used to assess the various options available including aspects raised during the consultation process (the external contractor attended the public hearing). Public consultation An on-line public consultation was carried out between 19 September and 9 December 2011 (12 weeks). A total of 3233 replies were received including 137 stakeholder organisations. The majority of responses came from three Member States (UK, DE, FR). Overall the responses give a generally clear message that regulating LDV emissions is important, should be carried out in line with long term greenhouse gas (GHG) goals, be based on new vehicle average emissions and be technologically neutral. Opinion was highly divided on whether the current legislation is working well. The main reason appears to be that many think that the current legislation is not sufficiently robust. There is strong support for setting targets beyond 2020, regardless of other measures that may be implemented, and that these should consider the whole energy lifecycle and include other GHGs, not just CO 2. Finally there was support for considering alternative approaches to vehicle based GHG regulation either now or in the future. The results of the public consultation are summarised in Annex 7.2. Stakeholder meeting A stakeholder meeting was held on 6 December 2011 with 76 participants. The list of participants is given in Annex 7.3. The completed car study and the preliminary conclusions of the van study 7 were presented as well as an outline of the work that will be carried out looking beyond Participants did not express any substantial disagreement with the analysis presented. Environmental NGOs argued that since costs are lower than had previously been thought, and in the case of vans emissions are substantially lower than anticipated, the targets should be tightened. Regarding regulation post-2020, there was acknowledgement of the contradiction between industry's need for certainty versus the difficulty of knowing what level of CO 2 reductions may be cost effective. Setting out a pathway forwards in line with the EU's long term GHG reduction goals was largely supported. Participants generally recognised the necessity to consider whether the current regulatory approach is optimal or will need to be changed in future, although no stakeholder took a definitive position on this. The presentations from the meeting are at along with a summary of the discussion, the latter is attached in Annex Cons ultation of the Impact Assessment Board A draft Impact Assessment was submitted to the Impact Assessment Board (IAB) on 25 April 2012 which issued its opinion on the document on 23 May The opinion stated that the Impact Assessment should strengthen the problem definition by providing a more detailed policy context, focussing more on the underlying problem drivers and presenting thoroughly the evolution of the situation without new EU action. The IAB recommended establishing a clearer intervention logic by better linking the problems, their drivers, objectives and policy options. The objectives were recommended to be made SMARTer. Futhermore, the IAB 7 These preliminary conclusions were subsequently confirmed and included in the final report published on DG CLIMA's website (see footnote 6). EN 6 EN
8 concluded that a more substantiated and differentiated impact analysis were needed. Finally, some aspects regarding future monitoring and evaluation arrangements were to be clarified. These comments were taken into account in the resubmitted Impact Assessment as follows: Restructuring of text and further clarifications regarding the nature of the problem, the underlying drivers and the policy context resulting in a more consistent problem definition, SMARTer objectives and clearer intervention logic. The description of the baseline scenario was restructured and extended to better explain the evolution of the current situation without the new EU action. The presentation of options has been clarified and the impact analysis and presentation have been restructured to assist readability and enhance the link with the objectives. The description of monitoring arrangements has also been strengthened. Additional information has been presented on the under-valuation of light-weighting with a mass-based utility parameter. A glossary of technical terms has been added. The IAB gave its final opinion on 12 June The final opinion requested that some aspects be further strengthened. In particular this concerns explaining the intervention logic, quantifying the objectives, explaining the balance between social, enviornmental and economic impacts and further explaining the monitoring arrangements. These comments have been taken into account in the final Impact Assessment as follows: Addition of a graphic illustrating the intervention logic. Changes to the objectives to include the 2020 CO 2 targets and footnotes explaining how social equity and inter-manufacturer competition are measured. A further explanation of why the main impacts from the options for the modalities will be economic as opposed to social or environmental. Additional text explaining how the annual monitoring process enables the required evaluation of progress. EN 7 EN
9 2. POLICY CONTEXT, PROBLEM DEFINITION, EVALUATION OF THE EXISTING LEGISLATION AND SUBSIDIARITY 2.1. Policy context General policy context The review of the Regulations takes place in the following policy context: The EU has a stated objective of limiting global climate change to a temperature increase of 2ºC above pre-industrial levels. While emissions from other sectors are generally falling road transport is one of the few sectors where emissions have risen rapidly. Between 1990 and 2008 emissions from road transport increased by 26%. The Commission 'Roadmap for moving to a competitive low carbon economy in 2050' 8 outlines a plan to meet the long-term target of reducing domestic emissions by 80% by mid-century in the most cost-effective way. According to the Roadmap and the underlying analysis every sector of the economy must contribute and, depending on the scenario compared to 1990, transport emissions need to be between +20 and - 9% by 2030 and decrease by 54-67% by 2050 (excluding international maritime emissions). The Commission's 'Roadmap to a Single European Transport Area Towards a competitive and resource efficient transport system' sets out future transport strategy within a frame of achieving a 60% reduction in transport GHG emissions by The EU is committed to innovation and boosting industrial competitiveness. Research and innovation drive productivity growth and industrial competitiveness. A transition towards a sustainable, resource efficient and low carbon economy is paramount for maintaining the long-term competitiveness of European industries. In view of the concerns of increasing scarcity of oil and increasing price volatility, measures that further reduce energy consumption in transport are desirable for increasing the energy security of the EU. A detailed description of the general policy context for the review is set out in Annex 7.5. Specific policy context Implementation of the 2020 targets by defining the "modalities" to reach the targets The car and van Regulations function in a similar manner (see Annex 7.6 for a detailed summary of the car and van Regulations). The Regulations include two steps of reduction: short-term targets to be phased-in from 2012 to 2015 for passenger cars and 2014 to 2017 for light commercial vehicles; and long-term targets to be met in For the van Regulation the feasibility of the 2020 target is to be confirmed. For both, cars and vans, the modalities of reaching the 2020 targets must be defined to implement the targets. 8 COM/2011/0112 final EN 8 EN
10 The Regulations contain a number of "modalities" 9 or parameters which impact on how the targets are achieved and may be considered for amendment in view of implementation of the 2020 targets. The following modalities are currently employed: Utility parameter, shape and slope (these together define the limit value curve ); Excess emissions premium; Derogations; Manufacturer pooling; Eco-innovations; Phase-in of targets; Super-credits. The Regulations function by establishing a fleet-average CO 2 emission target for each vehicle manufacturer. This target is calculated by aggregating a nominal CO 2 emission value for each vehicle registered in the EU (in gco 2 /km) which is interpolated from a curve of CO 2 emission versus vehicle mass (the 'limit value curve' where mass is the "utility parameter"). The limit value curve is a function specified in Annex I of the Regulations and is based on vehicle mass. The utility parameter, shape and slope of the function do not have an impact on the stringency of the target but influence the distribution of the reduction effort between vehicles of different utility. The current car and van formulae are based on the short-term target. To implement the 2020 targets it is necessary to introduce, in Annex I to the Regulations, new formulae for 95 gco 2 /km for cars and 147 gco 2 /km for vans. The modalities concerning the limit value curve are therefore considered the most important. A description of the other modalities is given below. The excess emissions premium aims at ensuring compliance with the target. An excess emissions premium is payable in a particular calendar year if the actual average vehicle emissions for a manufacturer's entire fleet are above the manufacturer's target. The Regulations set the premia for both cars and vans at 95 per gco 2 /km as of Without further intervention this premium would remain valid for 2020 and beyond. Derogations allow certain manufacturers (small volume up to 10,000 annual registrations and niche between 10,000 and 300,000 annual registrations) to have targets which are independent of the limit value curve, and in case of the small volume manufacturers are based on their individual reduction potential. For small-volume manufacturers a second five year compliance period to 2020 could be foreseen. However, for niche manufacturers no new post-2015 target is set by the current Regulation. The possibility for manufacturers to form a pool is a flexibility allowing a less costly way to meet the targets. It is neutral as regards the overall stringency of the legislation and the CO 2 reductions achieved. This flexibility is independent from other modalities but its use may be influenced by the limit value curve shape or slope, the utility parameter and the scope for derogations. It is not phased-out thus with no change it would continue in 2020 and beyond. Eco-innovations contribute towards reaching the targets since they cover technologies which reduce CO 2 outside the test procedure. A manufacturer will deploy an eco-innovation only if it is cost-effective thus the provision is expected to reduce overall compliance costs and the existence of the modality encourages innovation. The legislation specifies that this provision 9 See article 13(5) and recital 30 of Regulation (EC) 443/2009, and article 13(1) and recital 30 of Regulation (EU) 510/2011 EN 9 EN
11 should phase-out once the new test-procedure is in place. However, it is likely that there will also be technologies not covered by the new procedure in the future. Phase-in sets a period over which compliance with the target is progressively tightened. This means for example that achieving new car fleet average emissions of 130 gco 2 /km for 100% of the fleet is delayed until Super-credits in principle lower the stringency of the legislation since they effectively allow emissions from vehicles that do not receive them to be higher. These are all phased out before In short, of these modalities the limit value curve is the most important because on its basis the individual manufacturers' targets are calculated. Excess emissions premia, derogations and pooling are significant for manufacturers to whom they apply. The other modalities are considered rather less important The nature of the proble m The need to reduce CO 2 emissions from light-duty vehicles As described in section 2.1, road transport is one of the few sectors with rapidly rising emissions and between 1990 and 2008 emissions from the sector increased by 26%. This trend is not sustainable in view of the EU's climate policy. According to the Commission's 'Roadmap for moving to a competitive low carbon economy in 2050' 10 and Transport White Paper, road transport has to significantly reduce its CO 2 emissions by Light-duty vehicles are responsible for a significant part of the overall transport emissions and emit around 13.5% of total EU emissions of CO 2 and about 15% when the emissions from supplying the fuel are included. In view of the expected increase in the light-duty vehicle fleet (see section 2.3), a continuation of the effective application of the EU mandatory CO 2 targets is necessary to ensure further reduction of road transport emissions of CO 2. The modalities of the 2020 target and planning certainty The two-step approach of the Regulations requires that the Commission proposes detailed modalities of meeting the 2020 targets by end of This necessitates updating the formulae in Annex I to the Regulations for the 2020 targets. In addition, the vans target for 2020 requires confirmation of feasibility. The modalities of meeting the 2020 CO 2 emission limits, and indications of how those limits will evolve beyond 2020, are needed to guide the automotive industry. Without this, uncertainty may discourage investments in innovation and delay bringing new technologies to the market. Because the cost of adapting to change for manufacturers is likely to increase as the time available for them to plan decreases, and in view of the time schedules for vehicle platform and powertrain developments 11, it is important to establish as soon as possible the modalities for The two Regulations leave uncertainty for the period beyond However, the automotive industry works to planning cycles that suggest the need to know approximately ten years in advance the broad framework within which vehicles need to be designed, and a shorter period of around five years for more precise decisions on variants that will actually be produced. It is thus important to provide indications as to the future reductions early enough to allow for appropriate planning certainty COM/2011/0112 final See for example section 5 of the car study EN 10 EN
12 2.3. The unde rlying causes of the problem The overall annual CO 2 emissions from usage of light-duty vehicles are a result of the multiplication of the vehicle stock, the annual mileage of LDVs, and their emissions per km. Therefore, each of these factors has a direct impact on the scale of the problem. Stock of the LDV fleet The number of LDVs in the EU continues increasing. The stock of passenger cars has increased by 45% since 1990 and by 17.5% since There is no evidence to indicate that this trend will stop. The stock of vans increased by 24% between 2000 and but this trend has somewhat stabilised during when new registrations of vans in the EU started decreasing. According to ACEA 14 the most recent decrease especially concerned Spain and Italy, followed by the UK whereas sales in other major markets, such as France and Germany, were more stable. However, a reverse trend is expected to occur once the economic outlook improves and businesses currently deferring new vehicle purchases resume their orders. Distance travelled by light-duty vehicles There is evidence that the average annual distance travelled by LDVs has stabilised. EU transport in figures shows between 2000 and 2009 passenger km per car dropped slightly from 21,000 to 20,000 per year. There could have been a reduction in average load factors, but this suggests little overall change. The ODYSEE project 15 shows figures suggesting that average car distance driven is just above 12,000km per year and has decreased by 750km since The FLEETS study assessed national data for different vehicle categories. Based on this it is possible to produce EU weighted average annual mileages. In the car study these are shown for 2005 as being: Vehicle type Pe trol small Pe trol medium Pe trol large Diesel small Diesel medium Diesel large Total annual mileage (km) Lifetime mileage (km) 14,438 16,772 16,839 23,041 24,574 26, , , , , , ,662 Average life 17 years 17 years 18 years 16 years 15 years 17 years The PRIMES-TREMOVE model assumptions for private car use are broadly consistent with the ODYSEE data, using average annual private car activity of just under 12,000km over the period 2020 to The average annual mileage assumptions used for the cost benefit calculations throughout the Impact Assessment are at the low end of the FLEETS data EU transport in figures; statistical pocketbook 2011 See section of the 2009 Impact Assessment accompanying the proposal for a Regulation setting CO 2 emissions standards for light commercial vehicles; SEC(2009) 1455 ACEA figures on new registrations available at Energy Efficiency Trends in the Transport Sector in the EU, Lessons from the ODYSSEE MURE project; January 2012 EN 11 EN
13 The driving patterns for vans are slightly different than for cars. The FLEETS study shows that vans are mostly used in urban conditions (shorter distances, lower speeds, many restarts and periods of idling) which results in higher fuel consumption and therefore generates more CO 2 emissions than extra-urban, motorway driving. However, the EU average annual mileage of the whole fleet (old and new vehicles) has been found to be similar between cars and vans. This Impact Assessment assumes the average annual mileage of new vans at 23,500 km. Overall, this evidence illustrates that while there is some uncertainty over annual driving distances by LDVs, there is little indication that they are changing significantly. Rebound effects There is risk of a perverse effect from increasing fuel efficiency of vehicles whereby lower fuel costs lead to the vehicles being driven more. This phenomenon is called a rebound effect. This effect could offset some of the tailpipe emission reduction and could be minimised in case of major increases in fuel costs. Regulatory instrumens Taken together, the increasing stock and assumption of constant annual mileage would lead to increasing fuel use and CO 2 emissions without there being a further reduction in LDV emissions per km. The main EU instruments impacting on this problem are the existing Regulations setting CO 2 emission standards for LDVs. At Member State level other policies with an important impact include vehicle circulation and registration tax policies. Fuel taxation is an important factor affecting the problem. Higher levels of taxation would be expected to encourage the purchase of more fuel efficient vehicles. In view of current developments it is clear that EU CO 2 emissions standards are essential to constrain and reduce LDV CO 2 emissions. The two-step approach of the Regulations Finally, the other underlying cause of the problem is that the two LDV CO 2 Regulations have a two-step operation. In the first period (up to 2015 for cars and 2017 for vans) the modalities of compliance with the targets have been established. However for the second phase (2020 in both cases) the formulae in Annex I of the Regulations to incorporate the 2020 targets as well as other modalities are left to be determined in the current review Evaluation of the existing legislation The effectiveness of the legislation The targets in the existing car and van Regulations are phased-in from 2012 and 2014 and enter fully into force in 2015 and 2017 respectively. This means the effectiveness of the legislation with respect to its main goal of reducing CO 2 emissions from new cars and vans cannot be fully evaluated at present. However, based on EU passenger car registration monitoring data it is clear that average new car CO 2 emissions are falling as shown in figure 1 below. EN 12 EN
14 Figure 1 Long term trend in car CO 2 emissions gco 2 /km monitoring target 2020 target Prior to the current CO 2 standards, the European, Japanese and Korean car manufacturers' associations voluntarily agreed to reduce CO 2 emissions to 140 gco 2 /km by 2008 or However, average emissions were still 154 gco 2 /km in 2008 and 146 gco 2 /km in 2009 (see Table 1). The greatest reduction progress has been seen after 2007 when the Commission adopted its proposal for a Regulation on CO 2 emissions from cars (the bottom row of Table 1 shows year on year improvement). This illustrates the need for, and effectiveness of, mandatory CO 2 emissions limits. While part of the reductions in 2009 and 2010 might be due to the financial and economic crisis and scrappage schemes implemented in several Member States in that period, the decreasing trend is evident. Table 1 Average CO 2 emissions from new cars registered in the EU 16 Year grams * CO 2 /km % yearl y change na * Source: 2011 EU monitoring data subject to final confirmation by the Commission Procedures to measure CO 2 from light-duty vehicles Measurement of the CO 2 performance of new cars and vans is carried out as part of the type approval procedure. Tests are carried out by manufacturers on the basis of the New European 16 The data for years was monitored and reported under Decision (EC) 1753/2000 establishing a scheme to monitor the average specific emissions of CO 2 from new passenger cars. Fro m 2010 it is replaced by monitoring and reporting under Regulation (EC) No 443/2009 and its implementing Commission Regulation (EU) No 1014/2010. EN 13 EN
15 Driving Cycle (NEDC) and following the procedures set out in the type-approval legislation. There is growing evidence that vehicle performance under real world driving conditions is increasingly diverging from the test procedure results. More detailed investigations have also illustrated the difficulty of repeating road load measurements carried out by manufacturers which provide a key input to the NEDC test. There are likely to be a range of factors contributing to these divergences which are discussed in more detail in Annex 7.7. In spite of these problems, the Commission does not have evidence that light-duty vehicle test cycle CO 2 results are not correlated with real world CO 2 emissions. Addressing the problems inherent with the test procedures is outside of the scope of the current review and this Impact Assessment. The Commission is working to develop a better understanding of the factors contributing to the divergence, in particular where this results from flexibility inherent in the mandated procedures. In particular it is important to ensure that any updates to the test procedures result in no greater flexibility or margins with regard to measurement of CO 2 emissions. While challenges to ensure that measured CO 2 emissions better reflect real driving emissions remain, the fact that test results are still correlated with real world emissions ensures that the Regulation continues to work appropriately. In view of this it is concluded that the underlying basis for the regulatory approach is robust. Implementation of the car and vans Regulations Secondary legislation is needed to implement the two Regulations. Implementation of the cars Regulation is more advanced than the vans Regulation. The latter will however be consistent with the approach of the former. The following implementing measures have been adopted so far: Implementing Regulation on CO 2 monitoring from cars 17 The monitoring scheme is now operational and is working well and, despite the need for some further adjustments, the overall quality of the data is satisfactory. The Commission is currently evaluating the database error margin and developing a methodology to calculate it. The additional administrative burden of the monitoring scheme differs significantly between Member States and is linked to the cost of amendments to the preceding scheme established in Decision 1753/2000 to monitor new car CO 2 emissions. Article 8(9) of Regulation 443/2009 enables the Commission to introduce any necessary amendments to the monitoring scheme in the light of experience through the comitology procedure. In view of this and the limited experience so far, there is no need for action in the current review. Implementing Regulation on CO 2 monitoring from vans 18 Based on the monitoring scheme for cars, the Member States are required to provide data on van registrations from The implementing regulation is based on the one for cars appropriately adapted. Similarly to the car monitoring scheme the Commission is enabled to introduce any necessary amendments through comitology, therefore it is not further discussed in this review Commission Regulation (EU) No 1014/2010 on monitoring and reporting of data on the registration of new passenger cars pursuant to Regulation (EC) No 443/2009 Commission Implementing Regulation (EU) No 293/2012 of 3 April 2012 on monitoring and reporting of data on the registration of new light commercial vehicles pursuant to Regulation (EU) No 510/2011 EN 14 EN
16 Monitoring of CO 2 emissions from multi-stage vans One of the most urgent implementation tasks for vans is the monitoring of multi-stage vehicles (MSV). MSVs are vehicles built in stages by different manufacturers, often to a client's specification 19. According to Article 13(4) and Annex II of the vans Regulation, the Commission is to propose a new procedure to obtain a representative value of the final vehicle CO 2 emissions. This proposal is currently under discussion with the Member States. The proposal foresees that the manufacturer of the base vehicle will be responsible for the final CO 2 emissions of the completed vehicle. These emissions are to be established based on a simplified method to avoid burdensome measurement of emissions of each MSV while ensuring the OEM has access to the information on the vehicles under its responsibility. Implementing Regulation setting out a procedure for derogations applications 20 for cars The derogation scheme for small-volume registrations (up to 10,000 cars per year) and niche manufacturers (10,000 to 300,000 per year) is operational. In 2011 the Commission received 23 applications (3 niche, 20 small volume) for the derogation period starting in These were assessed and 18 small-volume and 2 niche derogation decisions adopted. The remaining applications were submitted too late for decisions to be taken in The targets proposed by small-volume manufacturers mostly represent reductions. Small-volume applications must provide supporting evidence of the manufacturer's economic and technological potential. Most information required, especially regarding the economic situation of the companies, should be readily available to them. Other supporting evidence concerning market characteristics and technological potential is needed to allow an assessment of the proposed targets against competitors. For the two categories different issues arise: For small-volume manufacturers, the procedure is relatively cumbersome and creates an administrative burden for the Commission and manufacturers. It could be desirable to reduce these burdens as far as possible. The absence of a minimum threshold means that even where a very small number of cars of a brand may be placed on the EU market the manufacturer is covered by the Regulation. For niche manufacturers, the procedure is straightforward. A fixed baseline and reduction is set in the legislation, however, if these are not updated, manufacturers falling under this derogation would have no further target beyond In addition, the suitability of the upper threshold of 300,000 cars per year could be reconsidered as it would potentially enable a new entrant to supply up to 2.5% of the EU market while being in an advantaged competitive position compared to incumbent manufacturers The OEMs usually build a basic chassis-cabin structure which receives dedicated bodywork built by another manufacturer. Commission Regulation (EU) No 63/2011 laying down detailed provisions for the application for a derogation from the specific CO 2 emission target pursuant to Article 11 of Regulation (EC) No 443/2009 EN 15 EN
17 Van derogations The van Regulation contains only one type of small volume derogation which concerns manufacturers of less than 22,000 vans per year. The procedure has not yet been put in place but will be based on the equivalent car procedure. Implementing Regulation for cars setting out a procedure for application and approval of eco-innovations 21 The Implementing Regulation was adopted in 2011 however no complete eco-innovation application has yet been received. The regulation includes a review clause committing the Commission to revise the scheme by 2015 at the latest and inter alia to consider ways of simplifying the application and approval procedure in the light of experience. Similar rules are to be adopted for vans. Practical arrangements on application for pooling for car and van manufacturers Manufacturers are requested to apply for pooling via a straightforward application form available on the DG CLIMA website 22. No supporting evidence is required resulting in a small administrative burden. Decision on excess emissions premium for cars 23 The decision states that the procedure to be used for collecting premiums are the rules for recovery of receivable amounts, i.e. of fixed amount, certain and due, set out in the Financial Regulation and its Implementing Rules How will the problem evolve? How is the problem likely to evolve without new EU action? Without action the 2020 car and van CO 2 targets could not be implemented and no reduction beyond respectively 2015 and 2017 would be required. This is because neither 2020 target can take effect without legislation defining and implementing the modalities for This can only be done via the amendment of the relevant Regulations in the ordinary legislative procedure. Without further EU action in this field it is likely there would be little additional substantial CO 2 reduction from new light-duty vehicles. Some reduction would still be expected beyond 2020 due to the continuing renewal of the existing fleet with newer cars and vans meeting the current CO 2 standards. In addition, the formulae setting the current targets would be regularly adjusted to take account of changes to the average mass of the fleet preventing any increase in average new car and van CO 2 emissions per km Commission Implementing Regulation establishing a procedure for the approval and certification of innovative technologies for reducing CO 2 emissions from passenger cars pursuant to Regulation (EC) No 443/2009 Standard declaration of pooling members available at: Commission Decision of 17 February 2012 on a method for the collection of premiums for excess CO 2 emissions from new passenger cars pursuant to Regulation (EC) No 443/2009 EN 16 EN
18 However, based upon evidence from the EU and US for periods when there was no administrative requirement for fuel efficiency or CO 2 emissions to improve and no significant changes in oil price, it is concluded that car emissions and fuel efficiency improve on average by the order of 0.1 to 0.2% per year. There may be certain expectations that in view of the current CO 2 requirements and expected regulatory action in this field in third countries to which European vehicles are exported, the fuel efficiency improvement of vehicles may continue somewhat beyond this rate. However, as seen in the EU in the period between 1995 and 2006 for cars, in the absence of the mandatory CO 2 standard this progress is likely to be offset at least to some degree by the increase in power, size or comfort of new cars. 24 When combined with the expected increase in the vehicle fleet and static travel distances (described in section 2.3), overall CO 2 emissions from the LDV fleet would continue increasing. This 'do nothing' option forms the baseline scenario for the modelling used and is implemented in the modelling as Scenario 1 described in Annex 7.8. For the purpose of assessing this option, improvements in CO 2 emissions beyond the mandatory targets in 2015 and 2017 are assumed to continue at historical rates when there was no requirement to reduce emissions. The following paragraphs present the overview of the estimated impacts of implementation of the 2020 targets as compared to the 'do nothing option', effectively presenting the benefits that would be foregone in case of no new EU action. Environmental impacts Introduction of the 95 gco 2 /km target represents a 27% reduction in CO 2 tailpipe emissions per vehicle km relative to do nothing by 2020 and beyond. The 2020 target for vans is a 16% reduction per vehicle km relative to do nothing by 2020, and for subsequent years. Total emissions between 2010 and 2030 are estimated to reduce by 24% for cars and 13% for vans. 25 PRIMES-TREMOVE modelling shows aggregate CO 2 emission reductions for cars and vans of around 422 Mt CO 2 in the period up to In addition, these savings are expected to reduce requirements for EU ETS allowances in the order of 0.5% to 1% in the period up to 2030 due to lower refinery emissions caused by decreased fuel demand. Macro-economic impacts EU crude oil consumption was 656 Mt in 2008 of which 598 Mt were imports 26. Of this some 300 Mtoe is used for road transport, approximately two thirds of which is for light duty road transport. EU oil consumption for LDVs costs approximately 100bn per year. The main macro-economic impacts of implementing the 2020 targets are linked to reducing fuel consumption and avoided fuel expenditure, financing additional vehicle technology and other economic activity. This is discussed in Annex 7.8. Avoided fuel use increases progressively over the decade 2020 to 2030 from 27bn per year in to 36bn per year in Energy use is around 25 mtoe per year lower in 2030, saving in total almost 160 mtoe to The impact of this reduced fuel expenditure depends on alternative spending patterns. To achieve the fuel savings, a part of this resource needs to be allocated to innovation and See the 2007 Commission Impact Assessment accompanying the Proposal for a Regulation to reduce CO 2 emissions from passenger cars, SEC(2007)1724 PRIM ES-TREMOVE modelling Source: PRIMES-TREMOVE modelling EN 17 EN
19 investment and manufacturing of more complex vehicles. These will have a positive economic impact due to an investment multiplier effect 28. These aspects are explored in detail in Annex 7.10 which indicates that spending on employment could rise by around 9bn and GDP by around 12bn. However, if total imports decrease due to lower oil demand, the exchange rate rises until the balance of trade is restored, making EU goods more difficult to sell abroad in the long run. Some of the initial positive economic impact may be lost due to this rebound effect. Energy security Reducing energy consumption contributes to energy security. The full value of this is uncertain, however two aspects are noted: Reduced energy consumption (principally crude oil) means that energy-security related costs (the so-called oil premium ) decrease. The lower oil premium has two effects. Firstly, a lower demand for oil in the EU has a downward impact on the world oil price and secondly, macro-economic disturbances from oil price shocks are reduced. This has a positive economic effect 29. The JRC estimated a value for the economic benefits of improved energy security from increased biofuel use by calculating the cost of achieving a similar improvement in energy security through the establishment of a (additional) strategic stock of oil 30. The cost was estimated to be about 130 per tonne of oil equivalent, although this estimate is considered to be the upper bound value. Based on this, the estimated aggregate energy security benefit between 2020 and 2030 of introducing the 2020 car and van targets is some 20bn. Impact on taxation revenues Fuel taxes are the most relevant category of taxation in this respect, as fuel consumption will be lower compared to the 'do nothing option' (as described above). The impact on vehicle registration taxes depends on their structure. If dependent on vehicle prices, revenue will go up if the average retail prices increases due to CO 2 standards. If dependent on CO 2 emissions revenues from sales taxes will decrease. Total fuel expenditure avoided will be approximately 27bn per year in the period rising to 36bn per year in the period Tax represents a large proportion of fuel costs. It is estimated that if tax rates are not changed government fuel tax revenues (excise and VAT) would decrease by around 15bn per year in the period and around 22bn per year over the period This decrease could be avoided by altering tax rates or by replacing them with alternative transport pricing mechanisms. Since the effects on tax revenues are predictable and manageable, they are not considered to be crucial. Any changes that occur are likely to relate primarily to the level of ambition of the 2020 targets rather than any of the modalities under consideration The multiplier effect results from the spending of business and employees resulting from the initial investment. Paul N. Leiby (2007), Estimating the Energy Security Benefits of Reduced U.S. Oil Imports JRC (2007) Biofuels in the European Context: Facts and Uncertainties Source: PRIMES-TREMOVE modelling EN 18 EN
20 The net effect on government revenue is unknown and any loss due to decreased consumption of fuel may or may not be compensated by higher VAT revenue or vehicle taxes. The approach taken by government to replace these revenues may have a strong effect on the eventual outcome in terms of employment. A decrease or reduction in fiscal stimuli for fuel efficient cars could compensate these negative effects in part or in full, depending on the preregulation stimulus level. Net costs and benefits for consumers and society Savings on fuel spending to end-user The largest single economic impact on consumers of no EU action to implement the 2020 car and van targets is foregone benefit of fuel saving for vehicle purchasers. The level of fuel savings per vehicle is purely driven by the existence of the 2020 targets and their overall level of ambition. The impact of implementation of the 2020 CO 2 targets on fuel savings for private consumers and business owners is evident. Moving to 95 gco 2 /km and 147 gco 2 /km in the new car and van fleets implies reductions in annual fuel consumption of about 27% and 16% respectively (with equal mileage). However, fuel savings may be lower than expected due to rebound effects, as lower running costs may lead to higher distances driven. In aggregate, these amount to around 27bn per year in 2025 rising to 36bn in For an average car, and depending on the price of fuel, the end-user will save from 2904 to 3836 over its lifetime 32 as compared to retaining the 130 gco 2 /km target (i.e. a 'do nothing' option). For vans these savings are expected to range from 3363 to as compared to 175 gco 2 /km (see Table 2). Table 2 User perspective - lifetime fuel cost savings for cars and vans relative to the short-term targets and relative to 2009/10 situation [in ] Oil price [$/barrel] Relative to 130 gco 2 /km Cars Relative to Relative to 175 gco 2 /km Vans Relative to Cost-effectiveness to society Equally, no implementation of the 2020 targets will result in foregone economic benefits to society linked to no further fuel savings resulting from increasing efficiency. Based on the central cost scenario (i.e. scenario 2) 34 which in view of the results of a thorough analysis Assuming 14,000km and 16,000km annual distance driven by petrol and diesel and vehicles' lifetime of 13 years with 8% private discount rate Assuming 23,500km annual distance driven and vehicles' lifetime of 13 years Cost scenarios are presented in detail in Annex 7.13 EN 19 EN
21 undertaken by the US Environmental Protection Agency 35 and factual evidence seems most appropriate, Table 3 shows that both 2020 targets have negative abatement costs which means that society overall saves from implementation of the targets. The higher the oil price the greater the overall savings. Table 3 Societal perspective 36 - Annual and lifetime fuel savings, NPV of lifetime fuel savings and abatement costs for society Oil price [$/barrel] Diesel price (ex taxes) [ /l] 0,74 0,82 0,90 0,99 1,07 1,15 Cars Petrol price (excl. taxes) [ /l] 0,67 0,75 0,83 0,91 0,99 1,07 Lifetime fuel cost savings 37 (excl tax) [ ] Abatement costs 38 [ /tonne CO 2 ] Vans Lifetime fuel cost savings (excl tax) [ ] Abatement costs [ /tonne CO 2 ] Figure 2 to Figure 5 show graphically the net present value (NPV) of fuel cost savings compared with additional vehicle costs for the end-user 39 and society with four different cost scenarios for cars. These figures not only show that during the lifetime of the vehicle, fuel cost savings greatly outweigh additional costs for the level of the limits envisaged but also demonstrate that this will happen within a five year period. These conclusions hold for both passenger cars and vans Analysis available at 4% discount rate used Assuming 14,000km and 16,000km annual distance driven by petrol and diesel and vehicle lifetime of 13 years Based on cost scenario 2, using mass as utility parameter with 60% slope. For detailed explanation of the cost scenarios see Annex For end users a private discount rate of 8% is used EN 20 EN
22 Figure 2 NPV of fuel savings for an average medium petrol passenger car compared to cost curves constructed in the car study. Cost curves compared to NPV of fuel savings additional manufacturer costs [ /vehicle] NPV fuel savings - consumer / lifetime NPV fuel savings - consumer / 5 yr NPV fuel savings - societal petrol basic cost curve petrol scenario a) petrol scenario b) 8000 petrol scenario c) TA CO2 emission [g/km] petrol vehicle lifetime (y) 13 discount rate 4% annual mileage (km/y) RW/TA fuel price ( /l) 1.50 price / manuf. cost factor Figure 3 NPV of fuel savings for an average medium diesel passenger car compared to cost curves constructed in the car study. Cost curves compared to NPV of fuel savings additional manufacturer costs [ /vehicle] TA CO2 emission [g/km] NPV fuel savings - consumer / lifetime NPV fuel savings - consumer / 5yr NPV fuel savings - societal diesel medium - basic cost curve diesel medium - scenario a) diesel medium - scenario b) diesel medium - scenario c) diesel vehicle lifetime (y) 13 discount rate 4% annual mileage (km/y) RW/TA fuel price ( /l) 1.50 price / manuf. cost factor EN 21 EN
23 Figure 4 NPV of fuel savings (incl. VAT) for an average Class II diesel LCV compared to cost curve constructed in the van study (assuming annual mileage of 23,500km and 13 years vehicle lifetime). Cost curves compared to NPV of fuel savings NPV fuel savings - user / lifetime additional manufacturer costs [ /vehicle] 8000 NPV fuel savings - user / 5yr 7000 NPV fuel savings - societal diesel medium cost curve TA CO2 emission [g/km] Figure 5 NPV of fuel savings (excl. VAT) for an average Class II diesel LCV compared to cost curve constructed in the van study (assuming annual mileage of 23,500km and 13 years vehicle lifetime). Cost curves compared to NPV of fuel savings NPV fuel savings - user / lifetime additional manufacturer costs [ /vehicle] 8000 NPV fuel savings - user / 5yr 7000 NPV fuel savings - societal diesel medium cost curve TA CO2 emission [g/km] Impacts on international trade and competitiveness The 'do nothing' option is expected to have a potential negative impact on international trade and competitiveness. This is mainly due to a potential weakening of the competitive position of the EU automotive industry on the third markets. These impacts are presented by outlining the expected benefits of implementation of the 2020 targets. EN 22 EN
24 Effect on inte rnational market / trade balance The implementation of the 2020 targets will have two main impacts on international trade: energy consumption and automotive sector sales. A positive effect on the trade balance is expected in relation to energy as LDVs would consume less oil in the EU. The new CO 2 targets may affect the competitiveness of vehicle manufacturers and component suppliers on the international export market. If those markets value lower fuel consumption then competitiveness will be improved, if not it could deteriorate. There is a clear tendency towards greater LDV fuel efficiency in countries outside the EU with countries accounting for over 65% of EU automotive exports already having 2020 targets. Figure 6 shows how CO 2 standards are evolving globally. This suggests that the EU is a frontrunner in producing low CO 2 vehicles giving EU manufacturers a competitive edge (specialisation) in this domain which is valued increasingly highly. The stakeholders are also largely in agreement that retaining this leading position is essential for the competitiveness of the EU automotive industry (see section 4 of Annex 7.2). At the same time it is clear that the international standards are converging, putting increasing competitive pressure on the EU industry. Figure 6 Evolution of LDV CO 2 standards in different countries (ICCT) Impacts on competitiveness and innovation The potential impacts of the Regulations on competitiveness are explored in detail in Annex 7.9. The main effect comes from the implementation of the 2020 targets. Introducing the targets may impact on the automotive sector (vehicle manufacture and component supply) and on all other sectors of the economy which use LDVs. The latter effect is due to lower LDV total costs of ownership (see Figure 2 to Figure 5). For the automotive sector, the detailed assessment shows that for many of the indicators the impacts are unlikely to be significant (e.g. compliance costs, capital, labour, consumer choice, EN 23 EN
25 restructuring). Where impacts are expected to be significant they will lead to reduced energy and vehicle operating costs which will be beneficial to competitiveness for the EU as a whole. The targets will stimulate innovation. It is clear that the automotive sector has a large capacity for innovation and enjoys a substantial comparative advantage. The industry continues to improve its labour productivity and remains globally competitive, ensuring a trade surplus. This trend has continued following the introduction of CO 2 regulations, as it has in Japan 40, and there is no reason to believe they will be fundamentally altered by the introduction of the 2020 targets or any of the modalities. The European automotive industry is considered to be a global technology leader - largely due to substantial investments into innovation, but also as a result of a demanding home market. In the responses to the public consultation (see Annex 7.2), 72% of stakeholders and 83% of individuals agreed or partly agreed that EU regulation of road vehicle emissions stimulates innovation in the automotive sector and helps keep Europe's automotive industry competitive. The main challenges facing the industry appear to derive from other factors. The current situation shows large differences per manufacturer, plant or country, with some, not only premium brands, in good shape and having announced record financial results for The current Regulations have not had a negative impact on competitiveness and the analysis suggests that, if anything, the implementation of the 2020 targets will further stimulate innovation in the EU automotive sector and enhance its competitiveness in particular making it better placed to benefit from CO 2 and fuel efficiency regulations that will be implemented in other major vehicle markets over the next decades as shown above. Effect on job market / e mployees The European automotive industry is a major employer of a skilled workforce, directly employing over 6 million people (1.2 million employed by car manufacturers and 4.8 million by suppliers) and indirectly responsible for approximately 12.6 million jobs in large companies and SMEs (2.3 million jobs are directly related to manufacturing, 1.2 million jobs in closely related activities, 4.9 million jobs related to road transport and 4.2 million in various services of automobile use). 42 A number of reports cite that fuel efficiency could have a beneficial effect on employment 43 as fuel efficiency increases the value of cars manufactured and leads to proportionally higher labour demand. Avoided fuel costs are spent on other goods and services. Table 4 gives an overview of the relative labour intensity (RLI) of some key sectors in the EU. The first column represents the percentage of the total wages each sector pays to employees, the second column represents the percentage of the monetary value of output each sector generates. The relative labour intensity is the fraction of labour compared to the fraction of output generated by each industry. Increasing fuel efficiency leads to a decrease in See the section on 'Overview of the affected sectors' in Annex 7.9 See "Economic situation & competitiveness of the car industry"; support document for CARS21 Sherpa meeting; 18 April 2012 ACEA 'The automobile industry pocket guide 2011' Fraunhofer-ISI, 2010, Strukturstudie BWE mobil:baden-wurttemberg auf dem Weg in die Elekt ro mobilitat CERES, 2011, More jobs per gallon, How Strong Fuel Economy/GHG Standards Will Fuel American Jobs TNO, 2011, Support for revision of regulation No 443/2009 on CO 2 emissions of Cars EN 24 EN
26 demand of relatively non-labour intensive sectors (refineries, extraction) and a shift towards the more labour intensive manufacturing of motor vehicles as well as other goods. The manufacturing sector however is still quite capital intensive. Table 4 Relative labour intensity (RLI) of sectors (% of compensation / % of output in total economy), source: EU input-output table Sector % labour % output RLI Coke, refined petroleum products and nuclear fuels Crude petroleum and natural gas; services incidental to oil and gas extraction excluding surveying Manufacture of motor vehicles, trailers and semi-trailers Other transport equipment Construction work Service of land transport; transport via pipeline services Trade, maintenance and repair services of motor vehicles and motorcycles; retail sale of automotive fuel Research and development services Health and social work services Public administration and defence services; compulsory social security services An indication of how changes to fuel consumption and purchase of vehicles affect other sectors of the European economy can be derived from EU Input-Output tables. A detailed description and results can be found in Annex Substitution of fuel by capital and technology increases domestic demand. As illustrated in Annex 7.10 in Table 13 this can be expected to increase GDP by around 12bn and annual expenditure on labour by around 9bn. A major contribution to this comes from the fact that vehicle manufacturing is more labour and export intensive and purchase of fuels is import intensive. 44 These results are supported by assessments in a number of reports (see footnote 43). The conclusion of this assessment is that an increase in vehicle consumption has a proportionally large effect on production and labour demand. The need for improvements in fuel efficiency will have positive impacts on the demand for basic metals, wholesale trade, chemicals and rubber. Other sectors will be largely unaffected. 44 See JRC report, 2007, Technological studies on contribution to the report on guiding principles for product market and sector monitoring, Working paper on competitiveness and sustainability; See Nemry F., Vanherle K., Zimmer Z., Uihlein A., Genty A. et al., 2009, Feebate and scrappage policy instruments. Environmental and economic impacts for the EU 27, JRC scientific and technical reports. EN 25 EN
27 Conclusion Without new EU action the 2020 car and van CO 2 targets could not come into effect and the problem of increasing CO 2 emissions from light-duty vehicle would not be tackled by EU policy. Further progress in fuel efficiency could not be assumed as evidence from the EU and US indicates that in the absence of regulatory requirements or large fuel price increases, LDV fuel consumption improves at only a modest rate. This is included in the modelling as Scenario 1 described in Annex 7.8. As described in the section above and in the abovementioned annex, no new EU action results in substantially higher EU oil consumption, greater CO 2 emissions and reduced GDP and EU employment. It would also mean abandoning the strategy of reducing LDV emissions and would be counter to current goals The Adaptation to Lisbon Treaty Regulation 443/2009 was adopted prior to the coming into force of the Lisbon Treaty. As a result the comitology provisions need to be updated and brought into line with the Treaty as part of agreement between the Commission, the Council and European Parliament. This is a mandatory requirement and is therefore not further assessed Form and stringency of legislation beyond 2020 As indicated in section 5 of the car study, vehicle manufacturers have approximately 7 year timetables for complete changes to vehicle platforms and 10 to 15 year cycles for completely new engines. Much shorter timeframes apply for adaptations to these. The two-step approach that has been taken to date in the Regulations has been to fix a short term mandatory target approximately 6 years in the future 45 and provide a longer term target with a requirement to confirm the associated modalities at a later date. This is compatible with manufacturers' needs. It is relatively easy to calculate the required level of CO 2 emissions from different types of vehicles to be compatible with a certain level of overall emissions. However, the assessment of the costs of the technology needed to achieve those emission levels become increasingly uncertain the further ahead the projection is made. In view of this it becomes increasingly difficult to know whether the likely required level of emission reductions is best achieved through technology or through alternative policy instruments. This supports setting longer term targets subject to confirmation of feasibility. To enable the most cost-effective planning of R&D and investments, it is desirable for manufacturers to have a sufficiently long lead time with regard to the future stringency of CO 2 legislation so that they can adequately allocate resources and effort. This will be particularly important as manufacturers need to introduce different types of powertrain further into the future. In respect of the latter, it is also desirable to consider whether in the future the method of regulation would need adjustment to best ensure a technology neutral approach. Without a continuation of the 2020 targets and without a communication discussing the Regulations beyond 2020, the automotive industry will not be provided with the necessary information for cost effective planning and investment. 45 Car target set in 2009 for 2015, van target set in 2011 for EN 26 EN
28 2.6. Who is affected and how? Major stakeholder groups affected include the general population, vehicle purchasers, vehicle manufactures, automotive component suppliers and fuel suppliers. The main impacts are: The EU population is increasingly affected by climate change through increased climate variability, more frequent extreme weather events, and their related impacts. Buyers of vehicles, both individuals and businesses, are affected by possible increases in the price of vehicles and reduced running costs, due to stricter CO 2 emission requirements and the related fuel consumption improvement. Fuel saving benefits are expected to outweigh the cost of compliance with the standards. Vehicle manufacturers will be affected by the obligation to reduce CO 2 emissions, and will have to introduce technical CO 2 reduction measures. In the short-term, this is likely to result in increased production costs and could affect the structure of their product portfolios. However, demand for low CO 2 vehicles is expected to increase throughout the world as climate change policies develop and other countries introduce similar standards, manufacturers have an opportunity to gain first mover advantage and the potential to sell advanced low CO 2 vehicles in other markets. Component suppliers are expected to benefit from higher demand for advanced technologies. Along with vehicle manufacturers they will benefit from the possibility to export these advanced technologies to other markets. Fuel suppliers will be affected as they are likely to see lower demand for transport fuels in the future as a result of the legislation. Other users of fuel and oil-related products (e.g. chemical industry, heating) are expected to benefit from lower prices if demand from the transport sector decreases. Sectors other than transport that emit GHGs will avoid demands to further reduce emissions to compensate for increased transport emissions. In so far as these sectors are exposed to competition, this will be important for their competitiveness The EU's right to act and justification The EU has already acted in this area when it adopted Regulations 443/2009 and 510/2011 based upon the environment chapter of the Treaty (cars on Article 175 of TEC 46 and vans on Article 192(1) of TFEU 47 ). The single market also provides grounds to act at EU level rather than at Member State level so as to ensure common requirements across the EU and thus minimise costs for manufacturers. This is made clear in the recitals of the current Regulations whose objectives include: " establishing CO 2 emissions performance requirements.. in order to ensure the proper functioning of the internal market and to achieve the Union's overall objective of reducing emissions of greenhouse gases " EU action is necessary in order to avoid the emergence of barriers to the single market in the automotive sector and because of the transnational nature of climate change. Without EU level action there would be a risk of a range of national schemes to reduce light duty vehicle Treaty of the European Communities amended by TFEU (see footnote 47) Treaty on the Functioning of the European Union EN 27 EN
29 CO 2 emissions. This would particularly disadvantage vehicle manufacturers and component suppliers as differing ambition levels and design parameters would require a range of technology options and vehicle configurations, diminishing the economies of scale. Manufacturers hold differing shares of the vehicle market in different Member States and would therefore be differentially impacted by various national legislations. Costs of compliance would increase and consumers would not benefit from lower costs and economies of scale that an EU wide policy delivers. EN 28 EN
30 3. OBJECTIVES GENERAL The general objective which flows from the Treaty and various EU policies outlined in the policy context in section 2.1 is to: Provide for a high level of environmental protection in the European Union and contribute to reaching the EU's climate change targets while reducing oil consumption, thus improving the security of energy supply in the EU, stimulating innovation and boosting competitiveness of the EU industry. SPECIFIC In line with the general objective but focussing on the scope of this review, the specific objective is to: Ensure the continued and effective application of the car and van CO 2 regulations particularly in respect of the 2020 targets. OPERATIONAL In designing the operational objectives the criteria for a review outlined in Article 13(5) of the car Regulation and Article 13(1) of the van Regulation that the Commission's proposal should be "as neutral as possible from the point of view of competition, socially equitable and sustainable" were taken into account. Furthermore, the operational objectives are also designed to be specific, measurable, achievable, realistic and time-dependent (SMART) to the possible extent. As a result, the operational objectives are as follows: Ensure that the 2020 van CO 2 target is feasible. Ensure that the CO 2 emission targets for 2020 of 95 gco 2 /km for cars and 147 gco 2 /km for vans are achieved cost-effectively. Ensure the modalities of achieving the 2020 targets do not have unacceptable social impacts 48. Ensure the modalities of achieving the 2020 targets do not have undesired competitiveness impacts for the EU automotive sector 49. Create sufficient certainty for the automotive sector with regard to future light duty vehicle CO 2 requirements. Minimise where possible the administrative burden and costs for SMEs of the Regulations The main social impacts are likely to arise from different impacts on car prices. In view of this a particular aim is to min imise the divergence in relative retail price increase between different car segments A range of competitiveness aspects are relevant. However, a key goal is to avoid excessive distortion in competition between manufacturers. This is best assessed through the divergence between the relative retail price increase for a manufacturer compared to the average. Minimising this divergence will lead to the least competitive distortion. EN 29 EN
31 The problem described in section 2 and the objectives outlined in this section fit together to provide an intervention logic. This is shown in the graphic below, illustrating how the various modalities employed in the existing legislation impact on the main objectives sought. EN 30 EN
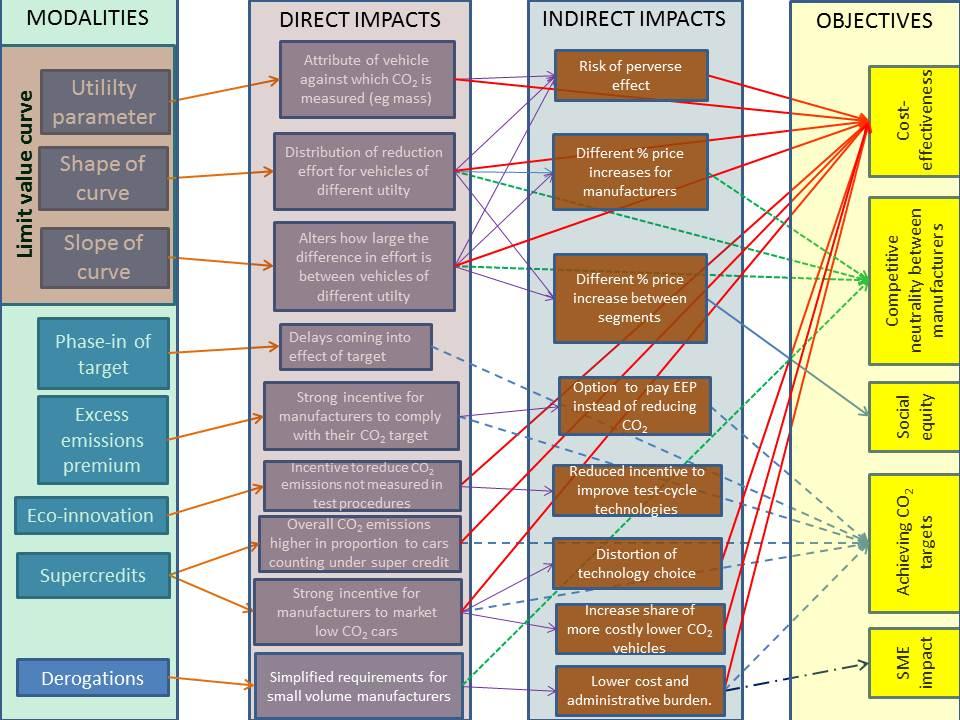
32 EN 31 EN
33 4. POLICY OPTIONS 4.1. Methodology This impact assessment supports the amendment of two Regulations. These Regulations have a structure that has been decided on the basis of the Commission's original proposal and the co-decision process. In view of this, the aspects considered for amendment focus on potential modalities that can be altered within the agreed policy framework. A broad approach has been taken to identifying policy options. This covers issues raised in the legislation, those arising with implementation and those assessed in the studies analysing possible approaches to improve the legislation's effectiveness. For each aspect an assessment is made of the options available. A preliminary assessment is then made of these options, primarily based upon the analysis carried out in the external studies and on the input from stakeholders. Based on this assessment it is determined which options should be taken forward for detailed analysis Do nothing option This option implies that the 95 and 147 gco 2 /km targets for 2020 for cars and vans respectively would not be implemented. Further to the extensive assessment of the 'do nothing' option in section 2.5 it is clear that this option would be counter to the general, specific and operational objectives (see section 3). The positive economic, social and environmental effects of reduced CO 2 emissions, savings on fuel spending and resulting macroeconomic impacts, net benefits to consumers and business of increased fuel efficiency of vehicles, as well as positive impacts on international competitiveness of the EU industry would not materialise. The conclusion to take action, and therefore dismiss this option, is reinforced by the results of the public consultation (see Annex 7.2) whereby 95% of individuals agreed that it was important to set greenhouse gas emission standards as part of overall EU action, and a majority of respondents agreed that these standards should be in line with the GHG targets set out in the Commission's 'Roadmap for moving to a low carbon economy in 2050' and the Transport White Paper. Finally, in case of a 'do nothing' option the comitology provisions in the car Regulation cannot be brought into line with the Lisbon Treaty. In view of the arguments outlined above this option is discarded from further analysis Confirmation of feasibility of the 2020 target for LCVs The option considered in this section is whether or not the feasibility of the vans 2020 target can be confirmed. Article 13(1) of the van Regulation requires confirmation of the feasibility of the 2020 van target on the basis of an updated impact assessment. This is assessed from the point of view of the baseline emissions and absolute reduction required to meet the target, the costs of achieving it and the leadtime available to manufacturers to prepare for compliance. These three aspects are discussed below. EN 32 EN
34 (a) Distance to target The 2010 emissions data indicates that the gap to the 2020 target reduced significantly as compared to the situation in 2007 without a major technological change. Average CO 2 emissions in 2010 are reduced relative to 2007 for all van segments although the level of reduction differed between classes (see Table 5). Table 5 Comparison of 2007 and 2010 data for all van classes Pe trol Diesel I II III I II III Average 2010 mass CO 2 emissions (gco 2 /km) sales 28,837 9,771 1, , , ,577 1,062,090 Share of sales 1.72% 0.91% 0.19% 17.81% 33.24% 44.97% 100% 2007 mass CO 2 emissions (gco 2 /km) sales 20,992 6,590 3, , , ,287 1,747,145 Share of sales 1.20% 0.38% 0.22% 16.47% 24.60% 57.14% 100% Difference in emissions 2010 vs (in gco 2 /km) (b) The costs of achieving the target The updated cost curves in the van study show greater reduction potential and lower costs compared to the previous analysis based on 2007 data (see Table 6). Table 6 The reduction needed and cost of achieving 147 gco 2 /km target for diesel vans Diesel Class I Class II Class III Average Maximum reduction possible (in gco 2 /km) Reduction required to meet 147 gco 2 /km (in gco 2 /km) Reduction in emissions for 2020 as % of the 2010 baseline vehicle emissions 12.06% 11.30% 13.33% 12.54% Cost of meeting the 2020 targets from the 2017 target (in ) EN 33 EN
35 (c) Time needed to comply with the target The timeframe over which this reduction needs to occur (10 years from the date of adoption of Regulation (EU) 510/2011) is consistent with the time needed for the development of a new van which is considered to be around 7 years 50. Conclusion In view of these considerations it is concluded that the vans target of 147 gco 2 /km is feasible. The remaining sections of this Impact Assessment will therefore focus on the assessment of modalities of implementing this level of the 2020 target for vans Policy options for the modalities of meeting the car and van targets This section undertakes a preliminary assessment of the following policy options for each modality currently included in the Regulations as well as options for inclusion of the alternative modalities: The limit value curve (section 4.4.1) Other modalities in the Regulations (section 4.4.2) Alte rnative modalities considered- not in the current Regulations (section 4.4.3) Utility parameter Excess emissions premia Banking and borrowing Shape of limit value curve Eco-innovations Mileage weighting Slope of limit value curve Derogations Combining van and car targets Phase-in Vehicle based limits Super credits Policy options for the limit value curve The utility parameter and the function describing the relationship between the utility parameter and CO 2 emissions (setting the shape and slope) are the most important modalities as concluded in section 2.1 and define the limit value curve. This section analyses alternative policy options for each composite of the limit value curve. 50 Source: The van study EN 34 EN
36 Utility parameter The options considered for this modality are: (1) Retention of the current utility parameter (2) Change of the utility parameter Both Regulations currently use mass as the utility parameter. This parameter was extensively debated prior to adoption of the legislation, in particular for cars, and the Regulations request other parameters to be assessed. A large range of possible parameters have been considered. Cars Nine different possible utility parameters were assessed 51 which were: footprint, wheelbase, footprint times height, mass (used currently), payload, composite of seats expressed in volume and volume of boot space, a composite of number of seats and boot space, price, a composite of payload with seat and boot volume, a composite of footprint and mass in running order, a composite of payload with seat and boot volume, footprint and mass in running order. The preliminary assessment 52 of the various options discards all options other than mass and footprint. Various assessments in the car study are performed using both mass and footprint as the utility parameter to enable a thorough comparison. It can be seen 53 that there is relatively little cost difference between the two parameters based upon size of vehicle, or fuel, with larger vehicles having slightly higher cost for footprint. Only mass (option 1) and footprint (option 2) are retained for further analysis. Vans Three utility parameters are assessed 54 : mass (used currently), payload and footprint. A preliminarily assessment of their fit with fleet CO 2 emissions, their suitability for further analysis and other practical aspects, concludes that all are suitable proxies of vehicle utility. However, the analysis subsequently discards payload despite its good correlation with fleet CO 2 emissions (although less representative for vehicles above 1900 kg) and its close link to the utility of a commercial vehicle. The main reason underlying this decision is that payload is a parameter derived from the maximum technically permissible vehicle laden mass, i.e. the maximum the loaded vehicle can weigh. This is declared by the manufacturer rather than measured and could therefore be manipulated. In addition, the CO 2 impact of vehicle modifications to increase payload could be relatively small creating a potential perverse incentive. In view of the arguments above, only mass (option 1) and footprint (option 2) are retained for further analysis Sections 7 and 8 of the car study Section 9 of the car study Figures 50 and 59 in the car study Section 4 of the van study EN 35 EN
37 Shape of the limit value curve The options considered for this modality are: (1) Retention of the linear limit value curve (2) Shift to an alternative limit value curve (flat, non-linear, curved) The shape of the limit value curve affects the distribution of effort between different vehicles depending on their position on the curve. The existing Regulations are based on a linear function (option 1). The linear function can be truncated at either top or bottom or both (as in the US) to ensure that manufacturers of smaller vehicles need to make less reductions or to ensure that manufacturers of larger vehicles have to make more effort. A curved function achieves a similar objective but avoids the gaming problems associated with a sudden change in slope of the function. Cars A range of relevant, conceivable limit value curve shapes are assessed 55. Four useful functions are identified: flat, linear, truncated linear and curved, and compared 56. It is shown that the linear function (option 1) has the lowest compliance cost per vehicle and that total compliance costs are lower. The curved shape (variant of option 2) approaches the costs associated with the linear function as the CO 2 target is reduced. Since the analysis shows that most options are more expensive and that there is no clear benefit from a change, option 2 is discarded and option 1 is retained. Vans Drawing on the car analysis, only linear (option 1) and non-linear (variant of option 2) limit value curve shapes are assessed for vans 57. For mass, a linear function (option 1) fits the scatter of CO 2 values of the van fleet well and seems appropriate. Since the current van limit value curve is linear this option would avoid change. For footprint two different trend lines are observed in the scatter of CO 2 emissions suggesting a non-linear correlation 58. This is the effect of CO 2 emissions levelling off above about 7m 2 which is largely due to the testing procedure 59. As a result a linear footprint function is judged inappropriate and a non-linear footprint function (option 2) is assessed (see Annex 7.15 for explanation of non-linear function). During consultations stakeholders did not express a clear preference for any alternative shape of the limit value curve for cars or vans. The automotive manufacturers favoured the current scheme. Option 1 for mass and option 2 for footprint are retained for further analysis Section 9 of the car study Annex K of the car study Section 5 of the van study Section 4 of the van study See Annex E of the van study EN 36 EN
38 Slope of limit value curve The options considered for this modality are: (1) Retention of the current slopes of the limit value curves: 60% for cars, 100% for vans (2) Shift to different slopes from the range 60% to140% The slope of the limit value curve (see Annex 7.11 for more detailed explanation) affects the distribution of effort between vehicles depending on their position on the curve. Because of this differential effect, changing the slope alters the amount of effort required from different manufacturers and impacts on the overall cost of meeting the target. The slope also affects the possibility for perverse incentives steeper slopes increase the risk. The studies 60 provide detailed assessments of the implications of changing the slope of the curve with mass or footprint as the parameter. The analysis in the car study was performed in comparison to the average slope of the 2009 fleet, which is taken as 100%. The range from 60 to 140% slope was analysed. In absolute terms, slopes in the range from to for mass and 17.6 to 41.1 for footprint have been considered. It is important to recognise that the choice of slope is ultimately a decision on an appropriate sharing of burden amongst manufacturers whilst still delivering the overall target for the EU fleet of new cars. This choice of slope can as equally be derived from and related to data from the 2006 fleet, 2009 fleet or an average of the two. 61 The van study analysis was performed in comparison to the average slope of the 2010 fleet, which is taken as 100%. The range from 60 to 140% for mass 62 and footprint 63 and linear and non-linear function respectively was analysed. During consultations stakeholders did not express a clear preference for any alternative slope of the limit value curve for cars or vans. The automotive manufacturers favoured the current scheme. Cars The percentage new car price increase as a result of the target is higher for small than large cars. A slope below 100% would be more socially equitable since this slightly reduces the small car percentage price increase and the converse for larger cars. However, even at 60% slope this makes only a few percentage points difference compared to a 100% share Section 10 of the car study and section 5 of the van study For example, the most obvious slopes derived from different data sets are as follo ws: - the slope from the current Cars Regulation of but adapted to meet the 95g/km target in 2020 would equal to ; - the 2009 fleet data and a slope of 60% relative to this baseline would result in a parameter of ; - the 2009 fleet data with a 100% slope relative to this baseline would equal to ; - the average of the fleet data from 2006 and 2009 and a slope of 60% relative to this baseline would result in a parameter of In absolute terms a range from to was considered for linear mass-based function. For a non-linear footprint-based limit value curve two ranges of slopes were considered: in absolute terms from 16.4 to 38.2 to the left from the bending point and an equivalent range of 2.3 to 5.4 to the right from the bending point. EN 37 EN
39 When the Regulation was adopted a slope below a certain level was needed to avoid incentivising mass increases. The 100% line for 2009, depicting the actual distribution of fleet in that year, already has a lower slope than that required in the current Regulation meaning that any slope below this 2009 baseline will avoid this incentive. Slope has a distributional impact between manufacturers, depending on their sales mix. For slopes below 100%, costs increase for 10 manufacturers and decrease for 10. Manufacturers are conversely affected for slopes above 100%. In view of these considerations both options are retained for further analysis. However, option 2 will consider only slopes in the 60 to100% range. Vans The percentage price increase for meeting the 2020 target is shown to be higher for larger vans in the study. However, this does not mean it is more expensive to reduce emissions from larger vehicles. The effect is due to the cost model optimising the reduction level across manufacturers' fleets. The results suggest larger vans have more reduction potential and therefore OEMs will seek a larger contribution from these to meet their overall targets. Mass-based function To avoid perverse incentives, it is desirable for the slope to be no steeper than in the current Regulation. The 100% slope derived from 2010 sales is only slightly steeper than that currently in use. The relative price increase (and additional manufacturer cost) is distributed most evenly over manufacturers around 100% slope. The average costs for meeting the 147 gco 2 /km target are lowest at 80% slope but the cost difference is negligible. In view of these factors the van study recommends a slope in the range %. Footprint-based function Although differences are very small, the lowest overall average additional manufacturer costs for footprint occur at the 110% slope (see Table 10). The distribution of additional cost per manufacturer is most even around the 100% slope. Since changes to vehicle footprint are much easier to implement in vans than cars, perverse incentives to adjust footprint are more important for vans. This is especially important for vans with low footprint, as the non-linear limit function is relatively steep at this part of the footprint range. Extension of footprint may lead to more loading area and extra space, which when used effectively may be beneficial. However, if done to increase the CO 2 target it could lead to increasing average footprint and non-compliance with the overall target. In order to avoid this perverse incentive a lower slope seems more desirable for vans. However, a lower slope increases the difference in cost distribution between manufacturer groups that sell typical vans representing the majority of the market, in contrast to those selling pick-ups or all-terrain vehicles. Both options are retained for further analysis. However, option 2 will consider only slopes in the 80 to 100% range. EN 38 EN
40 Policy options for other modalities in the Regulations Excess emissions pre mia The options considered for this modality are: (1) No change to the current level of the excess emissions premium (2) Adjustments to the current level of the excess emissions premium The excess emissions premia (EEP) are to ensure that manufacturers comply with their CO 2 reduction obligation. The level at which the premia are set needs to be high enough to ensure that manufacturers undertake the necessary technical innovations to ensure compliance rather than just pay EEP. They were originally set at the level of the upper range of marginal cost of compliance with 130 gco 2 /km for mainstream car manufacturers. In reality it is likely that the marginal cost to manufacturers to comply with that target will be substantially lower. Cars For cars, the EEP was set to 95 per gco 2 /km, but to allow manufacturers time to adjust to the new regulatory scheme, the first 3 gco 2 /km above the target would receive a lower EEP (increasing from 5 to 25 per gco 2 /km) in the period The analysis shows maximum marginal costs for different manufacturers 64, based upon cost scenario 1 65 (see Figure 7), with the average marginal cost of reaching 95 gco 2 /km being 91 per gco 2 /km, which is around the level of the current EEP (option 1). Marginal costs will be lower assuming that the middle cost curves (for more explanation see Annex 7.13) are likely to be more realistic. For most manufacturers, marginal costs are similar to or below the 95 per gco 2 /km level currently in place. For Spyker and Chrysler, costs are only substantially above the level if footprint is used as the utility parameter. Tata, Subaru, Suzuki, Porsche, Hyundai, Mazda and Mitsubishi have marginal costs quite substantially above the current premium level but most of these are currently covered by niche derogations Section of the car study For detailed description of cost scenarios see Annex EN 39 EN
41 Figure 7 Marginal costs per manufacturer for reaching the average of 95 gco 2 /km (based on cost scenario 1) Option 2 would be to update the EEP to reflect likely upper marginal costs of compliance with the 2020 targets. According to the cars study, if this logic was followed, the EEP might need to be increased to for mass as a parameter and possibly higher for footprint. This would increase the probability of meeting the target. Porsche would still have costs above these levels. EEP needs to be paid by a manufacturer (group) per gco 2 /km of emissions exceeding the target times the number of cars registered. A premium that is too low runs the risk of being an attractive alternative for not reducing emissions, which undermines the environmental objective. A premium that is set too high may also be inappropriate as the objective of the EEP apart from providing an incentive for manufacturers to comply - is to provide a safety valve. Another consideration is the fact that manufacturers cannot fully control the exact composition of their sales. In case of large unexpected shifts in consumer demand, the penalty is a buy-out option for complying with the Regulation. In view of the above, and based on the likelihood that for some manufacturers, average marginal costs of compliance will be below 95 per gco 2 /km it is not considered necessary to change the level of the EEP, especially for a mass-based limit value curve. Therefore, option 2 is discarded from further analysis. Vans For vans the EEP in the Commission's proposal 66 was set at the level of the upper range of the marginal cost of compliance which was around 120 per gco 2 /km for the target of 175 gco 2 /km. However, in co-decision the level of EEP was lowered to equal that of cars ( 95 per gco 2 /km) with a similar introductory regime for the first 3 gco 2 /km above the target in the period COM(2009)593 EN 40 EN
 that the marginal costs of meeting the 2020 van target for both mass and footprint-based functions is slightly below 40 per gco 2 /km if Tata 68 is")
 Figure 9 Marginal costs per manufacturer for reaching the average 147 gco 2 /km")
42 The maximum marginal cost for different manufacturers 67 has been analysed based upon a new methodology and a more adequate database. It can be seen (Figure 8 and Figure 9) that the marginal costs of meeting the 2020 van target for both mass and footprint-based functions is slightly below 40 per gco 2 /km if Tata 68 is excluded, quite substantially lower than had originally been estimated. Figure 8 Marginal costs per manufacturer for reaching the average 147 gco 2 /km (mass as utility parameter) Figure 9 Marginal costs per manufacturer for reaching the average 147 gco 2 /km (footprint as utility parameter) Section 5.8 of the van study TATA (including Land Rover) is likely to be covered by the small-volume derogation and may have a separate reduction target. EN 41 EN
43 For certain van and car classes a regulatory overlap exists where some large cars can potentially be type-approved as light commercial vehicles and benefit from a more lenient target which is expected to be cheaper to meet. If the van EEP is lowered (option 2) this incentive would be further strengthened. In view of this, option 2 is discarded. Retaining the current EEP level (option 1) provides a strong compliance incentive and ensures continued alignment with the EEP for cars. Derogation scheme The options considered for this modality are: (1) Stopping the derogation scheme (2) Continuation of the scheme (3) Update of the niche derogation scheme Option 1 is not seen as a practical solution. As concluded in the previous car impact assessment, manufacturers selling a relatively small number of vehicles with a limited and specialised portfolio may find it very challenging and costly to meet the overall targets set via the limit value curve. In addition, the manufacturers covered by the derogation tend to sell vehicles which are driven shorter distances than cars sold on the mass market. The overall contribution in terms of CO 2 emissions of cars sold by small-volume manufacturers is estimated to be below 0.01%. Therefore option 2 is preferred over option 1. The niche category has a fixed target of 25% reduction from the 2007 average emissions of each niche manufacturer. Option 3 considers certain updates to the scheme. The baseline in Article 11(4)b of the car Regulation could be updated to ensure a comparable level of effort for niche manufacturers compared to the main fleet. This would imply approximately 27% reduction compared to 2015 or a 45% reduction compared to 2007 for the same level of reduction as larger manufacturers. Analysis shows that manufacturers in this segment are technically able to continue making CO 2 reductions beyond It should be reconsidered whether manufacturers of up to 300,000 cars per year should have a differential treatment in terms of CO 2 reduction obligation beyond This can create unfair competitive distortions in markets where they compete. For example Honda and Suzuki which are both major global manufacturers currently sell around 175,000 cars per year in the EU and therefore fall under this derogation. In addition, there is a possibility that new entrant manufacturers from outside the EU 69 might gain a competitive advantage through use of this derogation. Option 3 could therefore be considered further. There are several aspects of the derogations procedure that have been identified as meriting further evaluation in view of simplification, these are discussed further in section For example manufacturers such as Great Wall Motors (500,000 global sales) or Dongfeng Motor Corporation (2 million vehicle sales) EN 42 EN
44 Eco-innovations The options considered for this modality are: (1) Phase-out of eco-innovations (2) Prolongation of eco-innovations The purpose of including eco-innovations in the legislation was to ensure that manufacturers could also receive credit for innovations that reduce CO 2 emissions during vehicle operation even when these are not measured in the normal vehicle test procedure. Article 13(3) of the car Regulation and Article 13(6) of the van Regulation require that once a new vehicle test procedure has been introduced eco-innovations should no longer be approved (option 1). Ideally the new test procedure will require operation closer to that experienced in real world conditions including accessories, thus ensuring that reported emissions are more realistic and avoiding the need for eco-innovations. A new test procedure is under development, however its introduction cannot be expected to completely eliminate the possibility that innovations not measured in the test procedure can be implemented. In fact, unless the new test procedure requires a more realistic approach to the operation of various vehicle accessories and equipment, much of the energy using elements will not play any role in determining vehicle CO 2 emissions. In view of this, improvement to these elements would not bring any credit to the manufacturer. An option to consider is to prolong the possibility for manufacturers to propose ecoinnovations under the scheme currently in place (option 2). Implementation of this would be straightforward and the nature of the scheme means that manufacturers would still only be able to claim credit for elements that would not otherwise be counted in the test procedure. Since manufacturers will not develop such innovations and propose them as eco-innovations if it is not cheaper to do this than to introduce other improvements which are measured in the test procedure it follows that eco-innovation measures should bring CO 2 benefits at lower cost than alternatives available to the manufacturer. It can be concluded therefore that ecoinnovations will not be proposed by car and van manufacturers unless they are an efficient route to reduce CO 2 emissions. The design of the measure ensures that eco-innovations are novel and therefore it can be concluded that this modality promotes innovation. It can therefore be concluded that the concept of eco-innovations is both efficient in that approved innovations will reduce CO 2 emissions and effective in that their cost should be lower than alternative options. This view is also supported by the automotive industry, including the producers of automotive components. Therefore, option 2 could be more appropriate than option 1. EN 43 EN
45 Phase-in The options considered for this modality are: (1) No phase-in of the 2020 target (2) Inclusion of phase-in of the 2020 target over the period or The short-term cars and vans targets are currently phased-in over a period of 4 years. It was argued that this was necessary to give manufacturers time to adapt their product portfolio. For vans, an additional argument was the economic crisis which hit the sector in 2009 and Option 2 would involve a phasing-in of the 2020 target. This might be carried out over a period of 3 years, comparable to the previous targets. Two variants are considered: a) the phase-in occurs over the period ; b) the phase-in occurs over the period Based on the preliminary assessment shown in Annex 7.14 option 2 is discarded for both cars and vans. Super-credits The options considered for this modality are: (1) No prolongation of super-credits (2) Prolongation of super-credits (3) Modification of super-credits The Regulations are based upon CO 2 emissions from the vehicle and ignore those from other parts of the energy supply chain. Therefore certain types of vehicles, essentially using substantial proportion of hydrogen or electricity for their propulsion during the test procedure will be measured as having very low emissions 70. The Regulations incorporate provisions that count vehicles with emissions below 50 gco 2 /km a multiple number of times for the period up to 2016 for cars and 2018 for vans. It was argued that this multiplier would provide a strong incentive for vehicles meeting this criterion to be marketed. Option 2 and 3 would introduce multipliers for low emission vehicles up to 2020 for cars and vans. Based on the preliminary assessment shown in Annex 7.14 options 2 and 3 are discarded for both cars and vans because they increase CO 2 emissions, reduce the stringency of the target below that politically agreed, reduce the cost-effectiveness of the Regulations and do not respect the principle of technological neutrality. It is however also clear that the magnitude of these negative impacts can be somewhat limited by the use of low multipliers and a threshold on the number of vehicles which could benefit from super-credits. 70 For example the Opel Ampera has combined test cycle emissions of 27 g CO 2 /km. EN 44 EN
46 Alternative modalities considered Options for additional modalities considered in this section: (1) Banking and borrowing (2) Combining car and van targets (3) Mileage weighting (4) Vehicle based limits In addition to the existing modalities, a further range of modalities has been assessed to consider whether they merit incorporation in the Regulations for Based upon the preliminary assessment shown in Annex 7.14 it is concluded that these options should be discarded for both cars and vans Simplification and reduction of administrative burden Options for simplification of the current Regulations considered in this section include: (1) Reduction of the number of modalities (2) Simplification of the implementing measures (3) Simplification of rules for SMEs and micro-smes (4) Simplification of the derogation procedure to reduce the administrative burden Simplification is assessed from a number of angles. Option 1 is based on the conclusion that the number of modalities should be kept as small as practicable to minimise the complexity of the legislation. This suggests a presumption against proposing modalities for inclusion in the Regulation. This logic is consistent with the analysis which led to the majority of the options considered for modalities, including the alternative approaches, being discarded. Many aspects of the implementation of the Regulations have been achieved through secondary legislation and these are not affected by the modalities implemented for These contain their own review provisions and possible simplifications (option 2) can be considered when those take place. Accordingly simplification possibilities for these are not considered in this Impact Assessment. The potential for simplifying rules for SMEs and micro-smes should be considered (option 3). There are many of these companies in the component supply sector that will benefit indirectly through the opportunity to develop new technology and components. However, since they are only indirectly impacted, there is no potential for simplification in relation to them. The only SMEs that could be impacted directly would be SMEs producing a very limited number of vehicles. These by their size would fall under the scope of the small volume derogations in both Regulations. It could be considered to establish a de minimis threshold for the registration of cars and vans below which manufacturers are exempt from the requirements of the Regulation. An alternative to a de minimis registration threshold could be to exempt manufacturers that are SMEs. EN 45 EN
47 It may be preferable to reduce the administrative burden the small volume application and assessment process is likely to cause for the Commission and manufacturers for the period from 2015 onwards (option 4). The possible improvements include clarification that derogations may be renewed or extended for another period; and clarification of the applicability of the derogation (i.e. in relation to which annual targets it applies). Lack of flexibility in the current provisions (e.g. the derogation in order to be applicable for a given calendar year must be granted in the preceding calendar year) may lead to small-volume manufacturers having to pay excess emissions premiums in case their applications cannot be assessed on time due to resubmissions or the need to complete the submitted application, even if they comply with the proposed targets. Options 3 and 4 are taken forward for further consideration Conclusions of the preliminary assessment Results of the preliminary assessment of the options: EN 46 EN
48 Section Modalities Cars Policy options for each modality Vans Utility parameter Mass and footprint options retained for analysis in section 5; Other options discarded; Mass and footprint options retained for analysis in section 5; Payload discarded; Shape of limit value curve Linear function option retained for analysis in section 5; Other options discarded; Linear function option for mass retained for analysis in section 5; Non-linear function option for footprint retained for analysis in section 5; Slope of limit value curve Slope options in the range 60%- 100% retained for analysis in section 5; Slope options in the range 80%- 100% retained for analysis in section 5; Excess emissions premia Alternative options discarded; Alternative options discarded; Ecoinnovations Modality retained in its current format; Modality retained in its current format; Derogation schemes Small-volume derogation retained; Option to continue CO 2 reduction for niche manufacturers retained for analysis in section 5; Small-volume derogation retained; Phase-in Modality discarded; Modality discarded; Super credits Modality discarded; Modality discarded; Banking and borrowing Mile age weighting Combining van and car targets Vehicle based limits Simplification/ reduction of administrative burden Modality discarded; Modality discarded; Modality discarded; Modality discarded; Simplification of rules for SMEs and micro-smes to reduce the administrative burden retained for analysis in section 5. Modality discarded; Modality discarded; Modality discarded; Modality discarded; Simplification of rules for SMEs and micro-smes to reduce the administrative burden retained for analysis in section 5. EN 47 EN
49 4.5. Adaptation to new test cycle New vehicle CO 2 emissions for the purposes of the Regulations are assessed as part of the type approval procedure using the New European Driving Cycle (NEDC) 71. Article 13(3) of the car Regulation and Article 13(5) of the van Regulation request the test cycle to be updated to reflect the real CO 2 emissions behaviour of vehicles and to include eco-innovations within the test procedure. Work is proceeding on the World Light Duty Test Procedure (WLTP), but it is uncertain when this will be finalised and implemented. It is clear that the 95 gco 2 /km and 147 gco 2 /km targets established in the Regulations were intended by the co-legislators to be applied with an equivalent stringency to the 130 gco 2 /km and 175 gco 2 /km targets, i.e. measured under the NEDC. This means that in theory manufacturers could continue testing their vehicles under NEDC conditions till 2020 for the purpose of compliance with the Regulations. However, this would be burdensome and costly once the WLTP has been adopted and would not respond to the desire for emissions to better relate to real world conditions. Information on the divergence between test and real-world emissions and underlying reasons is provided in Annex 7.7. It is not clear to what extent the WLTP will ensure that test emissions represent real world conditions. It is also clear that exploitation of flexibility in the test procedures has provided some proportion of the measured CO 2 reductions. It is important for the integrity of the legislation that any adaptation to a new testing procedure should not result in an increased amount of flexibility. These factors cause uncertainty for manufacturers. The Regulations already empower the Commission to adapt the formulas in Annexes I to a new test procedure. However, since the revised test procedure is unlikely to be adopted prior to the coming into force of the amended Regulations this cannot be done at present. To minimise uncertainty, it could be possible to describe in outline the principles and procedure that will be used for adaptation of the legislation in the legislation. This could potentially increase manufacturer certainty and thereby lower compliance costs Form and stringency of legislation beyond 2020 In view of the two-step nature of the Regulations, greater certainty for manufacturers will be created by setting indicative targets or target ranges for the period beyond 2020 as soon as possible. In consultations, setting these future targets in line with the EU's climate policy goals received a large degree of support. A number of stakeholders such as parts manufacturers and environmental NGOs have called for tighter targets to be set for Transport and Environment has stated that it believes a car target of 60 gco 2 /km should be set for 2025 and a van target of around or below 100 gco 2 /km for 2025 would be needed to ensure roughly equivalent technical effort in the car and van sectors. Earlier, the European Parliament in its Resolution of 24 October 2007 on the strategy to reduce CO 2 emissions from passenger cars and light-commercial vehicles 72 had indicated the need for further emissions reductions for cars to 70 gco 2 /km or less by See section EN 48 EN
50 The Commission recently indicated in a staff working paper 73, that it would in the period to 2014 "consider, based on a thorough impact assessment, proposing a target for passenger car emissions to be reached by 2025". It noted that this would include assessing the European Parliament's proposed goal. In a consultancy study that has been carried out for the Commission, indications of the range of vehicle CO 2 emission targets for the period beyond 2020 were established that would be compatible with the Transport White Paper 74. Further work is needed and in particular the Commission is currently studying the impacts of alternative regulatory metrics, particularly on the cost of meeting future targets. In view of the various aspects that need to be assessed it is considered that the optimal solution would be to publish a consultative Communication setting out the Commission's analysis of the implications of alternative regulatory approaches. The Communication would also provide an illustration of the likely range of stringency that would be required for future CO 2 limits compatible with the longer term climate objectives of the EU. Future changes to the regulatory approach and making the level of emission reductions mandatory would be carried out at a later stage through a legislative proposal. The approach combines the merits of allowing for the necessary further analysis and consultation, while providing a reasonable degree of certainty for manufacturers, albeit not as great as if the mandatory level and regulatory approach were already defined "A European strategy for clean and energy efficient vehicles state of play 2011;SEC(2011) 1617 See figure 4.6: II-Task-6-Draft-Final-Report-16Mar12.pdf EN 49 EN
51 5. ASSESSMENT OF POLICY OPTIONS 5.1. Crite ria to compare the options Main criteria The retained policy options for the modalities of meeting the targets and options linked to simplification and reduction of administrative burden are analysed further in this section. It should be noted that the Regulations request that the Commission's proposal should be "as neutral as possible from the point of view of competition, socially equitable and sustainable." These criteria are contained in the operational objectives and employed in the three aspects of the assessment. Neutrality from the point of view of competition is assessed within the economic assessment by comparing manufacturer costs per vehicle. Social equity primarily relates to the relative impacts on different classes of vehicle users and whether these are differentially impacted. Sustainability flows from a combination of the three elements whereby environmental benefits are ensured in a cost effective and socially beneficial manner. The table below shows how the operational objectives link to the following economic, environmental and social assessments. Ope rational objective Ensure the environmental benefits of the 2020 light duty vehicle CO 2 targets are achieved cost-effectively. Ensure the modalities of achieving the 2020 targets do not have unacceptable social impacts. Ensure the modalities of achieving the 2020 targets do not have undesired competitiveness impacts for the EU automotive sector. Create sufficient certainty for the automotive sector with regard to future light duty vehicle CO 2 requirements. Minimise where possible the administrative burden and costs for SMEs of the Regulations. Economic Environmental Social X X X X X X X X It is clear from this table that the majority of the objectives have most relevance for assessment under the economic criterion. As already illustrated in section 2.5, the largest part of the expected impacts arise from implementation of the 2020 targets. The modalities that are considered in this impact assessment only alter the manner in which those 2020 targets will be implemented. As a result their effect in the areas other than economic is small or minimal. For example, while there might be social impacts in relation to skills and employment that would arise from implementing the 2020 targets, no discernible change in these is anticipated as a result of altering any of the modalities. To the degree that social equity and competitiveness impacts will arise from the modalities, these arise principally as a second order effect resulting from the economic impact of the EN 50 EN
52 options. For example, social equity may be affected by changes in vehicle prices that impact more or less heavily on different social groups. Similarly changes in the competitive position of manufacturers arise as a second order effect of the cost impact on different classes of vehicle. In view of this, while social and environmental aspects are explored for the different modalities, these impacts are small or insignificant and therefore these sections are short Detailed aspects of assessment The options can have economic, environmental and social impacts through a variety of mechanisms. The main aspects that have been assessed are outlined below: Expected economic impacts Aggregate manufacturer compliance costs are primarily driven by the level of ambition. Thus the implementation of the targets will have the following economic effects: Additional investments in R&D and production by vehicle manufacturers and component suppliers. Possible additional purchase costs to vehicle purchasers which bring them economic benefits from the lower costs of use. Fuel savings for users and energy security benefits. A possible change in the competitive position of vehicle manufacturers and component suppliers vis-à-vis their global competitors. These effects are described in detail in section and Annex 7.8. However, the options for modalities considered in this chapter can also cause economic impacts in a number of ways. These are assessed as follows: Cost-effectiveness to society To decrease the burden of environmental protection, CO 2 emissions reductions should be undertaken at the lowest cost to society. This implies a comparison of costs (e.g. investment in new technologies) and benefits to society (e.g. fuel savings) of different policy options. The assessment in section has shown that the fuel savings substantially exceed the costs. However, some options may reduce the overall cost effectiveness. Manufacturer compliance costs The Regulations aim to be competitively neutral taking account of the diversity of the EU automotive industry and avoiding unjustified distortion of competition between manufacturers. Options that affect the distribution of effort will change the relative impacts on different vehicle manufacturers although these are unlikely to impact on component suppliers. Options should therefore also be compared based on the average cost of compliance faced by different manufacturers present on the EU market. This will feed through into costs for consumers. EN 51 EN
53 Other economic impacts: certainty for industry, innovation, competitiveness In order to minimise compliance costs and create incentives for the automotive industry, including manufacturers and component suppliers, to invest in new technologies, it is important to ensure long-term regulatory certainty. Options that undermine previous expectations or reduce future certainty can cause wasted investment and unnecessarily lockup capital. Therefore, policy options undermining previous expectations or reducing future certainty are less preferable to alternatives without such effects or with a smaller negative impact. In addition, policy options incentivising innovation and strengthening the competitiveness of EU industry are preferable. Impacts on SMEs No disproportionate regulatory burden should be put on small and medium enterprises and options should therefore be assessed from this aspect. Expected environmental impacts The direct environmental impact covers CO 2 emissions, which is the main greenhouse gas emitted by LDVs, as well as emissions of air pollutants. The most important environmental impact of the Regulations stems from the implementation of the 2020 targets and their level of stringency (see sections and 4.2). Policy options might lead to changes in the level of reductions in these emissions which is assessed. The effect on air pollutant emissions is indirect but it is assumed that reductions in vehicle fuel consumption should lead to a reduction in pollutant emissions. Expected social impacts The Regulations specify that they should be revised in a socially equitable way implying that policy options without disproportionate impacts on certain social groups are preferable. This impact can arise from the differential effect of the policy options on different vehicle classes and this is analysed. The policy options can also have an impact on the level and the quality of employment. The major social impacts arise from the level of ambition and implementation of the 2020 targets. The deployment of CO 2 reducing technology is likely to lead to increased manufacturing costs and given a certain cost pass-through to an increase in purchase price. As shown in the economic analysis, fuel efficiency improvements flowing from the revised targets more than compensate for any increase in vehicle purchase prices, given the high price of fuel Utility parameter - cars Two options are assessed mass or footprint. EN 52 EN
54 A. Economic impacts Average costs of compliance and distribution between car segments Additional car manufacturer costs compared to the 130 gco 2 /km target are shown in Table 7 for these alternative utility parameters and two selected slopes for the most likely cost scenario. Table 7 Additional average manufacturer cost per car compared to 130 gco 2 /km Utility parameter Slope Cost ( ) Mass 60% 1219 a= % a=0.494 Footprint 60% a= % a= Note Costs shown for mass have been adjusted to take account of the average undervaluing of light-weighting in the original study methodology (for details see Annex 7.12). On aggregate it can be seen that there is little change in average additional manufacturer cost per vehicle for either utility parameter for different slopes of the limit value curve. However there is a larger difference when looking at vehicle size as shown in Table 8 below. EN 53 EN
55 Table 8 Additional manufacturer cost ( ) per car for different car categories relative to 130 gco 2 /km legislation showing cost difference between mass and footprint parameter Pe trol Diesel Utility function Slope Small Medium Large Small Medium Large Mass Footprint Cost difference (mass-footprint) 100% of 2009 a= % of 2009 a= % of Mass 60% of 2009 a=0.296 Footprint 60% of 2009 a= Cost difference (mass-footprint) 60% of Note Costs shown for mass have not been adjusted to take account of the undervaluing of light-weighting in the original study methodology (for details see Annex 7.12). It can be seen that manufacturer costs are lower for footprint than mass except for large cars, in which case mass is substantially cheaper. The cost difference between the options is less pronounced with a lower slope. In the case of mass the cost per car is more evenly distributed over the different vehicle segments (diesel-petrol, small-large) which leads to a higher percentage relative price increase for smaller cars. This is clearly shown in Figure 10 and Figure 11 which show the additional manufacturer cost (including mark-up) as a percentage of new car prices for each car segment Relative retail price increase is calculated by multiplying the additional manufacturer costs by a markup factor and dividing by the average retail price for the segment or manufacturer. It excludes sales taxes. EN 54 EN
.")
56 Figure 10 Relative price increase per car segment with mass as utility parameter, compared to maintaining 130 gco 2 /km between 2015 and 2020 (cost scenario 2). Figure 11 Relative price increase per car segment with footprint as utility parameter, compared to maintaining 130 gco 2 /km between 2015 and 2020 (cost scenario 2). Distribution of costs between manufacturers A change in utility parameter can have an impact on competition between different manufacturers. This is most clearly seen by comparing Figure 12 Figure 12and Figure 13 which show the relative price increase for different manufacturers. For some, such as Chrysler and Spyker the change of parameter could quite significantly alter their costs compared to the average. However, for many manufacturers the difference is relatively small for example Volkswagen and Fiat. EN 55 EN
57 Figure 12 Relative retail price increase per manufacturer per car with mass as utility parameter compared to the average price increase (cost scenario 2). Figure 13 Relative retail price increase per manufacturer per car with footprint as utility parameter compared to the average price increase (cost scenario 2). EN 56 EN
58 Certainty With regard to certainty, the current Regulation is based upon mass as the utility parameter. While it is clear in the Regulation that alternatives should be considered, it is understood that manufacturers have planned their compliance pathways to 2020 on the basis of a continuation of the current utility parameter. In view of this, if a decision were taken to change parameter, it would provide greater planning security if this was linked to the discussion of the regime beyond Innovation With regard to innovation, there is unlikely to be an impact on most routes to meet the 2020 target with the exception of light-weighting. In this respect using mass as the utility parameter does not treat all options equally, as mentioned by various stakeholders during the consultation. This is undesirable since it does not enable manufacturers to optimally balance the costs and benefits of all alternative CO 2 reduction measures. In addition it impacts on the competitiveness of suppliers who can provide lightweight components for vehicles since the CO 2 benefit from using their products will be undervalued. Competitiveness With regard to EU industry competitiveness, it might be argued that alignment of the utility parameter with other global markets might assist EU manufacturers. However, while the USA uses footprint as its utility parameter, other markets use mass (e.g. Japan, China, South Korea). Nevertheless, during consultations manufacturers have not argued for alignment as a reason to retain or change the parameter and so this aspect can be assumed to be of minor importance for them. Conclusions In conclusion, the choice of utility parameter impacts on manufacturers in different ways and therefore cannot be said to be entirely competitively neutral. It can be concluded that footprint is slightly more cost-effective than mass as the utility parameter. Nevertheless, a change from mass runs against the objective of ensuring certainty for industry if the change were to be made for implementation of the 2020 targets. The choice of utility parameter is not expected to have any impact on competitiveness, trade or SMEs and any impact on innovation would be minor. It is therefore concluded that the balance of these impacts favours the option of retaining mass as the utility parameter for 2020, but suggests that a debate on a future change to footprint is desirable. B. Environmental impacts Provided that the fleet composition remains constant, the choice of the utility parameter does not affect overall CO 2 emissions. However, as has been shown before, it can affect the costeffectiveness of these savings. The choice of the utility parameter would not be expected to have any effect on air quality. Autonomous changes need to be taken into account. With mass as the utility parameter there would be practically no change in target CO 2 emissions caused by autonomous weight EN 57 EN
59 increase because the overall average mass is adjusted every third year. In the case where footprint was chosen as a parameter a similar provision could be envisaged. With such a provision in place a change to footprint would lead to no change in CO 2 emissions, relative to using mass, or any impact on air quality. 76 It can be concluded that the choice between utility parameters does not have a direct significant environmental impact. C. Social impacts A shift from mass to footprint as the utility parameter might lead in the longer term to impacts on employment in the automotive suppliers sector, for example in the metal industries and automotive parts suppliers. However, these would represent shifts between sectors rather than employment losses and so on balance this is considered negligible. Social equity impacts can arise with a shift due to the differential cost impact on different classes of car. As shown in Table 8 and visible in Figure 10 and Figure 11, there is a significant difference in relative price increase with smaller cars having a larger percentage increase. Mass seems to lead to a more equal distribution of relative price increase between different size classes. However, footprint leads to smaller relative price increase for small vehicles which may be desirable from the social perspective (i.e. buyers of smaller cars tend to be more price sensitive). Set against this is the fact that the total cost of ownership for all car classes is expected to reduce due to the fuel savings outweighing the additional costs. In view of these impacts, footprint seems to be more socially equitable than mass Slope of the limit value curve - cars The options considered are for a range of limit value curve slopes between 60 and 100% of the 2009 fleet line of best fit. In terms of absolute slope, this spans the range of parameter 'a' from to This range also covers the most obvious slopes derived from the fleet data for other years (including 2006 or the average between 2006 and 2009) applying the same methodology as was used to determine the slope in the current Cars Regulation. In the case of mass, a 100% slope for 2020 (based on 2009 data), in absolute terms equal to , is much flatter than a 100% slope based on 2006 data of , and flatter than the current 60% slope based on 2006 data for the 130 gco 2 /km target for 2015 (in absolute terms ). These changes illustrate the way that manufacturers have already responded to the need to reduce CO 2 emissions. A. Economic impacts Average costs of compliance and distribution between van segments The additional average manufacturer cost for the new car fleet for different slopes are shown in Table 7. On average there is only a minor difference in these average costs between 60 and 76 Changing utility parameter to footprint would make electric vehicles slightly less attractive for manufacturers compared to the use of mass. This is because generally electric vehicles are heavier than their conventional (ICE) counterpart, because of the batteries (by 62 kg for medium and large vehicles). This increases their specific CO 2 emissions target with a mass based parameter (which would allow the manufacturer to have higher emissions from other vehicles). This increase would be 3.5 g CO 2 /km, but it only applies to that fraction of overall sales that are for electric vehicles. EN 58 EN
60 100% slope. Table 9 below shows the difference in cost by car segment depending on whether a 60% or 100% slope is chosen. It can be seen that the effect is broadly the same for both possible utility parameters and shows that for the lower slope the cost increase is smaller for small cars and larger for larger cars. Table 9 Additional manufacturer cost ( ) per car for different car categories relative to 130 gco 2 /km target showing cost difference for different slopes. Pe trol Diesel Utility function Mass Cost difference (100%- 60%) Footprint Cost difference (100%- 60%) Slope Small Medium Large Small Medium Large 100% of 2009 (a=0.0494) 60% of 2009 (a=0.0296) 100% of 2009 (a=29.4) 60% of 2009 (a=17.6) Manufacturer costs on average increase with increasing slope for both mass and footprint, although the effect is small. However, the percentage cost increases for smaller cars are greater than for larger ones as shown in Figure 10 and Figure 11. For petrol, small cars have between 3 times (slope 60%) and 4 times (slope 140%) the percentage increase of large petrol cars. For diesel, small cars have between 2 and 3 times the percentage increase of large diesel cars. Since the lower slope results in a lower divergence, this illustrates that for least competitive impact between segments a lower slope is desirable. Increasing slope also leads to decreasing cost-effectiveness since it requires more effort from smaller rather than from larger cars. This is because larger cars tend to be driven further than smaller ones, and therefore investment in their fuel efficiency delivers more CO 2 savings overall. Distribution of costs between manufacturers Different manufacturers have different portfolios and the share in their sales of different segments of cars varies. Because of the effects illustrated on different car segments the choice EN 59 EN
61 of slope of the curve will result in distributional impacts between manufacturers. These impacts for manufacturers are illustrated in Figure 12 (for mass) and Figure 13 (for footprint) which show the difference in relative price increase compared to the average price increase due to achieving the 130 gco 2 /km target for different manufacturers. In general it can be seen that the variation between individual manufacturers' relative price increases and the average relative price increase is smallest the lower the slope. This suggests that these would be the ones with the lowest distortionary impact on inter-manufacturer competition. Perverse incentives A slope above 100% is undesirable in the case of both parameters as it provides perverse incentives to manufacturers, i.e. increasing the parameter for the car in order to be able to comply with the specific target more easily, which in fact results in additional emissions. In the case of mass, a slope below 100% based on 2009 data should avoid a serious risk of gaming. Impacts on innovation, competitiveness, trade, SMEs The slope is not expected to have any significant effect on innovation, competitiveness, trade or SMEs. There has been no previous expectation of which slope would apply for 2020 so certainty is also not affected. Conclusion In view of the above, it is concluded that a lower slope is most desirable on economic grounds. B. Environmental impacts Changing the slope of the limit value curve does not directly cause any change in overall new car fleet CO 2 emissions per km. However, because larger cars are driven further than smaller cars, a lower slope leads to lower overall CO 2 emissions. A lower slope effectively helps to partly compensate for the lack of mileage weighting. There is a risk of a secondary effect of growth in emissions in the case where the overall average mass of the fleet increases. This secondary effect can happen in between the periods when this average mass is adjusted and is expected to be rather small (+0.25% over three years). See Annex 7.17 for more details. There is also a possible indirect impact on CO 2 emissions caused by behavioural change which depends on the slope of the curve. If the slope is made steeper it would require smaller relative CO 2 emissions reductions from heavier vehicles and thus these vehicles could become more interesting to sell. 77 In view of these factors, a lower slope is desirable on environmental grounds. 77 This secondary effect would lead to a further small increase in CO 2 emissions (although this would be compensated by the autonomous mass increase adjustment). However, evidence from the actual analysis of passenger car sales profiles for 2006 and 2010 suggests that such a shift should not happen. EN 60 EN
62 C. Social impacts The slope chosen is not expected to have any significant impact on employment. The lower the slope the more relative effort is required from larger vehicles, which would feed through into greater technology needs for them, but have a correspondingly lower impact on smaller vehicles. The slope of the limit value curve impacts on the distribution of effort between different segments of vehicles. In the case where the standards result in increased vehicle prices it is expected to have a differentiated effect on different social groups. The relative price increase expected due to compliance with the target is highest for small vehicles because of their relatively low price. The result of such price increases for smaller vehicles would be a relatively high impact on the buyers of cheaper small cars, which is likely to be less socially equitable. This effect is slightly alleviated with lower slopes of the limit value curves for both parameters. In view of these impacts, a lower slope is desirable to minimise the distributional impact on relative new car prices and be more socially equitable Utility parameter - vans Two options are assessed, mass or footprint. A. Economic impacts Average costs of compliance and distribution between van segments As with cars, the distributional effects of the vans Regulation vary with the utility parameter chosen. Table 10 shows the average additional manufacturer costs for meeting the 147 gco 2 /km target. The costs are very similar for both parameters and the overall average compliance cost for the target at 100% slope is around 15 cheaper with footprint, with the mass-based function resulting in a 3 to 16% increase in average costs as compared to footprint for slopes from 80% to 140% respectively. This is due to the costs increasing relatively more for manufacturers like Renault or GM with higher slopes of the mass-based function. Table 10 Average additional manufacturer costs per van relative to 175 gco 2 /km target for utility parameter and slope options. Cost in 60% 70% 80% 90% 100% 110% 120% 130% 140% mass- limit Linear based function Non-linear footprint-based limit function Cost difference footprint vs. mass EN 61 EN
63 Distribution of costs between manufacturers Overall, the relative retail price increase is more evenly distributed over manufacturers in the case of mass than in the case of footprint where a number of manufacturers face higher costs of meeting their targets (i.e. Isuzu, Mitsubishi, Toyota) due to large sales of pick-up trucks and all-terrain vehicles which have a relatively high average mass relative to their average footprint (see Table 11 and Figure 15). This high mass translates into relatively high energy consumption and therefore high CO 2 emissions. For these producers, it costs less to comply with a mass-based target. Daimler and Iveco are relatively sensitive to slope changes, particularly with footprint as the utility parameter. Table 11 Additional manufacturer costs relative to 2010 for all van manufacturers for the 100% slope of the mass- and footprint-based functions (in absolute terms for linear curve based on mass and 27.3 and 3.9 for non-linear curve based on footprint) Additional manufacturer cost relative to 2010 [ ] Daimler AG Fiat Ford General Motors Isuzu Iveco Mitsubishi Nissan PSA Renault Toyota Volkswagen Mass Footprint Cost difference footprint vs. mass EN 62 EN
64 Figure 14 Relative retail price increase per manufacturer for mass as utility parameter, compared to the average price increase. 5% Relative price increase compared to average [%] 4% 3% 2% 1% 0% -1% 60% slope 70% slope 80% slope 90% slope 100% slope -2% Daimler AG Fiat Ford General Motors Isuzu Iveco Mitsubishi Nissan PSA Renault Toyota Volkswagen Figure 15 Relative retail price increase per manufacturer for footprint as utility parameter, compared to the average price increase. 5% 4% 3% 2% 1% 0% -1% -2% Daimler AG Fiat Ford General Motors Isuzu Iveco Mitsubishi Nissan PSA Renault Toyota Volkswagen Relative price increase compared to average [%] 60% slope 70% slope 80% slope 90% slope 100% slope EN 63 EN
65 Perverse incentives The footprint of vans can be easily increased without large negative implications for CO 2 emissions (or performance). The fact that such changes can be easily made makes gaming with footprint relatively easy. The incentive for gaming would be especially strong for vehicles with a relatively low footprint, as the non-linear limit function 78 is relatively steep at this part of the curve. Certainty With regard to certainty, the current Regulation is based upon mass as the utility parameter. The time between compliance with the target of 175 gco 2 /km based on mass (for 2017) and the 147 gco 2 /km target (for 2020) is only three years. If footprint was selected as the utility parameter for the 2020 target, manufacturers with deviant mass-footprint ratios (as explained above) would have to drastically change their CO 2 reduction strategies in a relatively short period. As a result, while a change to footprint has a relatively small aggregate impact on cost, it has a large differential impact on manufacturers undermining competitive neutrality. It is evident that choosing the option of changing the utility parameter to footprint would undermine certainty. This concern was strongly expressed during the stakeholder consultation by automotive manufacturers concerned that changing utility parameter would be counter to the objective of a stable regulatory scheme and make compliance with the 2020 van targets more expensive Innovation With regard to innovation, there is unlikely to be an impact on most routes to meet the 2020 target with the exception of light-weighting. In this respect using mass as the utility parameter does not treat all options equally, as mentioned by various stakeholders during the consultation. This is undesirable since it does not enable cost optimal balancing of alternative reduction options, and in particular reduces the competitiveness of industries that can supply lower mass alternatives. Competitiveness, trade, SMEs With regard to EU industry competitiveness and similarly to the discussion on cars, it might be argued that alignment of utility parameter with other global markets might assist EU manufacturers. However, while the USA uses footprint as its utility parameter, other markets use mass (e.g. Japan, China, South Korea). Nevertheless, during consultations manufacturers have not argued for alignment as a reason to retain or change the parameter. Overall, the utility parameter for vans is not expected to have any impact on competitiveness, trade or SMEs and any impact on innovation would be minor. Conclusion In view of the arguments outlined above, on economic grounds footprint seems less desirable than mass due to the difficulties for manufacturers implicit in a change of approach within a three year period, the increased risks of perverse incentives, the need to use a non-linear limit 78 For more information on the non-linear limit function see Annex EN 64 EN
66 function and the large distributional impact. The average cost to manufacturer is quite similar for both parameters in case of slopes of 100% and below. It is thus concluded that retention of mass as utility parameter is to be favoured on economic grounds. B. Environmental impacts The impact of changing the utility parameter from mass to footprint would be CO 2 neutral over the fleet provided its composition remains constant. As for cars, changing the utility parameter to footprint would make electric vehicles slightly less advantageous because they would no longer have a high target as a result of their higher mass compared to their conventional (ICE) counterpart. Use of footprint could, in the medium term, lead to an overall increase in CO 2 emissions as it is considered to be easier to manipulate in vans. Footprint can be increased by stretching a van or increasing its wheelbase without large negative implications on CO 2 emissions of that van or its performance. This footprint increase would allow in aggregate more CO 2 emissions and could put at risk meeting the overall CO 2 reduction objective. This risk could be mitigated for larger vans by using a non-linear function levelling off above a certain footprint (see Annex 7.15 and section 5.5). This would remove the perverse incentive to build ever larger vans because they could no longer benefit from a proportionate increase of the CO 2 target. For vans, whose primary purpose is to move goods rather than people, expectations of autonomous mass increase are limited because this would compromise the load carrying potential of these vehicles. Therefore, the direct benefit of changing the utility parameter from mass to footprint would be even less important. It can be concluded that the options have no direct significant environmental impact. C. Social impacts Similarly to cars, a shift from mass to footprint as the utility parameter might lead in the longer term to impacts on employment in the automotive suppliers sector, for example in the metal industries and automotive parts suppliers. However, these would represent shifts between sectors rather than employment losses and so on balance this is considered negligible. Contrary to cars, no social equity impacts linked to differential cost impacts per van class are expected as vans are used for business purposes and chosen based on their utility. It can be concluded that the choice between utility parameters does not have a direct significant social impact Slope of the limit value curve - vans The options assessed are slopes between 80 and 100%. A. Economic impacts Average costs of compliance The relative price increase in case of mass is distributed most evenly over the manufacturers and vehicle segments around a slope of 100%. Furthermore, the average costs for meeting the EN 65 EN
67 147 gco 2 /km target are the lowest with a slope of 80-90%. This makes a slope value in the range % preferable from a distributional perspective. With footprint as the utility parameter the lowest overall average additional manufacturer cost occurs with a 110% slope, as shown in Table 10. Around this slope the additional manufacturer costs are distributed most evenly over the manufacturers and segments. This is influenced by a limited number of manufacturers with relatively high sales selling mostly large vans (e.g. Daimler and Iveco) that benefit from a higher slope as it results in a higher CO 2 target that they can comply with more easily. Distribution of costs between van classes The way the additional manufacturer costs and relative retail price increases 75 are distributed over the segments in case of mass and footprint is heavily influenced by the shape of the cost curves. Although the additional manufacturer costs as a function of the relative CO 2 reduction are quite similar for the three segments, the absolute and marginal costs for a given absolute CO 2 reduction are in most cases higher for larger vehicles than for smaller vehicles. This is due to the assumptions of the model 79 which solves for the optimum distribution of costs between segments, and predicts that manufacturers are likely to apply larger reductions to larger vehicles in their sales portfolio because it is more cost-effective. In the case of the mass-based limit value curve, differences in relative price increases between classes do not differ much with different slopes but tend to be the largest with lowest (60%) and highest (above 100%) slopes. Class I vans tend to have slightly higher relative price increase as compared to other classes in the case of slopes above 100% and the opposite for lower slopes. The difference is however very small, apart from the extreme cases analysed. The most even distribution is seen for the 100% slope (see Figure 16) and amounts to around 2.5% for all classes. In the case of the footprint-based limit function the most even distribution across van classes is seen with the slope of around % (see Figure 17). 79 In the model used in [TNO, 2012] it is assumed that manufacturers strive to minimise the additional manufacturer costs for meeting their average CO 2 emission target. The optimum distribution is characterised by equal marginal costs over the three size segments. Therefore, the model predicts that manufacturers are likely to apply larger reductions to the larger vehicles in their sales portfolio than to the smaller vehicles. EN 66 EN

.")
68 Figure 16 Relative retail price increase compared to 2010 per segment for mass as utility parameter per manufacturer. Figure 17 Relative retail price increase compared to 2010 per segment for footprint as utility parameter per manufacturer. As already mentioned, the most optimal way for manufacturers to meet their specific target implies that manufacturers apply larger absolute reductions to the larger vehicles in their portfolio (see footnote 79). As a consequence in the case of both utility parameters, the absolute and relative cost increase for large vehicles will tend to be larger than for small vehicles. The absolute cost increase (Figure 18 and Figure 19) will be slightly higher for all classes when mass is used as utility parameter. EN 67 EN


69 Figure 18 Manufacturer cost increase compared to 2010 per segment for mass as utility parameter per manufacturer, compared to maintaining 175 gco 2 /km until Figure 19 Manufacturer cost increase relative per segment for footprint as utility parameter per manufacturer, compared to maintaining 175 gco 2 /km until Perverse incentives With mass as the utility parameter, the risk of perverse incentives increases with increasing slope of the limit value curve. Therefore it is desirable to implement a slope not steeper than that currently used for the 175 gco 2 /km target for The 100% limit function based on the 2010 sales database is only slightly steeper than that for 2017 and therefore a slope of 100% or less relative to the 2010 data is desirable. In section 5 of the van study an 80% slope has been shown to be optimal with this respect. The risk of gaming with footprint leading to undesirably large vehicles suggests that in this respect a lower slope would be desirable. However, a lower slope (below 100%) increases the differences in cost impacts, especially for the manufacturer groups that sell typical vans - rather than pick-ups or all-terrain vehicles - and these represent the majority of the market. EN 68 EN
12747/12 ADD 3 KZV/mp 1 DG E 1B
 COUNCIL OF THE EUROPEAN UNION Brussels, 19 July 2012 Interinstitutional File: 2012/0191 (COD) 12747/12 ADD 3 COVER NOTE from: ENV 630 ENT 182 CODEC 1945 Secretary-General of the European Commission, signed
Proposal for a REGULATION OF THE EUROPEAN PARLIAMENT AND OF THE COUNCIL
 EUROPEAN COMMISSION Brussels, 8.11.2017 COM(2017) 676 final 2017/0293 (COD) Proposal for a REGULATION OF THE EUROPEAN PARLIAMENT AND OF THE COUNCIL setting emission performance standards for new passenger
Background to the consultation. Case Id: 10607d bbba-0c0dc66ac545 Date: 30/08/ :39:56
 Case Id: 10607d57-163-489-bbba-0c0dc66ac545 Date: 30/08/016 13:39:56 Consultation on the revision of Regulation (EU) No 443/009 and Regulation (EU) No 510/011 setting CO emission performance standards
COMMISSION OF THE EUROPEAN COMMUNITIES COMMISSION STAFF WORKING DOCUMENT. Accompanying document to the
 COMMISSION OF THE EUROPEAN COMMUNITIES Brussels, 19.12.2007 SEC(2007) 1723 COMMISSION STAFF WORKING DOCUMENT Accompanying document to the PROPOSAL FROM THE COMMISSION TO THE EUROPEAN PARLIAMENT AND COUNCIL
Proposal for a REGULATION OF THE EUROPEAN PARLIAMENT AND OF THE COUNCIL
 EUROPEAN COMMISSION Brussels, 20.9.2017 COM(2017) 538 final 2017/0232 (COD) Proposal for a REGULATION OF THE EUROPEAN PARLIAMENT AND OF THE COUNCIL amending Regulation (EU) No 1092/2010 on European Union
Council of the European Union Brussels, 4 July 2014 (OR. en) Mr Uwe CORSEPIUS, Secretary-General of the Council of the European Union
 Mr Uwe CORSEPIUS, Secretary-General of the Council of the European Union") Council of the European Union Brussels, 4 July 2014 (OR. en) Interinstitutional File: 2014/0201 (COD) 11598/14 PROPOSAL From: date of receipt: 3 July 2014 To: No. Cion doc.: Subject: ENV 655 COMPET 439
Council of the European Union Brussels, 4 July 2014 (OR. en) Interinstitutional File: 2014/0201 (COD) 11598/14 PROPOSAL From: date of receipt: 3 July 2014 To: No. Cion doc.: Subject: ENV 655 COMPET 439
COMMISSION STAFF WORKING DOCUMENT. Country Factsheet Malta. Accompanying the document
 EUROPEAN COMMISSION Brussels, XXX SWD(2015) 233 final COMMISSION STAFF WORKING DOCUMENT Country Factsheet Malta Accompanying the document COMMUNICATION FROM THE COMMISSION TO THE EUROPEAN PARLIAMENT, THE
WORKING PARTY NO 1 HARMONISATION OF TURNOVER TAXES
 EUROPEAN COMMISSION DIRECTORATE-GENERAL TAXATION AND CUSTOMS UNION Indirect Taxation and Tax administration VAT and other turnover taxes TAXUD/2131/07 rev 1 - EN Brussels, May 21, 2007 WORKING PARTY NO
14060/1/14 REV 1 AM/am 1 DG E 1A
 Council of the European Union Brussels, 20 October 2014 (OR. en) Interinstitutional File: 2014/0201 (COD) 14060/1/14 REV 1 NOTE From: To: General Secretariat of the Council Council ENV 816 COMPET 562 SAN
(Legislative acts) DIRECTIVE 2014/55/EU OF THE EUROPEAN PARLIAMENT AND OF THE COUNCIL of 16 April 2014 on electronic invoicing in public procurement
 DIRECTIVE 2014/55/EU OF THE EUROPEAN PARLIAMENT AND OF THE COUNCIL of 16 April 2014 on electronic invoicing in public procurement") 6.5.2014 L 133/1 I (Legislative acts) DIRECTIVES DIRECTIVE 2014/55/EU OF THE EUROPEAN PARLIAMT AND OF THE COUNCIL of 16 April 2014 on electronic invoicing in public procurement (Text with EEA relevance)
6.5.2014 L 133/1 I (Legislative acts) DIRECTIVES DIRECTIVE 2014/55/EU OF THE EUROPEAN PARLIAMT AND OF THE COUNCIL of 16 April 2014 on electronic invoicing in public procurement (Text with EEA relevance)
14641/12 EE/mb 1 DGE 1A
 COUNCIL OF THE EUROPEAN UNION Brussels, 5 October 2012 14641/12 Inte rinstitutional File: 2012/0278 (COD) ENV 750 AGRI 650 WTO 321 PI 116 DEVGEN 272 MI 604 SAN 221 PROPOSAL from: European Commission, dated:
Commission Green Paper on market-based instruments for environment and related policy purposes
 Commission Green Paper on market-based instruments for environment and related policy purposes 8 th Global Conference on Environmental Taxation 19 October 2007, Munich Manfred Rosenstock, Adela Tesarova
Proposal for a DIRECTIVE OF THE EUROPEAN PARLIAMENT AND OF THE COUNCIL. amending Directive 2012/27/EU on energy efficiency. (Text with EEA relevance)
") EUROPEAN COMMISSION Brussels, 30.11.2016 COM(2016) 761 final 2016/0376 (COD) Proposal for a DIRECTIVE OF THE EUROPEAN PARLIAMENT AND OF THE COUNCIL amending Directive 2012/27/EU on energy efficiency (Text
EUROPEAN COMMISSION Brussels, 30.11.2016 COM(2016) 761 final 2016/0376 (COD) Proposal for a DIRECTIVE OF THE EUROPEAN PARLIAMENT AND OF THE COUNCIL amending Directive 2012/27/EU on energy efficiency (Text
COUNCIL OF THE EUROPEAN UNION. Brussels, 16 June /09 Interinstitutional File: 2009/0076 (COD) ENV 440 MI 246 AGRI 267 CHIMIE 50 CODEC 849
 ENV 440 MI 246 AGRI 267 CHIMIE 50 CODEC 849") COUNCIL OF THE EUROPEAN UNION Brussels, 16 June 2009 11063/09 Interinstitutional File: 2009/0076 (COD) ENV 440 MI 246 AGRI 267 CHIMIE 50 CODEC 849 PROPOSAL from: European Commission dated: 12 June 2009
COUNCIL OF THE EUROPEAN UNION Brussels, 16 June 2009 11063/09 Interinstitutional File: 2009/0076 (COD) ENV 440 MI 246 AGRI 267 CHIMIE 50 CODEC 849 PROPOSAL from: European Commission dated: 12 June 2009
COUNCIL OF THE EUROPEAN UNION. Brussels, 29 May /1/07 REV 1
 COUNCIL OF THE EUROPEAN UNION Brussels, 29 May 2007 9943/1/07 REV 1 TRANS 183 COMPET 159 ENV 284 ECO 77 ECOFIN 231 ENER 150 RELEX 383 RECH 150 EDUC 96 SOC 230 TELECOM 72 MI 136 IND 52 MAP 17 FISC 87 REPORT
TOOL #47. EVALUATION CRITERIA AND QUESTIONS
 TOOL #47. EVALUATION CRITERIA AND QUESTIONS 1. INTRODUCTION All evaluations and fitness checks should assess the evaluation criteria of effectiveness, efficiency, coherence, relevance and EU added value
6266/16 AM/am 1 DG E 1A
 Council of the European Union Brussels, 22 February 2016 (OR. en) 6266/16 NOTE From: To: General Secretariat of the Council Council ENV 80 COMPET 63 AGRI 74 TRANS 49 MI 89 IND 34 CONSOM 35 ECOFIN 117 ENER
Reaction of the European Power Plant Suppliers to the ENVI Committee REDII Draft Opinion - Advanced Synthetic Fuels -
 04 July 2017 Reaction of the European Power Plant Suppliers to the ENVI Committee REDII Draft Opinion - Advanced Synthetic Fuels - EPPSA supports the EU s energy targets for 2030 and beyond, as well as
EUROPEAN PARLIAMENT. Committee on the Environment, Public Health and Food Safety CONSOLIDATED AMENDMENTS 26-35
 EUROPEAN PARLIAMT 2004 2009 Committee on the Environment, Public Health and Food Safety 2008/0013(COD) 5.10.2008 CONSOLIDATED AMDMTS 26-35 Draft report Avril Doyle (PE407.778v01-00) on the proposal for
Methodology for calculating subsidies to renewables
 1 Introduction Each of the World Energy Outlook scenarios envisages growth in the use of renewable energy sources over the Outlook period. World Energy Outlook 2012 includes estimates of the subsidies
15868/13 JB/mf 1 DGG 1B
 COUNCIL OF THE EUROPEAN UNION Brussels, 11 November 2013 (OR. en) 15868/13 Interinstitutional File: 2013/0253 (COD) EF 216 ECOFIN 988 CODEC 2479 REPORT From: To: Subject: Presidency Council Single Resolution
Proposal for a DIRECTIVE OF THE EUROPEAN PARLIAMENT AND OF THE COUNCIL
 Proposal for a DIRECTIVE OF THE EUROPEAN PARLIAMENT AND OF THE COUNCIL amending Directive 2003/88/EC concerning certain aspects of the organisation of working time (presented by the Commission) EN 1 EN
A binding energy savings target for 2030: The cornerstone for mutually supporting climate and energy policies Position Paper, 11 October 2013
 A binding energy savings target for 2030: The cornerstone for mutually supporting climate and energy policies Position Paper, 11 October 2013 Only a 40% binding energy savings target can deliver the EU
EBA/CP/2013/12 21 May Consultation Paper
 EBA/CP/2013/12 21 May 2013 Consultation Paper Draft Regulatory Technical Standards On Passport Notifications under Articles 35, 36 and 39 of the proposed Capital Requirements Directive Consultation Paper
COMMISSION STAFF WORKING DOCUMENT. Impact Assessment. Accompanying the document. Commission Regulations
 EUROPEAN COMMISSION Brussels, XXX [ ](2013) XXX draft COMMISSION STAFF WORKING DOCUMENT Impact Assessment Accompanying the document Commission Regulations implementing Directive 2009/125/EC of the European
Proposal for a DIRECTIVE OF THE EUROPEAN PARLIAMENT AND OF THE COUNCIL
 EUROPEAN COMMISSION Brussels, XXX [ ](2017) XXX draft Proposal for a DIRECTIVE OF THE EUROPEAN PARLIAMENT AND OF THE COUNCIL amending Directive 2009/73/EC concerning common rules for the internal market
Training programme GHG emission trends and projections
 Training programme GHG emission trends and projections 11 th lead reviewer meeting. Bonn, 7 March 2014 Barbara Muik, Programme Officer UNFCCC secretariat, MDA Outline of presentation Overview of the module
GLOBAL REDUCTION IN CO2 EMISSION FROM CARS: A CONSUMER S PERSPECTIVE
 GLOBAL REDUCTION IN CO2 EMISSION FROM CARS: A CONSUMER S PERSPECTIVE POLICY RECOMMENDATIONS FOR DECISION MAKERS November 2015 FOREWORD As part of the FIA mission to promote clean transport systems available
About Energy UK. Introduction
 REC 34-15 Energy UK response to DG Comp investigation of Investment Contract (early Contract for Difference) for Lynemouth power station biomass conversion 10 May 2015 About Energy UK Energy UK is the
EBA FINAL draft Regulatory Technical Standards
 RTS ON NOTIFICATIONS AND NOTICE OF SUSPENSION EBA/RTS/2015/04 3 July 2015 EBA FINAL draft Regulatory Technical Standards on procedures and contents of notifications referred to in Article 81(1), (2) and
EBA/RTS/2017/ December Final Report. Draft regulatory technical standards. on central contact points under Directive (EU) 2015/2366 (PSD2)
 2015/2366 (PSD2)") EBA/RTS/2017/09 11 December 2017 Final Report Draft regulatory technical standards on central contact points under Directive (EU) 2015/2366 (PSD2) FINAL REPORT ON CENTRAL CONTACT POINTS UNDER THE PSD2
EBA/RTS/2017/09 11 December 2017 Final Report Draft regulatory technical standards on central contact points under Directive (EU) 2015/2366 (PSD2) FINAL REPORT ON CENTRAL CONTACT POINTS UNDER THE PSD2
COMMISSION STAFF WORKING DOCUMENT. IMPACT ASSESSMENT for a 2030 climate and energy policy framework. [mandatory element] [mandatory element]
![COMMISSION STAFF WORKING DOCUMENT. IMPACT ASSESSMENT for a 2030 climate and energy policy framework. [mandatory element] [mandatory element]](/thumbs/72/67018909.jpg "COMMISSION STAFF WORKING DOCUMENT. IMPACT ASSESSMENT for a 2030 climate and energy policy framework. [mandatory element] [mandatory element]") EUROPEAN COMMISSION Brussels, XXX [ ](2013) XXX draft COMMISSION STAFF WORKING DOCUMENT IMPACT ASSESSMENT for a 2030 climate and energy policy framework Accompanying the document [mandatory element] [mandatory
EUROPEAN COMMISSION Brussels, XXX [ ](2013) XXX draft COMMISSION STAFF WORKING DOCUMENT IMPACT ASSESSMENT for a 2030 climate and energy policy framework Accompanying the document [mandatory element] [mandatory
7324/18 GDLC/LP/JU/ik 1 DGB 1B
 Council of the European Union Brussels, 20 March 2018 (OR. en) 7324/18 AGRI 143 OUTCOME OF PROCEEDINGS From: Presidency On: 19 March 2018 To: Delegations Subject: Communication on "The Future of Food and
Europaudvalget 2015 KOM (2015) 0572 Offentligt
 0572 Offentligt") Europaudvalget 015 KOM (015) 057 Offentligt EUROPEAN COMMISON Brussels, 18.11.015 SWD(015) 38 final COMMISON STAFF WORKING DOCUMENT Country Factsheet Slovenia Accompanying the document COMMUNICATION FROM
Europaudvalget 015 KOM (015) 057 Offentligt EUROPEAN COMMISON Brussels, 18.11.015 SWD(015) 38 final COMMISON STAFF WORKING DOCUMENT Country Factsheet Slovenia Accompanying the document COMMUNICATION FROM
15235/17 AT/ns 1 DGE 2B
 Council of the European Union Brussels, 12 December 2017 (OR. en) Interinstitutional File: 2016/0375 (COD) 15235/17 ER 485 CLIMA 334 CODEC 1968 NOTE From: Permanent Representatives Committee (Part 1) To:
CLEAN ENERGY FOR ALL EUROPEANS
 CLEAN ENERGY FOR ALL EUROPEANS Energy Community Energy Efficiency Coordination Group Vienna, 9 March 2017 Claudia Canevari Deputy Head of Unit European Commission DG ENERGY Why do we need this package?
Council of the European Union Brussels, 3 March 2017 (OR. en) Mr Jeppe TRANHOLM-MIKKELSEN, Secretary-General of the Council of the European Union
 Mr Jeppe TRANHOLM-MIKKELSEN, Secretary-General of the Council of the European Union") Council of the European Union Brussels, 3 March 2017 (OR. en) 6932/17 PECHE 87 DELACT 42 COVER NOTE From: date of receipt: 2 March 2017 To: No. Cion doc.: Subject: Secretary-General of the European Commission,
Council of the European Union Brussels, 3 March 2017 (OR. en) 6932/17 PECHE 87 DELACT 42 COVER NOTE From: date of receipt: 2 March 2017 To: No. Cion doc.: Subject: Secretary-General of the European Commission,
Council of the European Union Brussels, 5 October 2017 (OR. en) Mr Jeppe TRANHOLM-MIKKELSEN, Secretary-General of the Council of the European Union
 Mr Jeppe TRANHOLM-MIKKELSEN, Secretary-General of the Council of the European Union") Council of the European Union Brussels, 5 October 2017 (OR. en) 12947/17 COVER NOTE From: date of receipt: 4 October 2017 To: No. Cion doc.: Subject: EF 228 UEM 262 ECOFIN 793 INST 366 CODEC 1529 Secretary-General
Council of the European Union Brussels, 5 October 2017 (OR. en) 12947/17 COVER NOTE From: date of receipt: 4 October 2017 To: No. Cion doc.: Subject: EF 228 UEM 262 ECOFIN 793 INST 366 CODEC 1529 Secretary-General
30.X CLIMATE CHANGE - Council conclusions. The Council adopted the following conclusions: "The Council of the European Union,
 CLIMATE CHANGE - Council conclusions The Council adopted the following conclusions: "The Council of the European Union, 1. RECALLS the (Environment) Council conclusions of 20 February 2007 as well as the
IMPACT ASSESSMENT {COM(2009) 499 final} {COM(2009) 500 final} {COM(2009) 501 final} {COM(2009) 502 final} {COM(2009) 503 final} {SEC(2009) 1235}
 499 final} {COM(2009) 500 final} {COM(2009) 501 final} {COM(2009) 502 final} {COM(2009) 503 final} {SEC(2009) 1235}") EN EN COMMISSION OF THE EUROPEAN COMMUNITIES Brussels, 23.9.2009 SEC(2009) 1234 COMMISSION STAFF WORKING DOCUMENT accompanying document to the Proposal for a REGULATION OF THE EUROPEAN PARLIAMENT AND OF
EN EN COMMISSION OF THE EUROPEAN COMMUNITIES Brussels, 23.9.2009 SEC(2009) 1234 COMMISSION STAFF WORKING DOCUMENT accompanying document to the Proposal for a REGULATION OF THE EUROPEAN PARLIAMENT AND OF
POSITION June Circular Economy Proposal for a Directive amending Directive 2008/98/EC on Waste. Parliamentary Draft Report of Simona Bonafè, MEP
 POSITION June 2016 Circular Economy Proposal for a Directive amending Directive 2008/98/EC on Waste Parliamentary Draft Report of Simona Bonafè, MEP The European Aggregates Industry has embraced the imperative
GREEN PAPER. A 2030 framework for climate and energy policies
 EUROPEAN COMMISSION Brussels, 27.3.2013 COM(2013) 169 final GREEN PAPER A 2030 framework for climate and energy policies EN EN GREEN PAPER A 2030 framework for climate and energy policies 1. INTRODUCTION
15489/14 TA/il 1 DG E 2 A
 Council of the European Union Brussels, 20 November 2014 (OR. en) Interinstitutional Files: 2013/0028 (COD) 2013/0029 (COD) 15489/14 TRANS 528 CODEC 2240 NOTE From: To: General Secretariat of the Council
Clean Power for Transport. The Directive on the deployment of alternative fuels infrastructure
 Clean Power for The Directive on the deployment of alternative fuels infrastructure Brussels, 2 October 2015 The European alternative fuels strategy (1) What are the main policy drivers? Reduce the EU
The contribution of biofuels in transport sustainability post-2020
 EMISIA SA ANTONI TRITSI 21 SERVICE POST 2 GR 571 THESSALONIKI GREECE Date March 18, 214 Technical report EMISIA SA report No: 14.RE.2.V2 The contribution of biofuels in transport sustainability post-22
9101/15 TG/LM/add 1 DG G 3 A
 Council of the European Union Brussels, 22 May 2015 (OR. en) Interinstitutional Files: 2013/0049 (COD) 2013/0048 (COD) 9101/15 T 92 MI 338 CONSOM 88 COMPET 243 CODEC 761 UD 120 CHIMIE 29 COMER 73 NOTE
UEAPME 1 Evaluation and Impact Assessment of Recommendation 2003/361/EC concerning the definition of micro, small and mediumsized
 Position Paper UEAPME 1 Evaluation and Impact Assessment of Recommendation 2003/361/EC concerning the definition of micro, small and mediumsized enterprises Key Messages UEAPME members feel the SME definition
6155/18 KS/mb 1 DG E 1A
 Council of the European Union Brussels, 19 February 2018 (OR. en) 6155/18 NOTE From: To: General Secretariat of the Council Permanent Representatives Committee/Council ENV 78 MARE 2 MI 82 AGRI 81 IND 48
Legality of the Conformity Factors in the RDE tests
 Legality of the Conformity Factors in the RDE tests Opinion on the legality of the conformity factors in the implementing measures to introduce Real Driving Emission tests for light duty vehicles Contents
Emissions of greenhouse gases
 Emissions of greenhouse gases Emissions of CO 2 from transport (excluding international aviation and maritime transport) increased by 15% between 1990 and 1998, and now constitute 24 % of total CO 2 emissions.
Council of the European Union Brussels, 13 December 2017 (OR. en)
") Council of the European Union Brussels, 13 December 2017 (OR. en) Interinstitutional File: 2016/0379 (COD) 15237/17 ADD 1 NOTE ENER 487 ENV 1016 CLIMA 336 COMPET 841 CONSOM 384 FISC 322 CODEC 1970 From:
Council of the European Union Brussels, 13 December 2017 (OR. en) Interinstitutional File: 2016/0379 (COD) 15237/17 ADD 1 NOTE ENER 487 ENV 1016 CLIMA 336 COMPET 841 CONSOM 384 FISC 322 CODEC 1970 From:
COUNCIL OF THE EUROPEAN UNION. Brussels, 1 June /10 Interinstitutional File: 2008/0241 (COD) ENV 357 MI 183 CODEC 495
 ENV 357 MI 183 CODEC 495") COUNCIL OF THE EUROPEAN UNION Brussels, 1 June 2010 10351/10 Interinstitutional File: 2008/0241 (COD) V 357 MI 183 CODEC 495 NOTE from : Presidency to : Council No. prev. doc. : 9887/10 V 303 MI 156 CODEC
COUNCIL OF THE EUROPEAN UNION Brussels, 1 June 2010 10351/10 Interinstitutional File: 2008/0241 (COD) V 357 MI 183 CODEC 495 NOTE from : Presidency to : Council No. prev. doc. : 9887/10 V 303 MI 156 CODEC
COM(2017) 273 final. Information Note
 273 final. Information Note") COM(2017) 273 final Information Note 1. Proposal Proposal for a COUNCIL DECISION on the position to be adopted, on behalf of the European Union, in the European Committee for drawing up standards in the
COM(2017) 273 final Information Note 1. Proposal Proposal for a COUNCIL DECISION on the position to be adopted, on behalf of the European Union, in the European Committee for drawing up standards in the
Impact assessment of EU 2030 energy efficiency targets in the context of the Energy Union & Energy Efficiency First Towards a cost benefit analysis
 Impact assessment of EU 2030 energy efficiency targets in the context of the Energy Union & Energy Efficiency First Towards a cost benefit analysis Abstract The European Commission s impact assessment
WIND POWER TARGETS FOR EUROPE: 75,000 MW by 2010
 About EWEA EWEA is the voice of the wind industry actively promoting the utilisation of wind power in Europe and worldwide. EWEA members from over 4 countries include 2 companies, organisations, and research
25 % 20 % 15 % 10 % 5 % Share rail, inland waterways and oil pipelines 0 %
 Indicator fact sheet TERM 2003 13b EEA 17 Modal split in freight transport The share of road freight transport increased during the 1991 2000 period, whereas the modal share of short-sea shipping remained
Results from the Swedish Environmental Protection Agency analysis of the ESR-proposal
 1(15) SW E D I SH E N V IR O N M EN T A L P R OT E C T IO N AG E NC Y Results from the Swedish Environmental Protection Agency analysis of the ESR-proposal In short: The ambition in the 2030 climate framework
Consultation Paper. Draft Regulatory Technical Standards
 EBA/CP/2017/09 29 June 2017 Consultation Paper Draft Regulatory Technical Standards on the criteria for determining the circumstances in which the appointment of a central contact point pursuant to Article
TTIP- EU proposal for Chapter: Regulatory Cooperation
 TTIP- EU proposal for Chapter: Regulatory Cooperation Preamble to the TTIP: The Parties, having regard to: the importance of regulatory measures to achieve public policy objectives, and each Party s right
Council of the European Union Brussels, 15 December 2017 (OR. en)
") Council of the European Union Brussels, 15 December 2017 (OR. en) Interinstitutional File: 2016/0149 (COD) 15735/17 NOTE From: To: Presidency Permanent Representatives Committee POSTES 27 TELECOM 360 MI
Council of the European Union Brussels, 15 December 2017 (OR. en) Interinstitutional File: 2016/0149 (COD) 15735/17 NOTE From: To: Presidency Permanent Representatives Committee POSTES 27 TELECOM 360 MI
COUNCIL OF THE EUROPEAN UNION. Brussels, 16 May /14. Interinstitutional File: 2013/0027 (COD)
") COUNCIL OF THE EUROPEAN UNION Brussels, 16 May 2014 Interinstitutional File: 2013/0027 (COD) 9757/14 TELECOM 111 DATAPROTECT 69 CYBER 27 MI 419 CSC 103 CODEC 1264 NOTE from: Presidency to: Delegations
COUNCIL OF THE EUROPEAN UNION Brussels, 16 May 2014 Interinstitutional File: 2013/0027 (COD) 9757/14 TELECOM 111 DATAPROTECT 69 CYBER 27 MI 419 CSC 103 CODEC 1264 NOTE from: Presidency to: Delegations
Energy Efficiency and Climate Change Policies & Actions in the EU. RIETI, 7April 2010
 Energy Efficiency and Climate Change Policies & Actions in the EU RIETI, 7April 2010 Dimensions Global/international Regional National Local Links & interdependencies between dimensions Presentation/discussion
5965/18 OM/vc 1 DGG 1B
 Council of the European Union Brussels, 9 February 2018 (OR. en) Interinstitutional File: 2017/0350 (COD) 5965/18 EF 35 ECOFIN 90 SURE 9 CODEC 163 'I' ITEM NOTE From: To: Subject: General Secretariat of
STAKEHOLDER CONSULTATION GUIDELINES 2014 PUBLIC CONSULTATION DOCUMENT
 STAKEHOLDER CONSULTATION GUIDELINES 2014 PUBLIC CONSULTATION DOCUMENT 0 BACKGROUND TO CONSULTATION ON STAKEHOLDER CONSULTATION Stakeholder consultation helps EU law making to be transparent, well-targeted
Improving the EU ETS. Dr Bill Kyte OBE. The EU ETS as corner stone for the EU 2050 roadmaps. Warsaw 11 July 2012
 Dr Bill Kyte OBE The EU ETS as corner stone for the EU 2050 roadmaps Warsaw 11 July 2012 Agenda Why did the EU allowance price collapse? What are the possible scenarios? What measures are needed? 2 Long-term
UK Committee on Climate Change Call for Evidence: Scottish Climate Change Bill. Response from Stop Climate Chaos Scotland February 2017
 UK Committee on Climate Change Call for Evidence: Scottish Climate Change Bill Response from Stop Climate Chaos Scotland February 2017 The Scottish Government has committed to introducing a new Scottish
Public Consultation on a proposal for a mandatory Transparency Register
 Public Consultation on a proposal for a mandatory Transparency Register Response prepared by Transport & Environment (T&E) EU Transparency Register : 58744833263-19 May 2016 A. GENERAL PART (7 questions)
August THE APPOINTMENT OF THE AUDITOR AND THE DURATION OF THE AUDIT ENGAGEMENT: Striving for a Workable Single Market in the EU
 Federation of European Accountants Fédération des Experts comptables Européens Briefing Paper Standing for trust and integrity August 2014 THE APPOINTMENT OF THE AUDITOR AND THE DURATION OF THE AUDIT ENGAGEMENT:
EUROPEAN SEA PORTS ORGANISATION ASBL/VZW ORGANISATION DES PORTS MARITIMES EUROPEENS ASBL/VZW
 EUROPEAN SEA PORTS ORGANISATION ASBL/VZW ORGANISATION DES PORTS MARITIMES EUROPEENS ASBL/VZW European Commission Green Paper TEN-T: A policy review Towards a core and comprehensive network policy contribution
EUROPEAN UNION. Brussels, 25 April 2014 (OR. en) 2013/0084 (COD) PE-CONS 63/14 STATIS 39 SOC 185 ECOFIN 237 CODEC 711
 2013/0084 (COD) PE-CONS 63/14 STATIS 39 SOC 185 ECOFIN 237 CODEC 711") EUROPEAN UNION THE EUROPEAN PARLIAMT THE COUNCIL Brussels, 25 April 2014 (OR. en) 2013/0084 (COD) PE-CONS 63/14 STATIS 39 SOC 185 ECOFIN 237 CODEC 711 LEGISLATIVE ACTS AND OTHER INSTRUMTS Subject: REGULATION
EUROPEAN UNION THE EUROPEAN PARLIAMT THE COUNCIL Brussels, 25 April 2014 (OR. en) 2013/0084 (COD) PE-CONS 63/14 STATIS 39 SOC 185 ECOFIN 237 CODEC 711 LEGISLATIVE ACTS AND OTHER INSTRUMTS Subject: REGULATION
COUNCIL OF THE EUROPEAN UNION. Brussels, 23 May 2014 (OR. en) 9371/14 Interinstitutional File: 2010/0208 (COD) LIMITE
 9371/14 Interinstitutional File: 2010/0208 (COD) LIMITE") COUNCIL OF THE EUROPEAN UNION Brussels, 23 May 2014 (OR. en) 9371/14 Interinstitutional File: 2010/0208 (COD) LIMITE AGRI 340 AGRILEG 100 CODEC 1198 DENLEG 91 ENV 420 MI 402 NOTE From: To: Subject: Presidency
COUNCIL OF THE EUROPEAN UNION Brussels, 23 May 2014 (OR. en) 9371/14 Interinstitutional File: 2010/0208 (COD) LIMITE AGRI 340 AGRILEG 100 CODEC 1198 DENLEG 91 ENV 420 MI 402 NOTE From: To: Subject: Presidency
9821/10 ADD 1 LL/ng 1 DG I
 COUNCIL OF THE EUROPEAN UNION Brussels, 17 May 2010 9821/10 ADD 1 CONSOM 46 MI 147 COVER NOTE from: Secretary-General of the European Commission, signed by Mr Jordi AYET PUIGARNAU, Director date of receipt:
COUNCIL OF THE EUROPEAN UNION. Brussels, 27 June 2014 (OR. en) 11377/14 Interinstitutional File: 2014/0181 (NLE) COEST 226.
 11377/14 Interinstitutional File: 2014/0181 (NLE) COEST 226.") COUNCIL OF THE EUROPEAN UNION Brussels, 27 June 2014 (OR. en) 11377/14 Interinstitutional File: 2014/0181 (NLE) COEST 226 COVER NOTE From: To: No. Cion doc.: Subject: Secretary-General of the European
COUNCIL OF THE EUROPEAN UNION Brussels, 27 June 2014 (OR. en) 11377/14 Interinstitutional File: 2014/0181 (NLE) COEST 226 COVER NOTE From: To: No. Cion doc.: Subject: Secretary-General of the European
Workshop on developed country targets. Bangkok, 3 April EU contribution
 Workshop on developed country targets Bangkok, 3 April 2011 EU contribution 1 EU action so far: significant reductions, decoupled from GDP growth EU will meet the Kyoto target EU domestic emissions reduced
COMMISSION OF THE EUROPEAN COMMUNITIES. Draft INTERINSTITUTIONAL AGREEMENT. on the operating framework for the European regulatory agencies
 COMMISSION OF THE EUROPEAN COMMUNITIES Brussels, 25.02.2005 COM(2005)59 final Draft INTERINSTITUTIONAL AGREEMENT on the operating framework for the European regulatory agencies (presented by the Commission)
Proposal for a. REGULATION (EU) No / OF THE EUROPEAN PARLIAMENT AND OF THE COUNCIL
 No / OF THE EUROPEAN PARLIAMENT AND OF THE COUNCIL") EUROPEAN COMMISSION Brussels, 4.11.2010 COM(2010) 597 final 2010/0298 (COD) Proposal for a REGULATION (EU) No / OF THE EUROPEAN PARLIAMENT AND OF THE COUNCIL amending Regulation (EC) No 648/2004 as regards
EUROPEAN COMMISSION Brussels, 4.11.2010 COM(2010) 597 final 2010/0298 (COD) Proposal for a REGULATION (EU) No / OF THE EUROPEAN PARLIAMENT AND OF THE COUNCIL amending Regulation (EC) No 648/2004 as regards
Background paper. Electricity production from wind and solar photovoltaic power in the EU
 Background paper Electricity production from wind and solar photovoltaic power in the EU February 2018 1 The 2009 Lisbon Treaty gave the European Union (EU) the authority to develop an energy policy containing
TSI OPERATION AND TRAFFIC MANAGEMENT FINAL REPORT ON THE MERGING OF CONVENTIONAL RAIL AND HIGH SPEED TSIS
 INTEROPERABILITY UNIT RATION AND TRAFFIC MANAGEMENT FINAL REPORT ON THE MERGING OF CONVENTIONAL RAIL AND HIGH SPEED TSIS Reference: ERA/CON/2011-02/INT Document type: Final report Version : 0.8 Date :
Brussels, 28 May 2008 COUNCIL OF THE EUROPEAN UNION 10037/08 ADD 1. Interinstitutional File: 2008/0098 (COD) MI 167 ENT 110 COMPET 197 CODEC 676
 MI 167 ENT 110 COMPET 197 CODEC 676") COUNCIL OF THE EUROPEAN UNION Brussels, 28 May 2008 Interinstitutional File: 2008/0098 (COD) 10037/08 ADD 1 COVER NOTE from: MI 167 ENT 110 COMPET 197 CODEC 676 Secretary-General of the European Commission,
COUNCIL OF THE EUROPEAN UNION Brussels, 28 May 2008 Interinstitutional File: 2008/0098 (COD) 10037/08 ADD 1 COVER NOTE from: MI 167 ENT 110 COMPET 197 CODEC 676 Secretary-General of the European Commission,
The promotion of economic instruments for a green economy in the EU
 The promotion of economic instruments for a green economy in the EU EESC Hearing Creating the right incentives for the green economy Financial and Economic Instruments in Europe 29 October 2013, Brussels
EUROPEAN COMMISSION ENTERPRISE AND INDUSTRY DIRECTORATE-GENERAL
 17 NOVEMBER 2009 1 EUROPEAN COMMISSION ENTERPRISE AND INDUSTRY DIRECTORATE-GENERAL Industrial policy and economic reforms Sustainable Industrial Policy ENTR/B/1, LB-ME, D(2009) MINUTES OF MEETING Subject:
Strategie der EU für intelligentes, nachhaltiges und integratives Wachstum im Bereich der Chemikalienpolitik
 Strategie der EU für intelligentes, nachhaltiges und integratives Wachstum im Bereich der Chemikalienpolitik Klaus Berend Leiter des REACH Referats GD Unternehmen und Industrie Loccum, 21 Januar 2014 Overview
MEMORANDUM OF UNDERSTANDING BETWEEN THE SINGLE RESOLUTION BOARD AND THE EUROPEAN CENTRAL BANK IN RESPECT OF COOPERATION AND INFORMATION EXCHANGE
 MEMORANDUM OF UNDERSTANDING BETWEEN THE SINGLE RESOLUTION BOARD AND THE EUROPEAN CENTRAL BANK IN RESPECT OF COOPERATION AND INFORMATION EXCHANGE MEMORANDUM OF UNDERSTANDING BETWEEN THE SINGLE RESOLUTION
REPORT FROM THE COMMISSION TO THE EUROPEAN PARLIAMENT AND THE COUNCIL
 EUROPEAN COMMISSION Brussels, 28.7.2015 COM(2015) 362 final REPORT FROM THE COMMISSION TO THE EUROPEAN PARLIAMENT AND THE COUNCIL on the exercise of the power to adopt delegated acts conferred on the Commission
ENERGY SAVINGS 2020 EXECUTIVE SUMMARY. How to triple the impact of energy saving policies in Europe
 How to triple the impact of energy saving policies in Europe EXECUTIVE SUMMARY a contributing study to Roadmap 2050: a practical guide to a prosperous, low-carbon Europe C O N T E X T The EU has a primary
Road Rail Inland shipping Road Rail ... I/NP/AP/C/CC/A/ N/SWP I/NP/AP/C/CC/A/ N/SWP
 Summary............................................................................... In July 2008, the European Commission published a strategy for the internalisation of the external costs in the transport
Environmental LIFE CYCLE Information for Products Used Every Day in Households
 Environmental LIFE CYCLE Information for Products Used Every Day in Households INTRODUCTION The environmental performance of different product options is of growing importance to producers, retailers,
DRAFT OPINION. EN United in diversity EN. European Parliament 2017/0035(COD)
") European Parliament 2014-2019 Committee on Environment, Public Health and Food Safety 8.12.2017 2017/0035(COD) DRAFT OPINION of the Committee on the Environment, Public Health and Food Safety for the Committee
European Parliament 2014-2019 Committee on Environment, Public Health and Food Safety 8.12.2017 2017/0035(COD) DRAFT OPINION of the Committee on the Environment, Public Health and Food Safety for the Committee
Council of the European Union Brussels, 12 April 2018 (OR. en)
") Council of the European Union Brussels, 12 April 2018 (OR. en) Interinstitutional File: 2015/0907 (APP) 7597/18 NOTE PE 41 INST 134 FREMP 40 JUR 160 AG 4 From: Permanent Representatives Committee (Part
Council of the European Union Brussels, 12 April 2018 (OR. en) Interinstitutional File: 2015/0907 (APP) 7597/18 NOTE PE 41 INST 134 FREMP 40 JUR 160 AG 4 From: Permanent Representatives Committee (Part
European Parliament resolution of 8 March 2011 on the revision of the General Product Safety Directive and market surveillance (2010/2085(INI))
)") P7_TA(2011)0076 General product safety and market surveillance European Parliament resolution of 8 March 2011 on the revision of the General Product Safety Directive and market surveillance (2010/2085(INI))
P7_TA(2011)0076 General product safety and market surveillance European Parliament resolution of 8 March 2011 on the revision of the General Product Safety Directive and market surveillance (2010/2085(INI))
Committee on Agriculture and Rural Development
 EUROPEAN PARLIAMT 2014-2019 Committee on Agriculture and Rural Development 23.2.2015 2014/2146(INI) DRAFT REPORT on prospects for the EU dairy sector review of the implementation of the dairy package (2014/2146(INI))
COMMISSION STAFF WORKING DOCUMENT
 EUROPEAN COMMISSION Brussels, 8.11.2017 SWD(2017) 368 final COMMISSION STAFF WORKING DOCUMENT Assessing the amendments to Directive 2009/73/EC setting out rules for gas pipelines connecting the European
BEST addressed the use of clean vehicles and fuels. BEST focused on bioethanol, because of
 This report is the conclusion of BEST BioEthanol for Sustainable Transport, a four-year project to demonstrate the use of bioethanol in cars and buses. The project included ten sites BioFuel Region (SE),
THE COVENANT OF MAYORS FOR CLIMATE AND ENERGY
 THE COVENANT OF MAYORS FOR CLIMATE AND ENERGY We, the Mayors signing this Covenant, share a vision for a sustainable future - whatever the size of our municipality or its location on the world map. This
Statement Dr. Norbert Reithofer Chairman of the Board of Management of BMW AG Conference Call Interim Report to 31 March May 2013, 10:00 a.m.
 - Check against delivery - Statement Dr. Norbert Reithofer Chairman of the Board of Management of BMW AG Conference Call Interim Report to 31 March 2013, 10:00 a.m. Good morning, Ladies and Gentlemen,
mb item 5 doc 5 - EFSA External Evaluation - Prioritisation of recommendations from external consultants Management Board 14 March 2013 Parma
 mb 14 03 13 item 5 doc 5 - External Evaluation - Prioritisation of s from external EXECUTIVE OFFICE anagement Board 14 arch 2013 Parma eeting : Subject : anagement Board, Public Session External Evaluation
Consultation on an EU strategy for liquefied natural gas and gas storage
 Consultation on an EU strategy for liquefied natural gas and gas storage (EBA) Rue d Arlon 63-65 1040 Brussels BELGIUM Identification number in the transparency register: 18191445640-83 QUESTIONS & s responses
15239/17 GW/st 1 DGE 2B
 Council of the European Union Brussels, 13 December 2017 (OR. en) Interinstitutional File: 2016/0380 (COD) 15239/17 NOTE ENER 488 ENV 1017 CLIMA 337 COMPET 842 CONSOM 385 FISC 323 CODEC 1971 From: Permanent
TEXTS ADOPTED Provisional edition. Promotion of the use of energy from renewable sources ***I
 European Parliament 2014-2019 TEXTS ADOPTED Provisional edition P8_TA-PROV(2018)0009 Promotion of the use of energy from renewable sources ***I s adopted by the European Parliament on 17 January 2018 on
The Clean Energy package. Position of the Austrian electricity industry
 The Clean Energy package Position of the Austrian electricity industry The Clean Energy package On 30 November 2016, the European Commission published a wide-ranging package of measures entitled Clean