Behavioral economics of waste management: Identifying factors that influence personal waste sorting practices
|
|
|
- Charles Small
- 6 years ago
- Views:
Transcription
1 Behavioral economics of waste management: Identifying factors that influence personal waste sorting practices Lauren Menzer 1, Isadora Parnell-Wolfe 1, Matthew O Carroll 2, Dusty Perkins 3 Abstract: The University of California system-wide goal of Zero Waste by 2020 continues to both encourage and challenge campuses to increase their waste diversion practices. While the infrastructure necessary for improving waste management practices has been introduced at University of California, Santa Barbara (UCSB), waste audits have revealed that poor personal waste sorting practices are a limiting factor in the overall effectiveness of waste programs, and have the ability to negate many benefits of the structural improvements. The Refuse & Recycling Research Center at UCSB has focused on analyzing individuals interactions with their waste in order to improve better personal waste management practices. Over 1,300 individuals were observed and data on their specific interactions with their waste materials, receptacles, and signage were recorded. After identifying common trends, it was determined that the initial signage created confusion and was inhibiting individuals from correctly sorting their waste. New signage was developed and introduced, which ultimately resulted in an overall 10% increase in the waste diversion rate in total. While there are additional strategies that can be applied, the implementation of the new signage prompted a behavioral change in how individuals disposed of their waste. Keywords: landfill; compost; recycling; BigBelly Solar; PLA 7; diversion rate; serviceware; chisquare analysis 1 Refuse & Recycling Research Center, Facilities Management - University of California at Santa Barbara, Goleta, CA 93106; refuserecyclingresearch@fm.ucsb.edu 2 Facilities Management - University of California at Santa Barbara, Goleta, CA Department of Life Sciences - College of Western Idaho, Nampa, ID
2 INTRODUCTION... 3 METHODOLOGY... 4 Locations... 4 Initial s... 5 Additional Variables... 5 Signage Redesign... 6 Additional Variables Applied... 6 Secondary... 6 Data Analysis... 7 RESULTS... 7 DISCUSSION Differences between Eateries Disposal of PLA 7 Products Additional s FUTURE RESEARCH ACKNOWLEDGMENTS APPENDICES
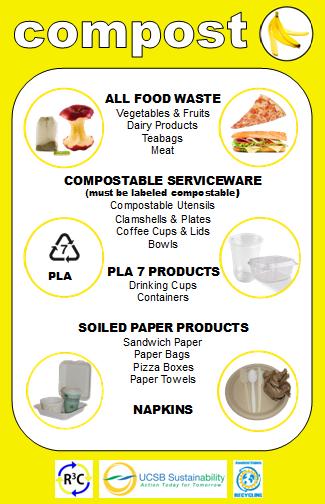
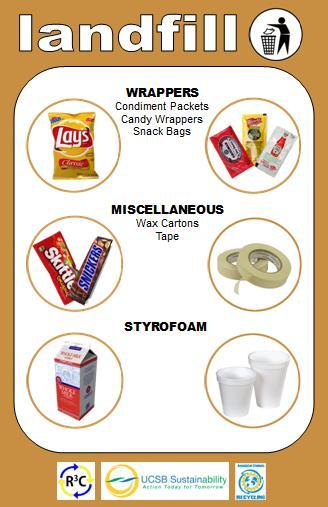
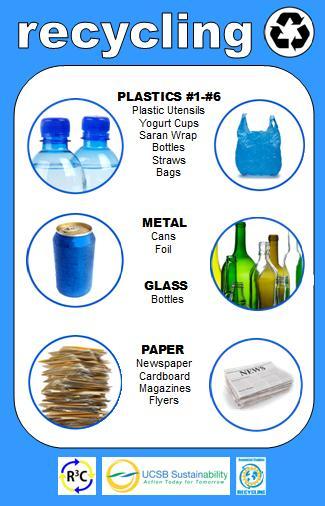
3 INTRODUCTION The University of California-wide goal of Zero Waste by 2020 continues to encourage and challenge UC campuses to increase their waste diversion practices. The University of California, Santa Barbara (UCSB) has been successful in implementing sustainability programs through infrastructure updates and behavioral modification. However, with new products and technology being continuously introduced, in addition to the annual turnover of students, behavioral modification towards sustainability initiatives is an important factor in helping UCSB achieve its sustainability goals. In regards to waste management, UCSB currently diverts 70% of its waste from the landfill; however, in order to improve the waste diversion percentage, focusing on behavioral modification is of the utmost importance, as an individual s decision of where they place their waste is the determining factor of success for many waste management programs. The Refuse & Recycling Research Center (R 3 C) at UCSB has sought to improve the University s waste management practices. The purpose of this study was to gain a better understanding of the relationship that exists between individuals and the campus waste infrastructure as they dispose of their waste. A total of around 1,300 individuals and their interactions with the waste that they disposed of at campus waste receptacles were observed. The UCSB campus is approximately 1,055 acres and is home to around 26,000 students, faculty and staff, as well as many visitors. At UCSB, the waste infrastructure is comprised of three waste streams: landfill, recycling, and compost. While landfill and recycling receptacles can be found throughout the campus, many of the compost receptacles are located within the vicinity of the campus eateries. The following materials can be accepted in aforementioned waste streams: Recycling: Plastics 1-7, glass, metal, newspaper, cardboard, office paper, magazines, plastic wrap Landfill: chip bags, snack bags, candy bar/granola wrappers, Styrofoam, contaminated materials, tape, Mylar Compost: all food scraps, soiled paper products, PLA 7 products, compostable serviceware that meets ASTM D6400 requirements While there is not a definite campus standard for waste receptacles at UCSB, the most commonly found outdoor bins are (APPENDIX I): Open-top: round cylinder bins with a circular opening; many of these have now been paired to include both recycling and landfill Bertha Clusters: a receptacle with four openings, one for the following newspaper, aluminum and plastics #1-6, office pack, and landfill BigBelly Solar: solar-powered compacting receptacles used for recycling, landfill, and compost; each has a hopper door 3
4 In total, the University has 316 landfill receptacles, 97 recycling receptacles, and 6 compost receptacles. The BigBelly Solar receptacles are the main public outdoor receptacles that are designated for compost, which are located around the central public eateries. Based on previous campus waste audits and informal observations at each of the central public eateries, it was believed that personal waste sorting practices could be improved, which would have a notable impact on increasing the University s overall waste diversion percentage. Given that these are high traffic areas and significant amounts of materials are disposed of in these locations relative to other parts of campus, the campus eateries and their patrons were quickly identified to be the focus of this study. It was predicted that individuals would look at both the bin signage and at their specific items in hand in order to aid them with disposing their materials into the correct waste receptacles. In addition to this, it was believed that individuals would be exceptionally knowledgeable of recycling practices and that the majority of recyclable waste would be placed into the recycling bin. METHODOLOGY Locations The observations of this study were focused at three main campus eateries: The Arbor, Coral Tree Café, and Courtyard Café, each of which are operated by the University Center (UCen), UCSB s oncampus dining services unit; however, each eatery has their own defining characteristics. The Arbor is centrally located on the Main Campus and receives consistent foot traffic from the campus community, as it is located along the main campus corridor and across from the library. Items sold at The Arbor include products from the UCen and snack items from a variety of outside vendors. The Arbor is also home to two l eased tenants, Woodstock s, a pizzeria, and Subway. In addition, two food carts operated by outside vendors are located in the vicinity of The Arbor. The Arbor has outdoor seating and table arrangements of around 29 tables with approximately 116 seats, which are set up in a rectangular formation. While The Arbor features one of the BigBelly Solar receptacles, it also has six open-top landfill receptacles scattered throughout the outdoor seating area. The Coral Tree Café is located on the Main Campus adjacent to academic and administrative buildings. Items sold at Coral Tree Café include products from the UCen and snack items from a variety of outside vendors. There are no outside vendors or leased tenants at Coral Tree Café. It has both indoor and outdoor seating. The outdoor seating features around 40 tables with a mix of twoperson and four-person tables. The outdoor waste infrastructure originally included one BigBelly Solar receptacle along with three open-top landfill receptacles, all of which were dispersed throughout the outdoor seating area. In between the initial and second observational periods, the three open-top landfill receptacles were removed. 4
5 The Courtyard Café is located on the outer edge of the Main Campus adjacent to academic buildings that primarily have a science focus. Items sold at Courtyard Café include products from the UCen and snack items from a variety of outside vendors. Courtyard Café is also home to one leased tenant, Yoshinoya. Courtyard Café has both indoor and outdoor seating. The outdoor seating features around 20 tables with approximately 80 seats. The tables are arranged in an L shape with the majority being located on the east side of the building. The outdoor waste infrastructure originally included one BigBelly Solar receptacle along with four open-top landfill receptacles. In between the initial and second observational periods, three of the four open-top landfill receptacles were removed. Initial s Approval for this project from the Office of Research at UCSB was received prior to the start of observations. Individuals were initially observed at the outdoor seating areas of the Coral Tree Café, Courtyard Café, and The Arbor (described above). s were conducted by two studentresearchers at each of the sites. The initial observation period was seven weeks long (October 1 st November 18 th, 2013) and included a total of around 50 hours of observation. s were primarily conducted between the hours of 11am-1pm, in order to target the busiest times at each of the eateries. During each of the observation sessions, notes were recorded on individuals and their waste sorting practices as they approached the bins and at the time of disposal. The following notes were recorded by the observers: gender, alone or in a group (if in a group, number of individuals); whether or not they looked at the materials; whether or not they looked at the bin signage; student or non-student; appropriate waste stream for the material; the waste stream the material was placed; notes on the specific material type in hand. Additional information was recorded on the individual s specific interactions when pertained to the overall purpose of the study. On particular occasions, notes were taken on the individual s specific path to and from the waste receptacles; observations were also conducted for open-top receptacles in the nearby areas (APPENDIX II). Additional Variables Aggregating data from initial observations encouraged a two-day waste audit. The waste audit for each location was conducted using methods outlined by Associated Students Recycling at UCSB. The waste audit provided additional insight about personal waste sorting practices, which included individuals combining different materials into a single container, as well as the confusion around certain materials and their appropriate waste streams. In addition, the initial observation revealed that compostable and recyclable material were being disposed of in the unpaired, open-top landfill bins at each location due to their abundance and spatial convenience. It was also observed that individuals that did take the time to read the waste signage often sorted their waste incorrectly. The 5
6 aforementioned observations promoted the development and pilot of new waste signage along with the removal of all outdoor open-top landfill receptacles at Courtyard Café and Coral Tree Café. Signage Redesign Signage redesign was based on the observations made from the initial observational period. Although uniform in formatting for each waste stream, the initial signage (Signage A) at UCSB contained significant amounts of pictures and words (APPENDIX III). Specifically it displayed cluttered photos that did not address materials specific to what would be disposed of at the public receptacles, the words listed were repetitive and difficult to read due to the small font, and many of the materials were outdated since new compostable materials had been introduced to the eateries. Two formats of new signage were piloted, both with updated pictures pertaining to what specifically was being disposed of at the public eateries. An all pictorial signage (Signage B) was created in addition to another format that contained both pictures and words (Signage C). In the new signage, each of the pictures were enclosed with a circle and enlarged, in an effort to draw attention to the items. The font was also significantly enlarged in the new signage that contained words (APPENDIX III). The new signage formats, in addition to the initial signage were displayed together, and then an informal survey to the campus community was conducted at the on-campus farmers market. Data from the survey suggested that Signage C was the most appealing and would help individuals sort their waste more effectively and efficiently. Additional Variables Applied In addition to bin signage, three different types of informational signage were introduced at each location. At The Arbor Café, signage at the cashier check-out stand was introduced that reminded individuals throw their items away at the BigBelly Solar receptacles outside; at the Coral Tree Café small signage was placed on the shelves inside the café that indicated if the material was recyclable, landfill or compostable; at the Courtyard Café signage was placed on the entrance/exit door reminding individuals to dispose of their items in the BigBelly Solar receptacles (APPENDIX IV). Secondary The secondary observation followed the same methodology as the initial observational period. The secondary observational period included around 26 hours of observation over the course of 5 weeks (April 1 st May 1 st, 2014). Again, on particular occasions, notes were taken on the individual s specific path to and from the waste receptacles. 6
7 Data Analysis Throughout both observational periods, a diverse amount of materials were disposed of. In order to ease the process of analyzing the amount of data collected the most commonly thrown away items were identified and grouped together under consistent headings. For example, there were many different types of paper products disposed of, such as fliers, magazines, and envelopes; yet, for the sake of analyzing the data, these related materials were categorized under the more general heading of paper, as the aforementioned paper products can be recycled together at UCSB. After organizing the data into specific groups of materials, the data from both the initial and secondary observations were analyzed into the following main categories: Total Properly Sorted Material: percentage of the total materials correctly sorted into each of the three waste streams (recycling, landfill, and compost)at all three eateries (APPENDIX V) Properly Sorted Material at The Arbor: percentage of the total materials correctly sorted into each of the three waste streams (recycling, landfill, and compost) from The Arbor Properly Sorted Material at Coral Tree Café: percentage of the total materials correctly sorted into each of the three waste streams (recycling, landfill, and compost) from Coral Tree Café Properly Sorted Material at Courtyard Café: percentage of the total materials correctly sorted into each of the three waste streams (recycling, landfill, and compost) from Courtyard Café In addition to the categories listed above, the data was further broken down into the following two categories: Specific Material Sorting Rates: individual sorting rate calculations for specific materials (APPENDIX V) Contents of Waste Receptacles: what the contents and their respective waste stream were of each recycling, landfill, and compost bins. (APPENDIX V) RESULTS In the initial observation period of 50 hours, 638 individuals along with 1,218 discarded materials were observed. In the second observational period of around 26 hours, 661 individuals along with 1,221 discarded materials were observed. In total, 1,299 individuals and 2,439 discarded materials were recorded in 76 hours of observation. 7
8 The following figures represent the percentage of materials sorted correctly at each of the three eateries along with the total percentage of materials sorted correctly for both the initial and secondary observational periods: Percentange of Material Sorted Correctly at The Arbor 80% 70% 60% 50% 72% 64% 60% 69% 45% 50% 54% 40% 34% 30% 20% 10% 0% Initial Secondary Initial Secondary Initial Secondary Initial Recycling Landfill Compost TOTAL Secondary Figure 1: Percentage of material sorted correctly at The Arbor for both the initial and secondary observational periods From the initial to the secondary observational period, the correct sorting rate for recycling at The Arbor decreased by 8%. However, the correct sorting rate for landfill materials increased by 9%, and the correct sorting rate for compostable materials increased by 11%. This resulted in an overall 4% increase in the correct sorting rate at The Arbor. 8
9 80% 70% 60% 50% 40% 30% 20% 10% Percentage of Material Sorted Correctly at Coral Tree Café 69% 60% 55% 54% 48% 48% 43% 59% 0% Initial Secondary Initial Secondary Initial Secondary Initial Recycling Landfill Compost TOTAL Secondary Figure 2: Percentage of material sorted correctly at Coral Tree Café for both the initial and secondary observational periods From the initial to the secondary observational period, the correct sorting rate for recycling at Coral Tree Café decreased by 1%. However, the correct sorting rate for landfill materials increased by 26%, and the correct sorting rate for compostable materials increased by 12%. This resulted in an overall 11% increase in the correct sorting rate at Coral Tree Café. 9
10 Percentage of Material Sorted Correctly at Courtyard Café 90% 80% 70% 60% 50% 66% 47% 71% 78% 44% 64% 48% 61% 40% 30% 20% 10% 0% Initial Secondary Initial Secondary Initial Secondary Initial Recycling Landfill Compost TOTAL Secondary Figure 3: Percentage of material sorted correctly at Courtyard Café for both the initial and secondary observational periods From the initial to the secondary observational period, the correct sorting rate for recycling at Courtyard Café decreased by 19%. However, the correct sorting rate for landfill materials increased by 7%, and the correct sorting rate for compostable materials increased by 20%. This resulted in an overall 13% increase in the correct sorting rate at Courtyard Café. 10
11 Total Percentage of Material Sorted Correctly 80% 70% 66% 71% 60% 58% 59% 58% 58% 50% 40% 44% 48% 30% 20% 10% 0% Initial Secondary Initial Secondary Initial Secondary Initial Secondary Recycling Landfill Compost TOTAL Figure 4: Percentage of material sorted correctly for both the initial and secondary observational periods From the initial to the secondary observational period, the combined correct sorting rate for recycling at each of the three eateries decreased by 8%. However, the comprehensive correct sorting rate for landfill materials increased by 12% and the comprehensive correct sorting rate for compostable materials increased by 14%. This resulted in an overall 10% increase in the total correct sorting rate at each of the three eateries. Chi-Square Analysis A chi-square analysis was conducted with Professor Dusty Perkins in order to determine if the correlation between signage redesign and implementation was statistically significant. For recycling, the results show that X2 exceeds the test statistic for P= 0.05 (X2 table=3.84 ), indicating that there is less than a (5%) chance that the relationship between signage redesign and the change in pre-signage vs. post-signage waste sorting practices are due to chance alone. In this case however, the post-signage period had significantly lower sorting rates than expected by random chance. The chi-square analysis for landfill s waste sorting habits provides that the test statistic from the X2 analysis falls between P=0.1 and 0.05 on the contingency table, indicating that there is a greater that 5% (and less than 10% chance) that the results observed are due to chance alone. Because the probability value is greater than the pre-determined value of P=0.05, there is no significant difference in landfill sorting rates based upon pre and post-signage periods. However, because the test result is less than 11
12 P=0.1, there is the possibility that signage alteration would have a different effect. The lack of statistical significance found here can most likely be attributed to the fact that incorrect sorting values differ little among pre- and post-signage observation periods. Further sampling to increase the sample size may offer statistically significant support for this analysis. Lastly, for compost the test statistic from the X2 greatly exceeds the test statistic for P= 0.05 (X2 table=3.84). This indicates that there is much less than (5%) chance that the results observed here could be due to chance alone, and conclude that there is a significant difference in compost sorting rates based upon pre and post-signage periods. DISCUSSION Differences between Eateries There are many notable distinctions between each of the three eateries which can aid in understanding the differences between the graphs above. Due to the specific location of each eatery in relation to the campus layout, different types of groups of the campus community tend to frequent certain eateries more than others, and in addition to this, tend to utilize each eatery for different purposes. Several other factors such as the arrangement of the outdoor seating areas and the variety of products sold at each eatery impacted the results of this study. The Arbor Since The Arbor is located directly across from the campus library and is in the middle of the central walkway that cuts through the campus, it is frequented by students, faculty, staff, and visitors but primarily used by undergraduate students as they make their way through campus. Thus, the Arbor s data reflects waste that was more often thrown away by individuals who were passing by on their way to their next destination rather than stationary individuals that had recently finished a meal. The Arbor also functions as the main location on campus where student and off-campus organizations table and advertise their groups by handing out fliers and other promotional materials. In addition to the presence of off-campus and student organizations, The Arbor also contains two leased tenants along with two nearby food carts. This means that The Arbor s waste stream is significantly diverse and varies on a daily basis. The more diverse a waste stream is, the more confusing and complex it is for individuals to sort and dispose of their materials properly. The overall percentage of recyclable material sorted correctly at The Arbor decreased between the initial and secondary observational periods. One possible explanation for this could be that during the secondary observational period, fewer groups tabled at The Arbor. When groups table, they often hand out fliers, the majority of which are disposed of almost immediately by the recipients. During the initial observational period, many groups were tabling at The Arbor as it was a time 12
13 where most student organizations were recruiting new members. The amount of students present and types of organizations present could have influenced the type of material disposed of. The overall percentage of both landfill and compostable material sorted correctly at The Arbor increased between the initial and secondary observational periods. This can likely be attributed to the implementation of the newer and clearer signage. Between the initial and secondary observational periods, there was a slight increase in the overall percentage of material sorted correctly at The Arbor. This 4% increase was notably smaller than the percentage increases recorded at both Coral Tree Café and Courtyard Café. There are several explanations for why The Arbor only experienced a minor increase in its overall percentage of material sorted correctly. First, as mentioned earlier, The Arbor has a significantly diverse waste stream, one that is more diverse than the waste streams at either of the two other eateries. The diversity of The Arbor s waste stream makes it difficult to design signage that incorporates a wide enough variety of materials and items. Secondly, unlike at the other two eateries, the open-top landfill receptacles at The Arbor were not removed from the area. These open-top landfill receptacles were still heavily utilized during the secondary observational period, meaning that many compostable and recyclable materials were still disposed of into a landfill receptacle. Lastly, The Arbor does not have a consistent customer base. Every day, thousands of different individuals pass through The Arbor, making it more difficult for The Arbor to establish a consistent customer base that is familiar with The Arbor s products. The larger and more diverse a customer base, the more difficult it is to establish familiarity with the products, a step which aids in the process of correctly sorting materials. A combination of these factors explains why there was only a slight increase in the total percentage of material sorted correct at The Arbor. Coral Tree Café Coral Tree Café, which is surrounded by both academic and administrative buildings, is mainly frequented by staff and faculty members and is primarily used for sit-down lunches and meetings. Thus, the data collected from Coral Tree Café reflects waste that was often thrown away by staff or faculty members who had just finished lunch. The overall percentage of both landfill and compostable material sorted correctly at Coral Tree Café significantly increased. This again, is likely to have been caused by the implementation of the new signage. On top of this, while no formal studies were conducted on the effectiveness of the additional signage that was placed inside of Coral Tree Café (signage which indicated beneath each product as to which waste stream it should be disposed into), it is possible that this signage contributed to the increases in both of these percentages. Additionally, unlike at The Arbor, Coral Tree Café has a relatively consistent customer base, making it easier for individuals to familiarize themselves with the café s products. When individuals are more familiar with products, it becomes more likely that they will sort the products correctly. This is another factor that could have contributed to the two increases in percentages discussed above. The overall percentage of recyclable material sorted correctly at Coral Tree Café decreased by 1%, an almost negligible amount. Thus, the overall recycling rate at Coral Tree Café remained relatively stagnant and unchanged, which could have been likely attributed to the consistent customer base. 13
14 Coral Tree Café s relatively high overall percentage rate of compostable material sorted correctly is likely due to the café s high usage of compostable materials. The café uses compostable plates, napkins, utensils, bowls, clamshells, and cups. Coral Tree Café provides a higher amount of compostable materials than either of the two other eateries. This can be attributed to the café s lack of having a leased tenant and in turn, having a relatively consistent and controlled waste stream because of minimal diversity in their packaging and items sold at the eatery. Because of this breadth of compostable materials, many individuals were able to dispose of their materials as a single unit. When items belonging to the same waste stream can be disposed of together it becomes easier for individuals to place these items into the correct waste streams. Thus, many individuals were able to dispose of all of their items into the compost receptacle as a single unit, which is likely to have contributed to Coral Tree Café s overall high percentage rate of compostable material sorted correctly. Between the initial and secondary observational periods, Coral Tree Café experienced an 11% increase in its overall percentage of material sorted correctly. As mentioned earlier, much of this is due to the implementation of the new signage. However, the removal of the three open-top landfill receptacles also contributed to this increase in the percentage. By removing the bins, individuals who ate outside were then directed to utilize the recycling and compost units of the BigBelly Solar receptacles. Courtyard Café Courtyard Café, which is surrounded primarily by science-focused buildings, has a consistant customer base, many of which are graduate students who come to eat at the café for lunch. Thus, the data collected from Courtyard Café reflects waste that was often thrown away by graduate students. The café is also home to one leased tenant, Yoshinoya, a Japanese fast food chain. At the beginning of the academic school year, Yoshinoya was contracted to provide 100% compostable food packaging. However, during the initial observational period of the study, it was discovered that Yoshinoya was using several products that were not compostable, the main one being a plastic bowl made of polypropylene. In addition to this, Yoshinoya handed out plastic bags with every order. In between the initial and secondary observational periods, Yoshinoya was contacted about these issues and as a result, ceased to automatically hand out plastic bags with every order. They are still currently working on finding a compostable alternative to their plastic bowls. It is important to note that Yoshinoya uses a compostable clamshell which differs in appearance to the other compostable clamshells used by the University at Coral Tree Café. The compostable clamshells at Coral Tree Café are beige and paper-based, while the compostable clamshells used at Yoshinoya are black and PLA 7 plastic, making them less easily identifiable as compostable. The overall percentage of recyclable material sorted correctly at Courtyard Café decreased between the initial and secondary observational periods. One possible explanation for why this occurred can be attributed to the significant decrease in the amount of plastic bags that were handed out at Yoshinoya. During the initial observational period, when Yoshinoya was handing out plastic bags to every customer, the majority of individuals grouped all of their items into the plastic bag before 14
15 throwing the bag away as a single unit. Most of these plastic bags were disposed of in either the landfill or recycling receptacles. Because of this, it was difficult to identify which materials were being disposed of into which waste streams and many materials went uncounted for. Once Yoshinoya altered their policy of handing out plastic bags, a significant decrease in the disposal of the filled plastic bags as a single unit was noted. This change in policy placed Yoshinoya customers into a new position where they were encouraged to sort their materials rather than throwing them away as a single unit inside of a plastic bag. The decrease in the overall percentage of recyclable material sorted correctly at Courtyard Café could be attributed to the fact that once individuals were encouraged to sort their materials, they were less knowledgeable about which products were recyclable than had previously been thought. Additionally, there is another explanation for why the overall percentage of recyclable material sorted correctly at Courtyard Café decreased. By removing three of the four open-top landfill receptacles, more individuals were encouraged to utilize the BigBelly Solar receptacles, receptacles which many individuals are more unfamiliar with. The switch from using the open-top landfill receptacles to the BigBelly Solar receptacles potentially revealed many individuals poor waste sorting practices. The overall percentage of both landfill and compostable material sorted correctly at Courtyard Café increased between the initial and secondary observational periods. This can likely be attributed to a variety of factors, the main one being the implementation of the newer and clearer signage. In addition to this, the removal of three of the four open-top landfill receptacles encouraged individuals to utilize the recycling and compost units of the BigBelly Solar receptacles. Lastly, the discontinuation of Yoshinoya s policy of automatically handing out plastic bags with every order is likely to have been a factor in the increases in both of these percentages. During the initial observational period, most individuals who ate from Yoshinoya then disposed of all of their materials as a single unit, within the plastic bag, into either the landfill or recycling bin. Thus, the plastic bags were discouraging individuals from actually sorting their waste. By eliminating the plastic bags, individuals were encouraged to sort their items. Disposal of PLA 7 Products As the data reflects, after the new sign implementation there was an increase in the overall waste diversion and sorting rates. However, there was still noticeable confusion around certain items, many of which were made out of PLA 7 plastic. The majority of noticeable confusion surrounded the plastic-like compostable products which were made out of PLA 7. The main materials involved in this confusion were the PLA 7 cups and PLA 7 containers, though there was additional confusion surrounding the PLA 7 utensils. Prior to the implementation of the new signage, PLA 7 cups and containers had a 25% correct sorting rate. It is important to note that during the initial observational period, the compost bin signage made no direct reference to PLA 7 materials. Thus, even those who did look at the bin signage still had difficulty sorting correctly, which reaffirmed the need for new signage to be developed. 15
16 The new compost signage explicitly included an image and description of the exact PLA 7 items utilized at the eateries with the hopes of increasing the correct sorting rates for these materials. Despite this significant change, the post-signage correct sorting rate for PLA 7 cups and containers only slightly increased by 6%, to an overall 31% correct sorting rate. This could be due to a combination of factors that have been identified. Firstly, it was noticed that many individuals disposed of their PLA 7 products without looking at either the material itself or at the bin signage. Specifically, many individuals disposed of their PLA 7 products into the recycling receptacle without looking at the material or signage. This could be due to the fact that (1) many individuals are still unfamiliar with knowing that PLA 7 is considered compostable at UCSB, (2) PLA 7 is a different material than other plastics, #1-7, (3) or the individuals were unaware that the materials in their hands were made of PLA 7. Because of its many plastic-like qualities, specifically in visual similarity, it is easy for PLA 7 to be mistaken as recyclable plastic. In the post-signage secondary observational period, PLA 7 cups and containers were disposed of into the recycling receptacle 44% of the time, into the landfill receptacle 25% of the time, and into the compost receptacle 31% of the time. Thus, the majority of PLA 7 cups and container were disposed of into the recycling receptacle, furthering the theory that most individuals incorrectly associate PLA 7 items with the recycling waste stream instead of with the compost waste stream. As was witnessed in this study, this association cannot be altered solely by creating newer signage. Additional strategies such as outside education, easier identifiable compostable products, and uniformity among compostable products are likely to be needed in order to effectively aid individuals in correctly sorting PLA 7 products. The overall increase in the total percentage of material sorted correctly shows that the implementation of new signage had a positive influence in aiding individuals to correctly sort their waste. However, the decrease in recycling sorting rates at each of the eateries, combined with the fact that there is still much room for the overall total percentage of material sorted correctly to increase, indicates that the implementation of new signage by itself is not enough to create the significant change needed to aid the UCSB campus in reaching its waste management goals. Additional factors such as outside education, easier identifiable compostable and recyclable products, and uniformity among all products on campus are needed in order to aid individuals in correctly sorting their waste. Additional s It is important to mention that when an individual placed their item into the correct receptacle, it may not be directly attributed to the individual s knowledge of where the materials should be correctly placed. It cannot be assumed that there was a direct correlation between individuals intentions and their actions when placing materials into the receptacles. While some individuals may have intentionally and knowingly placed their items into the correct receptacle, others may have gotten lucky with their decision. Regardless of whether or not one item was correctly sorted, this is not representative of an individual s comprehensive knowledge of correct waste sorting 16
17 practices. For example, one individual who placed a compostable bowl into the compost receptacle, then placed a Ziploc bag into the receptacle as well, thus suggesting that the individual s correct placement of the compostable bowl perhaps was more due to chance than to substantial knowledge. In addition, it was also noted that most individuals who took the time to look at the bin signage often only looked at those signs which correlated with the bin that they were already heading towards, or ended up using. For example, an individual with a PLA 7 cup may immediately head to the recycling bin and glance at the recycling bin signage, yet fail to look at either the landfill or compost signs to get an overall understanding of where the item should be placed. As noted, it is difficult to get individuals to actually read all of the signs. If individuals took the time to read the signs from top to bottom, it is projected that there would be close to a 100% sorting rate. Thus, additional educational components and strategies can be introduced in order to increase individual s sorting rates. FUTURE RESEARCH In addition to the sorting rate data, there were several other components of the research that could be expanded upon in future studies. As noted earlier, one major pattern that was observed was determining whether looking at the bin signage corresponded to the correct placement of the material in the individual s hand. While this study focused more on the placement of materials, further research should be conducted that specifically focuses on whether or not individuals look at the signage and if this then leads to correct sorting practices. This study would help determine if there is a direct correlation between the signage and the sorting rates. Another area for expansion would be in assessing the convenience factor of waste disposal. s revealed that individuals threw their trash away in the receptacle most convenient to where they were sitting, resulting in a higher use of the open trash cans due to their presence (APPENDIX VI). It was also noticed that individuals generally disposed of items into the bin that were in the direct path of where they were walking from, or where they were heading to. Many items disposed of in the open trash cans were actually compostable or recyclable. A study focusing on the convenience factor of personal waste disposal could yield valuable information on setting up an effective and efficient waste infrastructure. An additional observation that could be expanded is exploring the correct sorting rate of individuals when the dispose of their waste as a unit or when they dispose of each item separately. This would be important to understand because entities that distribute a variety of packaging, 17
18 which are recyclable, landfill, or compostable, may be making it more difficult for individuals to properly sort their waste. It would also be interesting to evaluate the influence on individuals when disposing of their waste when alone vs. in groups. Social pressures in a large group of individuals could influence the behavior of the rest of the group when it comes to waste disposal. ACKNOWLEDGMENTS There are a several organizations that made this research possible. UCSB s Facilities Management, along with Matthew O Carroll, the Refuse, Recycling & Water Efficiency Manager, provided the student researchers with staff support and guidance throughout the project, including invaluable feedback on the development of the new signage. UCSB s The Green Initiative Fund (TGIF), granted R 3 C with the funding for two student researcher positions for the year. The Associated Students Recycling Program (ASR) assisted the student researchers in the informal waste audit and worked with them to finalize the new signage. Lastly, UCen dining, the campus-run dining facilities approved and supported the installation of the new signage at the campus eateries. 18


 Open-top")
19 APPENDICES APPENDIX I BigBelly Solar Receptacles (recycling, landfill, and compost) Open-top Landfill Receptacle 19

20 Bertha Cluster 20
21 APPENDIX II Recording Sheet #1 Used to record: material type was in hand (recycling, landfill, compost, or miscellaneous), where the item was placed (recycling, landfill, compost), and specific material identification 21
22 Recording Sheet #2 Used to record detailed notes regarding: gender, group type/size, whether they looked at signage, whether they looked at the material in hand, student status, and noteworthy interactions with the receptacle 22


23 APPENDIX III Signage A Signage C 23

24 Signage A Signage C 24

25 Signage A Signage C 25

26 APPENDIX IV Additional Variables Applied Door Signage at Courtyard Café 26


27 Additional Variables Materials Signage Placed Underneath Various Products at Coral Tree Café 27

28 Additional Variables Applied Signage Placed at the Cash Registers at The Arbor 28
29 APPENDIX V When entering the data, we made sure to count an individual as 1 regardless of how many items they threw away. This enabled us to gather two different types of data: 1) the overall number of people that we observed, and 2) the overall number of materials that were disposed of. Pre-Signage Data Post-Signage Data Total People 638 Total People 661 Total Materials 1218 Total Materials 1221 Properly Sorted Material Properly Sorted Material Recycling 157 Recycling 148 Landfill 53 Landfill 72 Compost 378 Compost 490 Total: 588 Total: 710 % sorted correctly: 48% % sorted correctly: 58% Overall between the first phase and the second phase of our research, we observed a positive increase in the sorting rate from 48% to 58%, or a 10% increase. The following charts provide a specific look at the recycling, landfill, and compost sorting rates. The correct sorting rates are highlighted in blue: Pre-Signage Data: Post-Signage Data: Recycling Placed in: % Recycling Placed in: % Recycling % Recycling % Landfill 68 29% Landfill 86 33% Compost 12 5% Compost 23 9% Total: 237 Total: 257 Landfill Placed in: % Landfill Placed in: % Recycling 20 22% Recycling 17 17% Landfill 53 59% Landfill 72 71% Compost 17 19% Compost 13 13% Total: 90 Total: 102 Compost Placed in: % Compost Placed in: % Recycling % Recycling % Landfill % Landfill % Compost % Compost % Total: 856 Total:
30 The following charts provide a look at the general material make-up of the bins in terms of recycling, landfill, and compost: Pre-Signage Data: Post-Signage Data: Recycling Bin Make Up % Recycling % Landfill 20 6% Compost % Total: 314 Recycling Bin Make Up % Recycling % Landfill 17 6% Compost % Total: 287 Landfill Bin Make Up % Recycling 68 15% Landfill 53 11% Compost % Total: 462 Landfill Bin Make Up % Recycling 86 22% Landfill 72 18% Compost % Total: 397 Compost Bin Make Up % Recycling 12 9% Landfill 17 13% Compost % Total: 132 Compost Bin Make Up % Recycling 23 4% Landfill 13 2% Compost % Total: 526 The following charts represent the various sorting rates of certain stand-out items. The correct sorting rates are highlighted in blue: Recyclable Materials Sorting Rate Pre-Signage Data: Post-Signage Data: Paper % Paper % Recycling 13 87% Recycling 17 77% Landfill 1 7% Landfill 3 14% Compost 1 7% Compost 2 9% Total: 15 Total: 22 30
31 Saran Wrap % Saran Wrap % Recycling 2 14% Recycling 4 12% Landfill 12 86% Landfill 25 76% Compost 0 0% Compost 4 12% Total: 14 Total: 33 Plastic Bottles % Plastic Bottles % Recycling 43 91% Recycling 40 87% Landfill 4 9% Landfill 5 11% Compost 0 0% Compost 1 2% Total: 47 Total: 46 Sushi Container % Sushi Container % Recycling 2 22% Recycling 3 14% Landfill 4 44% Landfill 17 77% Compost 3 33% Compost 2 9% Total: 9 Total: 22 Landfill Materials Sorting Rate Pre-Signage Data: Post-Signage Data: Wrappers* % Wrappers* % Recycling 4 11% Recycling 7 20% Landfill 26 70% Landfill 28 80% Compost 7 19% Compost 0 0% Total: 37 Total: 35 Condiment Packet % Condiment Packet % Recycling 3 25% Recycling 3 19% Landfill 6 50% Landfill 11 69% Compost 3 25% Compost 2 13% Total: 12 Total: 16 Compostable Materials Sorting Rate Pre-Signage Data: Post-Signage Data: PLA 7 Cups % PLA 7 Cups % Recycling 23 39% Recycling 24 50% Landfill 24 41% Landfill 8 17% Compost 12 20% Compost 16 33% Total: 59 Total: 48 31
32 Compostable Plates % Compostable Plates % Recycling 4 5% Recycling 4 6% Landfill 33 40% Landfill 17 24% Compost 46 55% Compost 49 70% Total: 83 Total: 70 Compostable Utensils % Compostable Utensils % Recycling 20 19% Recycling 35 23% Landfill 36 34% Landfill 37 25% Compost 49 47% Compost 78 52% Total: 105 Total: 150 Napkins % Napkins % Recycling 26 13% Recycling 14 10% Landfill 79 40% Landfill 41 30% Compost 92 47% Compost 80 59% Total: 197 Total: 135 PLA 7 Containers % PLA 7 containers % Recycling 7 23% Recycling 14 36% Landfill 13 43% Landfill 14 36% Compost 10 33% Compost 11 28% Total: 30 Total: 39 Compostable Bowl % Compostable Bowl % Recycling 8 13% Recycling 2 3% Landfill 18 28% Landfill 24 30% Compost 38 59% Compost 54 68% Total: 64 Total: 80 Food scraps % Food Scraps % Recycling 0 0% Recycling 3 4% Landfill 24 31% Landfill 14 19% Compost 53 69% Compost 55 76% Total: 77 Total: 72 32
33 PLA 7 Cups and Containers % PLA 7 Cups and Containers % Recycling 30 34% Recycling 38 44% Landfill 37 42% Landfill 22 25% Compost 22 25% Compost 27 31% Total: 89 Total: 87 Yoshinoya Clamshell** % Yoshinoya Clamshell** % Recycling 1 8% Recycling 4 9% Landfill 4 33% Landfill 15 33% Compost 7 58% Compost 26 58% Total: 12 Total: 45 Compostable Coffee Cup % Compostable Coffee Cup % Recycling 11 34% Recycling 7 23% Landfill 10 31% Landfill 8 27% Compost 11 34% Compost 15 50% Total: 32 Total: 30 *Wrappers: we used this heading to refer to food wrappers that belong in the landfill such as chip bags, granola bar wrappers, candy bar wrappers, etc. **Yoshinoya Clamshell: Yoshinoya is an eatery in the Courtyard Café that provided black compostable clamshells which differed from the campus-provided brown compostable clamshells 33
34 APPENDIX VI The Arbor, April 2, :45 am 12:30 pm 34
35 Coral Tree Café, October 18, :15 am 1 pm 35

36 Courtyard Café, October 25, :00 pm- 2:40 pm 36
DAVIS HONORS CHALLENGE. Office Template. Campus Composting Initiative
 DAVIS HONORS CHALLENGE Office Template Campus Composting Initiative 2009-2010 Antonina Shapovalova Danielle Sakaguchi Gillian Taylor Serene Musallam Stephanie Sin Composting is a novel method of waste
Zero Waste Pauley Final Report Spring 2014
 Zero Waste Pauley Final Report Spring 2014 Talia Young Katie Zeller Rachel Chung Kimberly Mak Peilun Sun Rich Mylin Associate Director, UCLA Recreation Event & Facility Operations Table of Contents Executive
Approved University Standards Indoor Bins and Signs for Recycling, Trash and Compost. Last updated by Joe Abraham on
 Approved University Standards Indoor Bins and Signs for Recycling, Trash and Compost Last updated by Joe Abraham on 8-1-17 Introduction This document presents proposed standards for indoor recycle, compost
Waste Audit : Executive Summary
 Waste Audit : Executive Summary Students Sort Trash and Recyclables During Earth Week 2013 Office of Sustainability 1 Compiled by: Jennifer Maxwell Published: Spring 2014 Introduction Consistent with the
February Prepared by the Product Stewardship Institute, Inc. (PSI) with funding from the U.S. Environmental Protection Agency (EPA) Region 9
 with funding from the U.S. Environmental Protection Agency (EPA) Region 9") February 2015 Prepared by the Product Stewardship Institute, Inc. (PSI) with funding from the U.S. Environmental Protection Agency (EPA) Region 9 2 Marine Debris & Plastic Source Reduction Toolkit for
February 2015 Prepared by the Product Stewardship Institute, Inc. (PSI) with funding from the U.S. Environmental Protection Agency (EPA) Region 9 2 Marine Debris & Plastic Source Reduction Toolkit for
Google Bay Area Waste Case Study
 White Paper Published September 206 Authors Richard Navarro Emma Richardson Table of Contents Challenge Action Results Future Action 4 5 Google Bay Area Waste Case Study Challenge At Google, operating
Volume to Weight Conversion Ratios for Commercial Office Waste in New York City
 Volume to Weight Conversion Ratios for Commercial Office Waste in New York City Authors: Amy Marpman, Matthew Shurtleff, Ross Guberman, Richard Fuller Date: January 2013 Abstract This paper establishes
A GUIDE TO WORKPLACE COMPOSTING
 A GUIDE TO WORKPLACE COMPOSTING CONTENTS INTRODUCTION.... 3 START UP CHECK LIST: THE 6 C S.... 5 PLANNING A COMPOSTING PROGRAM AT THE WORKPLACE.... 6 Step One: Confirm Availability of Organics Collection....
Current practices to recycle, reuse, reduce waste, & conserve energy
 Current practices to recycle, reuse, reduce waste, & conserve energy Major initiatives with greatest impact Utilize Indiana-based company to purchase locally sourced produce. Goal is 20% of all produce
College Solid Waste Reduction and Recycling Policy
 Page 1 of 1 College Solid Waste Reduction and Recycling Policy Introduction The State University of New York College of Environmental Science and Forestry (SUNY-ESF) is committed to reducing its impact
Coordinating Composting & Zero Waste Events in the Dana Building
 Coordinating Composting & Zero Waste Events in the Dana Building Dana now strongly encourages composting at all food events held in the building. The material below describes how to incorporate composting
Sustainable NREL. Waste Management and Pollution Prevention. Ellen Fortier. September 18, 2013
 Sustainable NREL Waste Management and Pollution Prevention Ellen Fortier September 18, 2013 NREL is a national laboratory of the U.S. Department of Energy, Office of Energy Efficiency and Renewable Energy,
L E V E L L E V E L L E V E L L E V E L
 QUSTION: What is the recycle symbol? QUSTION: Name something that can be recycled that starts with the letter P. QUSTION: What does reusable mean? What is reusable in your lunch? QUSTION: Where does our
Current practices to recycle, reuse, reduce waste, & conserve energy
 Current practices to recycle, reuse, reduce waste, & conserve energy Dining is committed to being a key partner in the university s sustainability goals, including becoming a carbon-neutral campus by the
Chapter 5: Waste Management at Main Campus Dining Services
 Chapter 5: Waste Management at Main Campus Dining Services 5.1 Introduction The average college student produces 640 pounds of solid waste each year, including 500 disposable cups (Boston College, 2013).
Green Bin Audit Report Understanding contamination in curbside organics collection
 Green Bin Audit Report 2015 Understanding contamination in curbside organics collection Contents Executive Summary... 3 Audit 2015... 4 Background... 4 How Organic Waste is collected... 4 Education...
Augsburg College Minneapolis, Minnesota Organics Collection
 Augsburg College Minneapolis, Minnesota Organics Collection SCHOOL Augsburg College is a private four-year liberal arts college located in Minneapolis, Minnesota. There are approximately 4,054 students
WASTE AUDIT AND INVENTORY
 California State University East Bay WASTE AUDIT AND INVENTORY FINAL REPORT Prepared by Cascadia Consulting Group, Inc. December 17, 2015 EXECUTIVE SUMMARY California State University East Bay (CSU EB)
Think Global, Act Local Project WASTE - UVA Dining West Range Café
 Think Global, Act Local Project WASTE - UVA Dining West Range Café Mandy McKinney, Zach Herrman, Nancy Cronauer, Claire Jarrell, Arian Rubin 5/4/13 Global Sustainability ARCH 2150 West Range Café 1 Table
DAVIS HONORS CHALLENGE. Retail Template. Campus Composting Initiative
 DAVIS HONORS CHALLENGE Retail Template Campus Composting Initiative 2009-2010 Antonina Shapovalova Danielle Sakaguchi Gillian Taylor Serene Musallam Stephanie Sin Composting is a novel method of waste
CONDUCTING A WASTE AUDIT AT CONCORDIA
 CONDUCTING A WASTE AUDIT AT CONCORDIA Drafted by: Faisal Shennib, Environmental Coordinator Environmental Health and Safety Last Edited: 2015-02-02 OVERVIEW Waste audits are a critical tool for assessing
PSU Urban Center Building
 PSU Urban Center Building Materials Assessment Prepared for Portland State University Eric T. Crum Moonrose Doherty Gretchen Sandau December 9, 2013 Director Materials Assessment Manager Materials Assessment
ART Recycling Final Report 2011
 ART Recycling Final Report 2011 A comprehensive report detailing the research, analysis and findings of the 2011 ART Recycling Team Recycling Action Research Team 2011 Leaders: Chelsea Williams Sheryl
For younger students the teacher, or SES can do the calculations for your audits.
 Waste Audit School Garbage Sort The purpose of this audit is to determine what is in your school waste, and to help you calculate greenhouse gas emission reductions from a campaign you run to reduce waste.
Garbage on the. Prepared by The UNF Environmental Center Annual Report Jacksonville, FL / October 2015
 Garbage 2015Green on the Prepared by The UNF Environmental Center Annual Report Jacksonville, FL / October 2015 What is Garbage on the Green? Garbage on the Green (GoG) is a wasteauditing program developed
A Philadelphia Guide to Zero Waste Events
 A Philadelphia Guide to Zero Waste Events Introduction In addition to requiring recycling at public events, the City of Philadelphia is committed to expanding food composting at events as part of a citywide
Taking Out the Trash: A Source Reduction Pilot Project Monitoring Results
 Taking Out the Trash: A Source Reduction Pilot Project 2010-2011 Monitoring Results Project Purpose To identify opportunities for reducing San Francisco Bay trash at the source Funding provided by: California
PROJECT 2: Promoting Sustainability at the New School DELIVERABLES: A Green Map, Sustainability Signage, Pitch Presentation
 DESIGN 4: VISUAL ORGANIZATION AND INFORMATION DESIGN Spring 2011 Mondays 6:00 pm - 8:40 pm Duration: January 24 - May 16, 2011 (No class Feb 21 or March 14) PUDM 2003 CRN 2760 Section G Location: 6 East
Toward Zero Waste FOOD SERVICES TOOLKIT. Whatcom County. A step-by-step guide for food related businesses
 Toward Zero Waste FOOD SERVICES TOOLKIT Whatcom County A step-by-step guide for food related businesses Gold Sponsor Silver Sponsors Page 2 Table of contents TOOLKIT Overview 3 Create a Plan 4 Track and
Resourceful Rubbish. Studies of Society Place and Space Features of places.
 Resourceful Rubbish Lesson aims How can you turn rubbish into a resource? Students will learn about recycling, separating rubbish and how we can use re-use items rather than put them in the waste bin!
Waste Audit Report 2010
 Waste Audit Report 2010 Submitted by Kisti Thomas April 21, 2010 EXECUTIVE SUMMARY The 2010 waste audit was conducted the third week of March at the University of Winnipeg. The annual audit serves to assess
GREEN EVENT RESOURCES TIPS AND TRICKS FOR EVERY OCCASION
 GREEN EVENT RESOURCES TIPS AND TRICKS FOR EVERY OCCASION WHY HOST A GREEN EVENT? In line with President Monaco s focus on making Tufts a more sustainable university, it is important that offices take steps
ZERO-WASTE FOOTBALL Project Precedents
 ZERO-WASTE FOOTBALL Project Precedents Global Sustainability, Fall 2011 Prof. Phoebe Crisman Workshop Leader: Tom Gibbons Team members: Zlata Gogoleva, Dylan Kidd, Tina Safaie, Julia Toro TABLE OF CONTENTS
Lesson 1: Managing Solid Waste Trash: It Lasts a Long Time!
 : Managing Solid Waste Trash: It Lasts a Long Time! At a Glance: Students complete a worksheet while participating in a class discussion on solid waste management in Tucson. Next, students work in small
Materials Management for Offices A Best Practices Guide to Waste Reduction and Recycling with an introduction to Zero Waste principles
 Materials Management for Offices A Best Practices Guide to Waste Reduction and Recycling with an introduction to Zero Waste principles A publication of the Nebraska Recycling Council 2017 Funded by the
The Efficacy of Bring- Your- Own- Cup
 The Efficacy of Bring- Your- Own- Cup Campaign on the CSUS campus By Jewel Martha Mauricio Envs: 190 Environmental Studies Department December 15, 2014 0 Abstract Recycling solid waste products can protect
Wes Westbrooks; Waste Logistics April 2014 GOING LANDFILL FREE; THE ULTIMATE JOURNEY
 Wes Westbrooks; Waste Logistics April 2014 GOING LANDFILL FREE; THE ULTIMATE JOURNEY WASTE TOPICS INTENT The intent of this presentation is to give just an overview of what BMW Manufacturing went through
Recycling & Solid Waste
 Recycling & Solid Waste APPA Institute Scottsdale, AZ 9/14/15 Ed von Bleichert University of Colorado Boulder Contributors: Jessica Bradley Meggan Foster Housekeeping In the right room? Welcome and Thank
Business Sector Source Separated Organics Contaminant Mitigation and Management: Source to Processor
 Business Sector Source Separated Organics Contaminant Mitigation and Management: Source to Processor Kentson Yan, Tamara Shulman, Janet Robins, Bob Spencer, Daryl McCartney, Jessie Kwasny, & Shannon Leblanc
Feasibility of Student-Run Composting At McElroy Dining Hall
 Feasibility of Student-Run Composting At McElroy Dining Hall Boston College, Chestnut Hill, MA GE 580, Environmental Studies Senior Seminar May 1, 2014 Lauren Audi, Peter Keating, Bryan Sterling, Hillary
About Being a Green Hospital
 About Being a Green Hospital Introduction The purpose of this paper is to outline and note important opportunities in becoming a green hospital. A green hospital can be defined as a hospital that is seeking
University of Michigan Ann Arbor Campus-Wide Compost Feasibility Study. USCC January 25, 2011 Nicole Chardoul, PE, Principal and C.O.O.
 University of Michigan Ann Arbor Campus-Wide Compost Feasibility Study USCC January 25, 2011 Nicole Chardoul, PE, Principal and C.O.O. OVERVIEW Project Objectives Background Data Collection and Analysis
Cape Breton District Health Authority. Solid Waste Management
 Cape Breton District Health Authority Solid Waste Management Cape Breton District Health Authority Includes the following hospitals within CBRM: Cape Breton Regional Hospital Northside General Hospital
San Francisco s Food Composting Program
 San Francisco s Food Composting Program Alexa Kielty Department of the Environment City and County of San Francisco alexa.kielty@sfgov.org Mid-Atlantic Organics Summit November 30, 2006 San Francisco Background
DAY 8 GREENEST F O O D W A S T E
 PROJECT GREEN CHALLENGE 2017 DAY 8 GREENEST F O O D W A S T E BENJAMIN WONG ROHAN REDDY BENJAMIN YAO ROBERT YU OUR FINDINGS 01 CURRENT LEFTOVER SITUATION 02 COMMUNITY FOOD DONATIONS Currently food is disposed
CBA Recycling & Waste Collection: (Waste Wise)
") Summary for August 2015-August 2016 CBA Green Team Annual Report Educating and involving students and faculty about sustainability and using Mammal Hall efficiently. In August 2011, the University of Nebraska
Summary for August 2015-August 2016 CBA Green Team Annual Report Educating and involving students and faculty about sustainability and using Mammal Hall efficiently. In August 2011, the University of Nebraska
EMERGING TRENDS IN VENDING
 EMERGING TRENDS IN VENDING Micro Markets Tusco Display Micro Markets and Vending Machines M odern vending machines have been around since the 1880 s. The first known reference goes back to ancient Greece.
Introducing Composting into UCLA On-Campus Housing. A Division of The Green Living Project
 Introducing Composting into UCLA On-Campus Housing A Division of The Green Living Project A project of the Education for Sustainable Living Program at UCLA And the UCLA Institute of the Environment Green
Barnard College 2016 Carbon Footprint Summary
 Barnard College 2016 Carbon Footprint Summary Fiscal Year 2015 (July 2014 June 2015) Climate change and environmental degradation represent one of the most severe challenges facing humanity today. Part
Dane County Facilities Management is Talking Trash in 2016
 Dane County Facilities Management is Talking Trash in 2016 Dane County Launches New and Improved Waste Reduction and Recycling Program in County Facilities Waste Reduction and Recycling Program Background
1. Background 2 2. Methodology Audit Analysis Mixed Recycling Audit Analysis General Waste. 5. Audit Analysis - Composting 11
 Contents 1. Background 2 2. Methodology 3 3. Audit Analysis Mixed Recycling 4 4. Audit Analysis General Waste 8 5. Audit Analysis - Composting 11 6. Audit Analysis Cardboard 11 7. Conclusion 12 8. Recycling
RECYCLING & TRASH REPORT FY 2015
 RECYCLING & TRASH REPORT FY 2015 EXECUTIVE SUMMARY In May 2010, Temple University adopted its Climate Action Plan, which addresses the role of recycling and waste minimization as part of its comprehensive
UMass Amherst Guide to Zero-Waste Events
 University of Massachusetts Amherst ScholarWorks@UMass Amherst Student Showcase Sustainable UMass 2017 UMass Amherst Guide to Zero-Waste Events Kevin J. Hollerbach University of Massachusetts Amherst,
Tribal Community-Based Social Marketing (CBSM) Recycling Toolkit
 Recycling Toolkit") Tribal Community-Based Social Marketing (CBSM) Recycling Toolkit This toolkit focuses on using the community-based social marketing (CBSM) process to promote recycling behavior, based on a CBSM Case Study
Tribal Community-Based Social Marketing (CBSM) Recycling Toolkit This toolkit focuses on using the community-based social marketing (CBSM) process to promote recycling behavior, based on a CBSM Case Study
Leadership in Sustainability
 Leadership in Sustainability Annual Report Table of Contents Section 1: Summary Page 1 Introduction & Overview Page 2, 3 Initiative Briefs Page 4 - Common Terms Section 2: Waste Initiative 50-50 in 2 Page
A LOOK INTO TRASH & RECYCLING SYSTEMS
 A LOOK INTO TRASH & RECYCLING SYSTEMS Presentation created by Jamie Garuti, Sustainability Intern, Tulane Office of Sustainability and Environmental Studies, 2015. The Problem The combination of a growing
CASE STUDY: NEVIS RANGE MOUNTAIN EXPERIENCE
 CASE STUDY: NEVIS RANGE MOUNTAIN EXPERIENCE Rationale Due to the landscape in which the Nevis Range is set, the resort has a long standing environmental commitment to protect its surroundings, and encourage
2. Avoid Printing Materials. 4. Promote Recycling & Composting
 1 Georgia Tech is committed to creating a sustainable campus. Everyone in the Tech community plays a role in achieving this goal. Between food, transportation, and communications events can be resource
Sustainability for Facilities and Waste Management. Nick Mannie
 Sustainability for Facilities and Waste Management Nick Mannie 2017 Facility Management for Waste Management Integrating sustainability within the operational environment 2 Definitions SUSTAINABILITY is
The Sustainability Fund Project Application
 The Sustainability Fund Project Application Background and Context: The NCSU Sustainability Fund Advisory Board announces the second annual request for proposals to advance sustainability on campus. This
2017 RecycleMania Case Study Competition
 2017 RecycleMania Case Study Competition Waste Minimization - Submission Template (Non-food waste focus) 1. Contact info Aimee Cooper Purdue University Intern for the Department of Master Planning & Sustainability
Recycling at Events A G U I D E T O R E D U C I N G W A S T E A T A N Y E V E N T E
 Recycling at Events A G U I D E TO R E D U C I N G WA S T E AT A N Y E V E N T E This guide provides you, the event organizer, a convenient way to successfully plan recycling programs and other green practices
Recycling Nation: America Recycles
 Recycling Nation: Printed on recycled material. newsobserver.com/nie America Recycles 2: RECYCLING, Month 200?, Sponsored by THE NEWS & OBSERVER The News and Observer Publishing Company created its recycling
Organics Recycling at Events
 Organics Recycling at Events About Anoka County Recycling & Resource Solutions Department Solid waste planning, policy and reporting to Minnesota Pollution Control Agency Programming for recycling, organics
Temporary Exterior Signs and Postings Policy
 Temporary Exterior Signs and Postings Policy May 24, 2011 PURPOSE The university recognizes that signs including posters, banners, flyers, notices, brochures, etc. are a means for communicating information
Saskatoon Green Event Guide
 Updated 2017 1 About this Guide: This guide is designed to help organizers of all sizes of event in Saskatoon create more environmentally sustainable events. Sustainable events are those which have a minimal
Roadmap to WRAP. A guide to help promote plastic film recycling for municipalities, states, community organizers, and business stakeholders.
 Roadmap to WRAP A guide to help promote plastic film recycling for municipalities, states, community organizers, and business stakeholders. OVERVIEW WHO WILL THIS GUIDE BENEFIT? Traditional community recycling
STUDY REVEALS LACK OF AWARENESS OF WASTE CHALLENGES FACING U.S. NATIONAL PARKS
 Michael McHale Subaru of America, Inc. 856-488-3326 mmchale@subaru.com Diane Anton Amy Hagovsky Subaru of America, Inc. National Parks Conservation Association 856-488-5093 202-454-3371 danton@subaru.com
Comparative Anylysis of Recyling Programs: A Case Study of Three Universities
 University of Nebraska - Lincoln DigitalCommons@University of Nebraska - Lincoln Environmental Studies Undergraduate Student Theses Environmental Studies Program Spring 2010 Comparative Anylysis of Recyling
Celebrating our STARS, Charting our Course. February 25, 2014
 Celebrating our STARS, Charting our Course February 25, 2014 Thank you to the many who have contributed to the success of this symposium: Office of the President Office of the Senior Vice President and
Part 2: Away-from-home Recycling
 Part 2: Away-from-home Recycling Table 2.1 Examples of Away-from-home (AfH) locations where beverage containers are consumed and discarded Category Public spaces Examples Parks, streets, transit stops,
WASTE REDUCTION & RECYCLING PROGRAMS IN THE BUSINESS SECTOR AND IMPLEMENTING SUSTAINABLE JANITORIAL SERVICES
 WASTE REDUCTION & RECYCLING PROGRAMS IN THE BUSINESS SECTOR AND IMPLEMENTING SUSTAINABLE JANITORIAL SERVICES SBM GLOBAL FOOTPRINT OUR EXPERIENCE 33 Years in Business OUR TEAM 7000 Skilled Associates OUR
Presented by: Amy Stooksbury DENSO Manufacturing Tennessee, Inc. 10/17/2016
 Presented by: Amy Stooksbury DENSO Manufacturing Tennessee, Inc. 10/17/2016 1 Introduction Our Recycling Program Past, Present & Future Conclusion Questions 2 Tier I Automotive Parts Supplier Headquarters
Household Container Recycling - High School Student Worksheet. Newspapers, Plastic Bottles, Glass Jars, Cardboard Boxes, etc.
 Name: Date: Part I: Introduction 1. List 4 household items that can be recycled. Newspas, Plastic Bottles, Glass Jars, Cardboard Boxes, etc. 2. What is Single Stream Recycling? A system where all types
Recycling & Solid Waste
 Recycling & Solid Waste APPA Institute New Orleans, LA 1/18/16 Ed von Bleichert University of Colorado Boulder Contributors: Jessica Bradley Meggan Foster Housekeeping In the right room? Welcome and Thank
SOLID WASTE PROMOTION AND EDUCATION UPDATE
 5 2007 SOLID WASTE PROMOTION AND EDUCATION UPDATE The Solid Waste Management Committee recommends the adoption of the recommendation contained in the following report, August 21, 2007, from the Director,
WASTE MANAGEMENT SPECIFICATION New Builds and Refurbishments
 WASTE MANAGEMENT SPECIFICATION New Builds and Refurbishments Contents Purpose...1 Scope...2 Definitions...2 Legal requirements...3 Part 1: Internal containers...3 Placement and capacity specification...3
Purdue University West Lafayette, Indiana Waste Reduction
 Purdue University West Lafayette, Indiana Waste Reduction SCHOOL Purdue University, 4-year public, land grant institution. Purdue includes an extended network of three regional campuses and main campus
Analysis of hospital carbon emission management - case study from Taiwan. Fan-Lun Chen Manager Green Energy & Environment Research Laboratories
 Analysis of hospital carbon emission management - case study from Taiwan Fan-Lun Chen Manager Green Energy & Environment Research Laboratories 1 Background Health Care Consumes Resources and Generates
Recycling in Apartment Complexes
 ENST698: ENVIRONMENTAL CAPSTONE FALL 2011 Recycling in Apartment Complexes Assessing Student Recycling Behavior and Response to Audience-Specific Displays Alanna Smith Alena Hall Arima Rose Claypool Hannah
ZERO WASTE ATHLETICS Training Manual
 ZERO WASTE ATHLETICS Training Manual Global Sustainability, Spring 2013 Prof. Phoebe Crisman Workshop Leader: Brianne Doak Team members: Kaitlyn Badlato, Elizabeth Brown, Christina Jones, Lauren Nguyen,
MULTI-FAMILY RECYCLING INCENTIVE PILOT PROGRAM FINAL REPORT
 SEPTEMBER 8, 2017 MULTI-FAMILY RECYCLING INCENTIVE PILOT PROGRAM FINAL REPORT PREPARED FOR: THE CITY OF ANN ARBOR 301 E. HURON ST. ANN ARBOR, MI 48104 ------- PREPARED BY: RECYCLE ANN ARBOR 2420 S. INDUSTRIAL
Communications Toolkit Recycle on the Go. All templates mentioned in this toolkit are available for download:
 Communications Toolkit Recycle on the Go All templates mentioned in this toolkit are available for download: www.zerowastescotland.org.uk/partners Contents Introduction 2 Communications 3 Messaging 8 Guidance
LABORATORY 8: WASTE AND RECYCLING AT PLU Due November 7 th or 9 th
 Conservation Fall 2011 Name: Lab Day (circle one): Monday Wednesday Purpose: LABORATORY 8: WASTE AND RECYCLING AT PLU Due November 7 th or 9 th Human civilization generates a large amount of waste. As
Loss of Space and Relocation of Library Collections. Natalie Palermo, LSU Law Center. Abstract
 Loss of Space and Relocation of Library Collections Natalie Palermo, LSU Law Center Abstract Space is at a premium on many college and university campuses. Libraries are often asked to vacate space for
A SAMPLE RECOVERED PAPER SPECIFICATION FOR NEWSPAPERS & MAGAZINES SUPPLY SPECIFICATION & PROCEDURES DOCUMENT. (Section 1. for Ex-works Supply Only)
") A SAMPLE RECOVERED PAPER SPECIFICATION FOR NEWSPAPERS & MAGAZINES SUPPLY SPECIFICATION & PROCEDURES DOCUMENT (Section 1. for Ex-works Supply Only) 1 CONTENTS: 1. MATERIAL. 1.1 Specification:. 1.2 Grades:
A SAMPLE RECOVERED PAPER SPECIFICATION FOR NEWSPAPERS & MAGAZINES SUPPLY SPECIFICATION & PROCEDURES DOCUMENT (Section 1. for Ex-works Supply Only) 1 CONTENTS: 1. MATERIAL. 1.1 Specification:. 1.2 Grades:
CITY OF SANTA ROSA CITY COUNCIL RESOLUTION APPROVING SOLID WASTE COLLECTION SERVICES AGREEMENT BETWEEN THE CITY OF SANTA ROSA AND RECOLOGY
 CITY OF SANTA ROSA CITY COUNCIL Agenda Item # 14.1 For Council Meeting of: August 29, 2017 TO: FROM: SUBJECT: MAYOR AND CITY COUNCIL GLORIA HURTADO, DEPUTY CITY MANAGER RESOLUTION APPROVING SOLID WASTE
L.7 INFORMATION TO BE INCLUDED IN THE ENVIRONMENTAL PREFERABILITY SUBMISSION
 U.S. DEPARTMENT OF INTERIOR - CUSTODIAL RFP PAPER TOWELS PROCUREMENT LANGUAGE *** This is a contract excerpt only. To view the entire contract please view the file listed after the heading, Entire Contract:.
NYC PUBLIC SCHOOL RECYCLING CHAMPIONS PROGRAM
 NYC PUBLIC SCHOOL RECYCLING CHAMPIONS PROGRAM WWW.GROWNYC.ORG/RECYCLINGCHAMPIONS P.S. 151 FACULTY RECYCLING WORKSHOP We Need Your Leadership! Faculty Recycling Workshop Agenda Support for NYC Schools Why
Business Plan Template (For a Start-up Business)
") Business Plan Template (For a Start-up Business) Your Business Name ABN Number Address Line 1 Address Line 2 City, State Postcode Telephone Fax E-Mail 1/15 Table of Contents Table of Contents... 2 Executive
Business Plan Template (For a Start-up Business) Your Business Name ABN Number Address Line 1 Address Line 2 City, State Postcode Telephone Fax E-Mail 1/15 Table of Contents Table of Contents... 2 Executive
DISCARDED RESOURCE AND MATERIAL MANAGEMENT POLICY
 DISCARDED RESOURCE AND MATERIAL MANAGEMENT POLICY College of the Atlantic Last Updated: February 28th, 2017; Approved: March 1, 2017 1. INTRODUCTION 2. AIM OF POLICY 3. PRINCIPLES AND DEFINITIONS 4. SCOPE
WASTE MANAGEMENT: Part 6
 Supplier Questions by Waste Type Category: WASTE MANAGEMENT: Part 6 These could be baseline requirements that the contractor must demonstrate that s/he will provide and/or require of subs, or (if you decide
When your organization begins to educate others about environmental issues,
 GREEN OFFICE RESOURCES Participants will learn: Tips for reducing waste in your day-to-day operations. How to set up a reuse system in your office and how to donate materials. Tips for starting or improving
SWANA RECYCLING TECHNICAL ASSISTANCE STUDY PROPOSED BRADFORD COUNTY FIBER PROCESSING FACILTITY
 SWANA RECYCLING TECHNICAL ASSISTANCE STUDY PROPOSED BRADFORD COUNTY FIBER PROCESSING FACILTITY Prepared for: NORTHERN TIER SOLID WASTE AUTHORITY WEST BURLINGTON TOWNSHIP, BRADFORD COUNTY, PENNSYLVANIA
THE EFFECT OF ORIENTATION ON MECHANICHAL PROPERTIES OF RECYCLED PET
 THE EFFECT OF ORIENTATION ON MECHANICHAL PROPERTIES OF RECYCLED PET Angela D. Hasenbalg, Western Washington University Abstract The use of plastic products is becoming more prevalent in society. Scrap
Falcon Heights Recycling Report. Greg & Willie Tennis Tennis Sanitation 2/14/2014
 2013 Falcon Heights Recycling Report Greg & Willie Tennis Tennis Sanitation 2/14/2014 Index of Recycling Report Letter of Purpose. Page 1 Recycling Data Summary.... Page 2 Recycling Data (Single Family)...
Future of Solid Waste Management
 Future of Solid Waste Management T E D S I E G L E R D S M E N V I R O N M E N T A L S E R V I C E S, I N C. W I N D S O R, V T ( 8 0 2 ) 6 7 4-2840 W W W. D S M E N V I R O N M E N T A L. C O M Caution
Slide 1. Welcome to the on-line training course for Waste Management!
 Slide 1 Welcome to the on-line training course for Waste Management! Slide 2 Course Information Course Title: Waste Management Non-Clinical Regulations/Standards: PA Department of Health, PA Department
FLORIDA INTERNATIONAL UNIVERSITY FMD / UNIVERSITY CUSTODIAL SERVICES
 FLORIDA INTERNATIONAL UNIVERSITY FMD / UNIVERSITY CUSTODIAL SERVICES RECYCLING PROGRAM OUTLINE: (Revised 03/04/2008) NOTE: THE FACILITIES MANAGEMENT DEPARTMENT S RECYCLING PROGRAM IS EXECUTED BY THE CUSTODIAL