Design of Experiments (DOE) Instructor: Thomas Oesterle
|
|
|
- Amice Walker
- 5 years ago
- Views:
Transcription
1 1 Design of Experiments (DOE) Instructor: Thomas Oesterle

2 2 Instructor Thomas Oesterle
3 3 Agenda Introduction Planning the Experiment Selecting a Design Matrix Analyzing the Data Modeling the Data and Optimizing Input Exercises
 for your application analyze data using Minitab identify significant")
4 4 Goals After this course you will be able to.. prepare for an experiment select a design (matrix) for your application analyze data using Minitab identify significant factors of your process judge the validity of your data use DOE tools to reduce variation
5 5 Course Guidelines Four 3-hour sessions Suggest 1 break per session (10 minutes) You are responsible for learning Introductory Course Focus on application Fun and an environment of learning Please participate in the quizzes, polls, and questions!
6 What is DOE and why should you use it? 6
7 7 Typical Challenges 90 s 2000 s Today
8 8 How to increase success rate Customer Focus According to PDMA the leading cause of product failure is not understanding the customer Establish effective NPD processes Quality Systems (ISO) Use of effective tools (Six Sigma) Data driven decision making Develop metrics to measure progress

9 9 What is DOE? DOE is an efficient procedure for planning and systematically executing experiments. Goal is to obtain knowledge on how the process inputs affect the process outputs. Input Process Output
10 10 Two Components of DOE Experimental Design Screening, characterization, optimization Analytical Procedure Statistical Significance Input Process Output
11 11 Use to establish capable processes Step 1: Mistake Proofing Systematically eliminate all process errors Step 2: Process Optimization Use Tools to Move process to hit a target Reduce variation
12 12 Best time to start with DOE tools? Early in the process to improve quality and reduce cost (Dr. Taguchi) to confirm important design inputs to produce robust designs
13 13 Principles of Good Experimentation Understand Variables 2 to 5 replicates to increase precision Process Replication Randomize Control Avoid false conclusions Change some variables while carefully controlling others
14 14 A Few Definitions Uncontrolled Co-Factors (Noise) Different Machine Different Raw Material Lot Controlled Factors (Input) Discrete Responses (Outputs) PROCESS Continuous Temperature, Humidity
15 15 Effectiveness of DOE Information on this page is based on instructor s interpretation of [1].
16 16 If used correctly, DOE allows you to learn the most with the fewest possible runs identify the factors you should focus on determine the effect of controlled factors learn about interactions between factors predict factor settings with lowest variation 50% improvement in efficiency and effectiveness
17 17 Obstacles to using DOE Perceived complexity of set-up and analysis No software to crunch numbers Corporate cultures Don t Need, I am a Technology Guru
18 18 Why not One-Factor-at-a-Time Even simple processes are very time consuming and expensive You will miss the optimum combination of factors You will miss interactions
19 19 Getting Payback from this Training 5/10 rule Hands-On Training Sessions Discuss with Peers/Monthly Reviews Numerous Applications
20 Engineering versus Experimentation The Steps of a DOE Prerequisites, Assumptions Proper Preparation is Key 20
21 21 Engineering vs. Experimental Design DOE in not a substitute for technical knowledge DOE incorporates current understanding Physics first
22 22 Example from Injection Molding Relative Viscosity versus Relative Shear Rate THICK High sensitivity to machine fill speed fluctuation VISCOSITY Crossover point Low sensitivity to machine fill speed fluctuation THIN SLOW FLOW RATE FAST
23 23 DOE Steps Plan Select Design Matrix Conduct Analyze Confirm Define Objective, Select Factors, Levels, Responses, Overall Strategy Screening or Modeling? Setup is automated by software Train Personnel, Be present (at least during first few experiments) Evaluate Measurement System Statistical Analysis, Graphs, Predict Responses Demonstrate that the prediction from transfer function is useful
24 24 Prerequisites and Assumptions Plan Select Design Matrix Conduct Understand process before you start a DOE. Is the process stable or does it drift? Is your measurement system capable of measuring the changes you hope to see? (Validate!) Analyze Confirm
25 25 Proper Planning is Key Plan Select Design Matrix Conduct Analyze Plan several smaller experiments instead of one large experiment (25% Rule) Define the Objective Determine factors (Check FMEA) Determine factor levels Determine Responses Are there more than one? Are all responses equally important? Confirm
26 26 Defining the Objective OBJECTIVE Manufacturing Troubleshooting Which option is best? Screening What are the important factors? Robust Design What factor settings make the product/process least sensitive to noise Modeling To predict process performance
27 27 Defining the Objective DOE Choices Types of Experiments Manufacturing Troubleshooting Which type of supplier/material is best? Reduce variation, adjust a target. Screening to Identify Key Factors Which factors affect mean and/or variation Factor Significance Reduce factors to between 2 and 5 to better manage
 Regression")
28 28 Defining the Objective DOE Choices Types of Experiments Characterization To study simple effects with up to 4 factors Surface Response Modeling To hit a target To minimize or maximize a response To reduce variation To make a process robust Seeking multiple goals (desirability function) Regression Modeling
29 29 Defining the Objective DOE Choices Types of Experiments Robust Design To find process or product settings that are least sensitive to noise (establish robust designs/processes)
30 30 Manufacturing Troubleshooting Factors Low High Mold Temp F Barrel Temp Low High Cure Time sec Inj. Velocity Hold Pressure psi
31 31 Manufacturing Troubleshooting Responses Type Appearance Discrete 1 to 5

32 32 Modeling Effects Plot Response Surface Plot

33 33 Factors and Responses Objective: Grill Hamburgers as fast as possible Controlled Factors Amount of Flame Meat Temperature Noise Factors Ambient Temperature Patty Thickness Responses Time to Grill PROCESS Constant Factors Distance from Flame
34 34 Four Types of Controlled Factors Scatter Plot Impacts average only R e s p o n s e (-) 2(+) A(A) Factors Scatter Plot Impacts variation only R e s p o n s e (-) 2(+) B(B) Factors
35 35 Four Types of Controlled Factors 60 Scatter Plot Impacts both 50 R e s p o n s e (-) 2(+) C Factors 20 Scatter Plot No impact R e s p o n s e (-) 2(+) D Factors
36 36 Example Factor A shifts the mean Factor B effects variance Run A B R1 R2 R3 R Mean Standard Deviation 50 Main Effects 5 Main Effects R E S P S R E S P (-) 1(+) A(A) -1(-) 1(+) B(B) Factors -1(-) 1(+) AB 0-1(-) 1(+) A(A) -1(-) 1(+) B(B) Factors -1(-) 1(+) AB
37 37 Selecting and Scaling Factors Team Approach to identify (input) factors Use engineering judgment to determine factors Cause and Effect Diagram Review FMEA Be bold but not foolish setting factor levels Rule of Thumb: 20% beyond specification limit Select levels such that process still works! Verify selected levels before starting experiment

38 38 Range of Interest and Level Selection L2 L1
39 39 Area suited for 2 levels Over the levels of 100 to 130 the linear approximation appears to be useful. How about 130 to 160?
40 40 Area where 3 levels are required Over the range of 130 to 160 a three-level design would provide a much better approximation than a two-level design
41 41 Sample Size Rule of Thumb: n>40 per experiment for variable data 2 to 5 replications Multiple category response, n>10 per run Attribute (Pass/Fail) n must be large, not recommended for DOE It is far more important to consider the breadth of conditions rather than number of replicates!

42 42 Minitab, Sample Sizes Minitab Option STAT -> Power and Sample Size -> General Factorial Design

43 43 Minitab, Sample Sizes Goal: Determine the number of samples we need to get a power of 80% (0.8) Challenge: We don t know S! Suggestion: Look at a ratio between minimum difference and standard deviation. In this example we look at 4 ratios (0.5, 1, 1.5 and 2) 1: Enter Levels for all factors 2: Try 2,3 and 4 replicates 3: Enter 1,2,3 and 4 4: Enter 2 Entries in 3) and 4) give you a ratio of 0.5, 1, 1.5 and 2 -> make judgment!
44 44 Minitab, Sample Sizes We choose to detect one standard deviation. If we run 24 samples -> 63.3% Power If we run 32 samples -> 77.5% Power Power = 1-β β=probability of rejecting hypothesis when it is false (i.e. correctly detecting the difference) 3 H 0 : Not Guilty (Hypothesis) H A : Guilty (Hypothesis) True Result Not Guilty Guilty Accept H 0 Reject H 0 Correct Decision (Confidence Level) Incorrect Decision Type I Error Producer's Risk Incorrect Decision Type II Error Consumer Risk Correct Decision (Power of Test)
45 45 Sample Size, Simple Equation Approximates 80% Power and a desired detection of 1 standard deviation Example: Specification: 800 +/- 18 mm S: 3 mm You want to detect a shift of 2 mm n = (32* 3 2 ) / 2 2 = 288 /4 = 72
46 Two-Level Designs 46
47 47 The Design Matrix Plan Select Design Matrix Conduct Two-Level Designs are most popular. Why? Ideal for screening Simple Economical Analyze Confirm
 Vertically Balanced if Sum of Coded factors = 0 Factor Factor Run Temp (A) Press (B) Run Temp (A) Press (B) 1 100 600 1-1 -1 2 150 600 2 1-1 3 100 900 3-1 1 4 150 900 4")
48 48 The simplest two-level design matrix Displays the levels of each factor for all the run combinations in the experiment For Analysis, factor values are coded (-1,1 or +,-) (Coefficients) Vertically Balanced if Sum of Coded factors = 0 Factor Factor Run Temp (A) Press (B) Run Temp (A) Press (B) = 0 = 0

49 49 Orthogonal Analysis Matrix Vertically balanced Horizontally balanced Coded Factor Interaction Run A B A * B = 0
50 50 Orthogonal Arrays Vertical Balance Horizontal Balance Run A B C Sum: Run A B C Run A B C
51 51 Orthogonal Arrays Run A B C AB AC BC ABC Sum: Correlation between variables is zero r = ( x x)( y y) /( n 1) S i i x S y
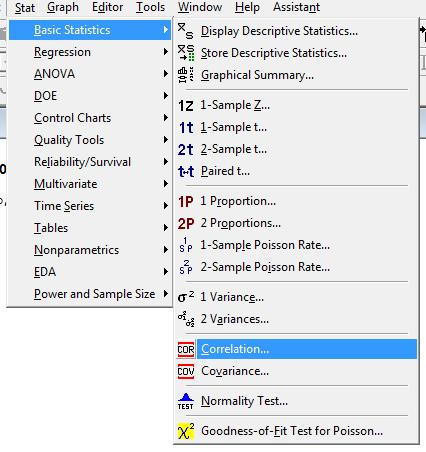
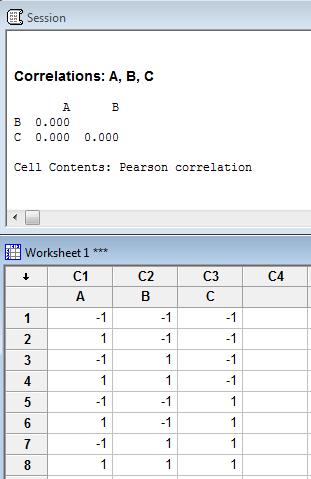
52 Correlation in Minitab 52
53 53 Orthogonal Analysis Matrix Horizontally balanced versus unbalanced Coded Factor Interaction Run A B A * B SUM Coded Factor Interaction Run A B A * B SUM 0 0 4

54 54 Example 1 Problem Statement An enzyme was processed and is stored in a buffered solution. The goal is to maintain the highest level of activity while in storage. Our process knowledge tells us that two ingredients of the buffered solution affect the activity: NaCl and EDTA. We want to know what happens if we vary the NaCl from 5% to 10% and the EDTA from 1% to 10%. Two samples were counted per run: Run NaCl A EDTA B Activity Y Activity Y2

55 55 Minitab Analysis (Main Effects) Is this a significant shift? We don t know yet.


56 56 Minitab Analysis (Interaction Plot) Lines Parallel: No Interaction Lines Intersect: Interaction Two factors interact if the influence of one factor is impacted by the level of another factor.


57 57 Comparative Surface Plots With Interaction No Interaction

58 58 Interactions Maximum height of projectile released from a trebuchet. W1=weight of rock Question: Is there an interaction between weight and release angle? The answer is no if we are considering release angles of greater than 150, yes if we are considering release angles less than 150.

59 59 Minitab Analysis (Pareto Chart) Red Line is Threshold. Anything beyond red line is significant

60 60 Minitab Analysis (Contour Plot) Question: Suppose your specification is A >= 32. Please provide a mixture of the NaCl and EDTA that would yield in activity levels greater than 32!
")
61 Minitab Analysis (Response Surface) 61

62 Minitab Tutorial 62
63 63 Minitab Analysis p <= > factor significant R-Sq: Sum of Sq. Residuals R.O.T.: > 80%
64 64 Model for this experiment Use coded numbers (-1,1) for A and B Three important assumptions Two levels Orthogonal Array Coded numbers Minitab use MLR to generate transfer function
65 65 Model Verification = * (1) + [ * (-1)] = 34
66 66 Last Step: Confirmation Run Run between 5 and 50 samples Sample size depends on ratio of standard deviation and desired detection interval Measure Results and Calculate Average Calculate Confidence Interval Does the average confirm the model?
67 67 Question Pareto Chart of the Effects (response is L, Alpha = 0.05) Main Effects Plot for L Data Means Term A B C AC AB F actor A B C Name Pressure Temp Time Mean A C B 290 ABC 3.0 BC Lenth's PSE = Effect A manufacturing associate asks for your help with interpreting these two charts. Which factor is significant? Please answer Poll on next page!
68 68 Question Contour Plot of L vs Temp, Pressure Hold Values Time Temp Pressure The manufacturing specification is 2.6 +/ What process settings would you recommend to make good parts? Please answer poll on next page!
69 69 Design Selection Guideline Number of Factors Screening Objective 2 4 Full Factorial Fractional Factorial > 5 Fractional Factorial Plackett-Burman Response Surface Objective Central Composite Box-Behnken Screen first to reduce number of factors
70 70 Full Factorial Designs A design with all possible high/low combinations of all the input factors is called a full factorial design in two levels. Run X1 X2 X
71 71 Full Factorial Designs If there are k factors each at 2 levels, this design has 2 k runs. Number of Factors Number of Runs


72 72 Example of Full Factorial (3 Factors) Injection Molding Challenge A part for the stage of a microscope is molded. Since the microscope allows precise positioning of samples, the process must produce a part with a length of ± mm.

73 73 Exercise Set up a Design Matrix in Minitab with 3 replicates Create Main Effects, Pareto, and Interaction Charts Identify significant factors Using a contour plot identify 2 factor settings that will result in a long part. The process technician established the following parameters and levels:
74 74 Measurement Results Run Mold Temp Inj. Time Hold Press L1 L2 L3 StDev
QUESTION 2 What conclusion is most correct about the Experimental Design shown here with the response in the far right column?
 QUESTION 1 When a Belt Poka-Yoke's a defect out of the process entirely then she should track the activity with a robust SPC system on the characteristic of interest in the defect as an early warning system.
INTRODUCTION. Introduction i
 Introduction i INTRODUCTION Experimental design techniques emerged in England during the 1920s. R.A. Fisher led initial applications in the fi eld of agriculture [1]. Other notable contributors to this
Test Design, Statistical Analyses in TEMPs, Test Plans, and DOT&E Reports
 Test Design, Statistical Analyses in TEMPs, Test Plans, and DOT&E Reports Introduction and Course Overview 5/20/2015-1 Welcome and Overview Administrative Details Introductions Test Planning Introduction
CHAPTER 5 OPTIMIZATION OF GREEN SAND CASTING PROCESS PARAMETERS USING TAGUCHI S METHOD
 66 CHAPTER 5 OPTIMIZATION OF GREEN SAND CASTING PROCESS PARAMETERS USING TAGUCHI S METHOD 5.1 PROCESS PARAMETERS OF GREEN SAND CASTINGS In this work, the robustness of the green sand casting process optimization
DESIGN OF EXPERIMENTS
 DESIGN OF EXPERIMENTS BOILING WATER 2014 Pavel Kopelev Johnny Alfonso INTRODUCTION Introduction Outline Who are we? About our program B.Tech About our course Boiling Water DOE 2 JOHNNY ALFONSO 4 th Year
Business Quantitative Analysis [QU1] Examination Blueprint
![Business Quantitative Analysis [QU1] Examination Blueprint](/thumbs/94/121308410.jpg "Business Quantitative Analysis [QU1] Examination Blueprint") Business Quantitative Analysis [QU1] Examination Blueprint 2014-2015 Purpose The Business Quantitative Analysis [QU1] examination has been constructed using an examination blueprint. The blueprint, also
Business Quantitative Analysis [QU1] Examination Blueprint 2014-2015 Purpose The Business Quantitative Analysis [QU1] examination has been constructed using an examination blueprint. The blueprint, also
Desirability Function Example
 Desirability Function Example Desirability Functions Trade-off problems between various responses can be solved by using desirability functions. Desirability functions are a mathematical means of conducting
Continuous Improvement Toolkit
 Continuous Improvement Toolkit Regression (Introduction) Managing Risk PDPC Pros and Cons Importance-Urgency Mapping RACI Matrix Stakeholders Analysis FMEA RAID Logs Break-even Analysis Cost -Benefit Analysis
Experimental Design Day 2
 Experimental Design Day 2 Experiment Graphics Exploratory Data Analysis Final analytic approach Experiments with a Single Factor Example: Determine the effects of temperature on process yields Case I:
FUNDAMENTALS OF QUALITY CONTROL AND IMPROVEMENT. Fourth Edition. AMITAVA MITRA Auburn University College of Business Auburn, Alabama.
 FUNDAMENTALS OF QUALITY CONTROL AND IMPROVEMENT Fourth Edition AMITAVA MITRA Auburn University College of Business Auburn, Alabama WlLEY CONTENTS PREFACE ABOUT THE COMPANION WEBSITE PART I PHILOSOPHY AND
= = Intro to Statistics for the Social Sciences. Name: Lab Session: Spring, 2015, Dr. Suzanne Delaney
 Name: Intro to Statistics for the Social Sciences Lab Session: Spring, 2015, Dr. Suzanne Delaney CID Number: _ Homework #22 You have been hired as a statistical consultant by Donald who is a used car dealer
FUNDAMENTALS OF QUALITY CONTROL AND IMPROVEMENT
 FUNDAMENTALS OF QUALITY CONTROL AND IMPROVEMENT Third Edition AMITAVA MITRA Auburn University College of Business Auburn, Alabama WILEY A JOHN WILEY & SONS, INC., PUBLICATION PREFACE xix PARTI PHILOSOPHY
EXPERIMENTAL INVESTIGATIONS ON FRICTION WELDING PROCESS FOR DISSIMILAR MATERIALS USING DESIGN OF EXPERIMENTS
 137 Chapter 6 EXPERIMENTAL INVESTIGATIONS ON FRICTION WELDING PROCESS FOR DISSIMILAR MATERIALS USING DESIGN OF EXPERIMENTS 6.1 INTRODUCTION In the present section of research, three important aspects are
Overview of Statistics used in QbD Throughout the Product Lifecycle
 Overview of Statistics used in QbD Throughout the Product Lifecycle August 2014 The Windshire Group, LLC Comprehensive CMC Consulting Presentation format and purpose Method name What it is used for and/or
STAT 2300: Unit 1 Learning Objectives Spring 2019
 STAT 2300: Unit 1 Learning Objectives Spring 2019 Unit tests are written to evaluate student comprehension, acquisition, and synthesis of these skills. The problems listed as Assigned MyStatLab Problems
Response Surface Methods for Peak Process Performance
 1 Response Surface Methods for Peak Process Performance Mark J. Anderson Stat-Ease, Inc. Executive summary This is the third article of a series on design of experiments (DOE). The first publication provided
Distinguish between different types of numerical data and different data collection processes.
 Level: Diploma in Business Learning Outcomes 1.1 1.3 Distinguish between different types of numerical data and different data collection processes. Introduce the course by defining statistics and explaining
= = Name: Lab Session: CID Number: The database can be found on our class website: Donald s used car data
 Intro to Statistics for the Social Sciences Fall, 2017, Dr. Suzanne Delaney Extra Credit Assignment Instructions: You have been hired as a statistical consultant by Donald who is a used car dealer to help
Learn What s New. Statistical Software
 Statistical Software Learn What s New Upgrade now to access new and improved statistical features and other enhancements that make it even easier to analyze your data. The Assistant Let Minitab s Assistant
Continuous Improvement Toolkit
 Continuous Improvement Toolkit Measurement System Analysis (MSA) Managing Risk PDPC Pros and Cons Importance-Urgency Mapping RACI Matrix Stakeholders Analysis FMEA RAID Logs Break-even Analysis Cost -Benefit
Measurement Systems Analysis
 Measurement Systems Analysis Components and Acceptance Criteria Rev: 11/06/2012 Purpose To understand key concepts of measurement systems analysis To understand potential sources of measurement error and
Design of Experiments Approach for Improving Wire Bonding Quality
 Design of Experiments Approach for Improving Wire Quality Worlaluck Satianrangsarith and Mongkol Tirakanogsathit Abstract This study concerned with the use Experimental Design to analyze the quality problem
Investigation of the Mechanical Properties of Bagasse Fiber-Reinforced Epoxy Composite using Taguchi and Response Surface Methodology
 Investigation of the Mechanical Properties of Bagasse Fiber-Reinforced Epoxy Composite using Taguchi and Response Surface Methodology Kanthavel Karuppusamy, a, * Palanisamy Ramanaicker, b and Vivek Somasundaram
Continuous Improvement Toolkit
 Continuous Improvement Toolkit Confidence Intervals Managing Risk PDPC Pros and Cons Importance-Urgency Mapping RACI Matrix Stakeholders Analysis FMEA RAID Logs Break-even Analysis Cost -Benefit Analysis
Continuous Improvement Toolkit
 Continuous Improvement Toolkit ANOVA Managing Risk PDPC Pros and Cons Importance-Urgency Mapping RACI Matrix Stakeholders Analysis FMEA RAID Logs Break-even Analysis Cost -Benefit Analysis PEST PERT/CPM
Marius Pop-Calimanu, Traian Fleser. Politehnica University of Timisora, Faculty of Mechanics, Bv. Mihai Viteazu no. 1,
 THE INCREASING OF WELD STRENGTH BY PARAMETERS OPTIMIZATION OF ULTRASONIC WELDING FOR COMPOSITE MATERIAL BASED ON ALUMINIUM USING DESIGN OF EXPERIMENTS. Abstract Marius Pop-Calimanu, Traian Fleser Politehnica
Correlation and Simple. Linear Regression. Scenario. Defining Correlation
 Linear Regression Scenario Let s imagine that we work in a real estate business and we re attempting to understand whether there s any association between the square footage of a house and it s final selling
Product and Process Improvement Through The Use of Taguchi Method (TM)
") Product and Process Improvement Through The Use of Taguchi Method (TM) Presented By Jafri Mohd. Rohani Department of Manufacturing and Industrial Engineering, Faculty of Mechanical Engineering Universiti
Product and Process Improvement Through The Use of Taguchi Method (TM) Presented By Jafri Mohd. Rohani Department of Manufacturing and Industrial Engineering, Faculty of Mechanical Engineering Universiti
Instructor Info: Dave Tucker, LSSMBB ProModel Senior Consultant Office:
 Instructor Info: Dave Tucker, LSSMBB ProModel Senior Consultant Office: 321.567.5642 dtucker@promodel.com 1 Understand how simulation models can be utilized within the DMAIC approach Examine a completed
Process Characterization Essentials Part I: Process
 Process Characterization Essentials Part I: Process Understanding and Health Authorities Guidance Thomas A. Little Ph.D. 2/16/2017 President, Thomas A. Little Consulting, Bioassay Sciences 12401 N Wildflower
Design of Experiments
 Design of Experiments Statistical Principles of Research Design and Analysis Second Edition Robert O. Kuehl The University of Arizona Duxbury Thomson Learning* Pacific Grove Albany Belmont Bonn Boston
Introduction to Control Charts
 Introduction to Control Charts Highlights Control charts can help you prevent defects before they happen. The control chart tells you how the process is behaving over time. It's the process talking to
CERTIFIED QUALITY PROCESS ANALYST BODY OF KNOWLEDGE
 CERTIFIED QUALITY PROCESS ANALYST BODY OF KNOWLEDGE Included in this body of knowledge (BOK) are explanations (subtext) and cognitive levels for each topic or subtopic in the test. These details will be
Lecture 10. Outline. 1-1 Introduction. 1-1 Introduction. 1-1 Introduction. Introduction to Statistics
 Outline Lecture 10 Introduction to 1-1 Introduction 1-2 Descriptive and Inferential 1-3 Variables and Types of Data 1-4 Sampling Techniques 1- Observational and Experimental Studies 1-6 Computers and Calculators
INVESTIGATION ON WARPAGE AND SINK MARK FOR INJECTION MOULDED PARTS USING TAGUCHI METHOD
 INVESTIGATION ON WARPAGE AND SINK MARK FOR INJECTION MOULDED PARTS USING TAGUCHI METHOD Omar Ahmed Mohamed, Swinburne University of Technology, Melbourne, Australia Syed Hasan Masood, Swinburne University
MINIMIZATION OF CRACKS IN ALUMINUM ALLOY CASTING Shashidhar Channappa Honnihalli* 1, Dr. Vinayak N. Gaitonde 2
 ISSN 2277-2685 IJESR/October 2014/ Vol-4/Issue-10/598-602 Shashidhar Channappa Honnihalli et al./ International Journal of Engineering & Science Research MINIMIZATION OF CRACKS IN ALUMINUM ALLOY CASTING
EFFICACY OF ROBUST REGRESSION APPLIED TO FRACTIONAL FACTORIAL TREATMENT STRUCTURES MICHAEL MCCANTS
 EFFICACY OF ROBUST REGRESSION APPLIED TO FRACTIONAL FACTORIAL TREATMENT STRUCTURES by MICHAEL MCCANTS B.A., WINONA STATE UNIVERSITY, 2007 B.S., WINONA STATE UNIVERSITY, 2008 A THESIS submitted in partial
Four Innovative Methods to Evaluate Attribute Measurement Systems
 Four Innovative Methods to Evaluate Attribute Measurement Systems Thomas Rust Reliability Engineer/Trainer Sept. 206 Saving More Lives Autoliv Global Footprint Japan RoA 0% Europe 7% 3% China 7% Sales
Chapter 4: Foundations for inference. OpenIntro Statistics, 2nd Edition
 Chapter 4: Foundations for inference OpenIntro Statistics, 2nd Edition Variability in estimates 1 Variability in estimates Application exercise Sampling distributions - via CLT 2 Confidence intervals 3
Cork Regional Technical College
 Cork Regional Technical College Bachelor of Engineering in Chemical and Process Engineering - Stage 4 Summer 1996 CE 4.8 - DECISION ANALYSIS AND OPERATIONS RESEARCH (Time: 3 Hours) Answer FOUR Questions.
PROCESS VALIDATION. A Systematic Approach 2015 WHITE PAPER WHITE PAPER PRODUCED BY MAETRICS
 WHITE PAPER PROCESS VALIDATION A Systematic Approach 2015 WHITE PAPER PRODUCED BY MAETRICS For more information, please contact: USA Office: +1 317 706 1493 UK Office: +44 115 921 6200 globalsales@maetrics.com
TO STUDY THE PROCESS PARAMETERS OF NIMONIC80A ON SURFACE ROUGHNESS IN DRY MACHINING: BY ANOVA APPROACH 1
 TO STUDY THE PROCESS PARAMETERS OF NIMONIC80A ON SURFACE ROUGHNESS IN DRY MACHINING: BY ANOVA APPROACH O. Archana M. V. R Durga Prasad Research Scholar, Department of Mechanical Engineering, VNR Vignana
Address for Correspondence
 Research Paper OPTIMIZATION OF CRITICAL PROCESSING PARAMETERS FOR PLASTIC INJECTION MOLDING FOR ENHANCE PRODUCTIVITY AND REDUCED TIME FOR DEVELOPMENT 1 Sanjay N.Lahoti, 2 Prof.M.D.Nadar, 3 Swapnil S. Kulkarni
Data Analysis on the ABI PRISM 7700 Sequence Detection System: Setting Baselines and Thresholds. Overview. Data Analysis Tutorial
 Data Analysis on the ABI PRISM 7700 Sequence Detection System: Setting Baselines and Thresholds Overview In order for accuracy and precision to be optimal, the assay must be properly evaluated and a few
STATISTICAL TECHNIQUES. Data Analysis and Modelling
 STATISTICAL TECHNIQUES Data Analysis and Modelling DATA ANALYSIS & MODELLING Data collection and presentation Many of us probably some of the methods involved in collecting raw data. Once the data has
Untangling Correlated Predictors with Principle Components
 Untangling Correlated Predictors with Principle Components David R. Roberts, Marriott International, Potomac MD Introduction: Often when building a mathematical model, one can encounter predictor variables
Continuous Improvement Toolkit
 Continuous Improvement Toolkit Correlation Managing Risk PDPC Pros and Cons Importance-Urgency Mapping RACI Matrix Stakeholders Analysis FMEA RAID Logs Break-even Analysis Cost -Benefit Analysis PEST PERT/CPM
Jeff Sundermeyer Engineering Specialist Advanced Virtual Product Development Caterpillar Inc.
 Validation of Physics-Based Computer Simulations of Non-Stationary Random Processes via Hypothesis Testing in the Time Domain Jeff Sundermeyer Engineering Specialist Advanced Virtual Product Development
The combination of factors and their levels describe the battlespace conditions.
 Design of Experiments (DOE) is an acronym and a test technique increasingly being used in the T&E community. This will present a conceptual overview of what DOE is, how it compares to other testing techniques,
Quality Control Assessment in Genotyping Console
 Quality Control Assessment in Genotyping Console Introduction Prior to the release of Genotyping Console (GTC) 2.1, quality control (QC) assessment of the SNP Array 6.0 assay was performed using the Dynamic
Using Mapmaker/QTL for QTL mapping
 Using Mapmaker/QTL for QTL mapping M. Maheswaran Tamil Nadu Agriculture University, Coimbatore Mapmaker/QTL overview A number of methods have been developed to map genes controlling quantitatively measured
Practice Final Exam STCC204
 Practice Final Exam STCC24 The following are the types of questions you can expect on the final exam. There are 24 questions on this practice exam, so it should give you a good indication of the length
Continuous Improvement Toolkit. Graphical Analysis. Continuous Improvement Toolkit.
 Continuous Improvement Toolkit Graphical Analysis The Continuous Improvement Map Managing Risk FMEA Understanding Performance Check Sheets Data Collection PDPC RAID Log* Risk Assessment* Fault Tree Analysis
Using Excel s Analysis ToolPak Add-In
 Using Excel s Analysis ToolPak Add-In Bijay Lal Pradhan, PhD Introduction I have a strong opinions that we can perform different quantitative analysis, including statistical analysis, in Excel. It is powerful,
Model Building Process Part 2: Factor Assumptions
 Model Building Process Part 2: Factor Assumptions Authored by: Sarah Burke, PhD 17 July 2018 Revised 6 September 2018 The goal of the STAT COE is to assist in developing rigorous, defensible test strategies
Prioritizing and Optimizing Problem Loops Using a Loop Monitoring System
 Prioritizing and Optimizing Problem Loops Using a Loop Monitoring System John P. Gerry, P.E. ExperTune Inc. Hubertus, WI www.expertune.com Presented at ISA2002, Chicago, IL October, 2002 Copyright 2002
Continuous Improvement Toolkit
 Continuous Improvement Toolkit Sampling Sample Population Managing Risk PDPC Pros and Cons Importance-Urgency Mapping RACI Matrix Stakeholder Analysis FMEA RAID Logs Break-even Analysis Cost Benefit Analysis
Understanding and accounting for product
 Understanding and Modeling Product and Process Variation Variation understanding and modeling is a core component of modern drug development. Understanding and accounting for product and process variation
Optimization process parameter of submerged arc welding by using ANOVA method
 Optimization process parameter of submerged arc welding by using ANOVA method Mr. Chetan Kumar Bagde 1, Mr. Shridev Tamrakar 2, Mr. Lokesh singh 3 1,2,3 Department of Mechanical Engineering, GDRCET, Bhilai,.
SPSS Guide Page 1 of 13
 SPSS Guide Page 1 of 13 A Guide to SPSS for Public Affairs Students This is intended as a handy how-to guide for most of what you might want to do in SPSS. First, here is what a typical data set might
Chapter 10 Regression Analysis
 Chapter 10 Regression Analysis Goal: To become familiar with how to use Excel 2007/2010 for Correlation and Regression. Instructions: You will be using CORREL, FORECAST and Regression. CORREL and FORECAST
WM2012 Conference, February 26 March 1, 2012, Phoenix, Arizona, USA
 Application of Six Sigma and Design of Experiment for Cementation Recipe Development for Evaporator Concentrate for NPP Ling AO, Phase II (China) 12555 Henning Fehrmann, Process Engineer, Westinghouse
ROADMAP. Introduction to MARSSIM. The Goal of the Roadmap
 ROADMAP Introduction to MARSSIM The Multi-Agency Radiation Survey and Site Investigation Manual (MARSSIM) provides detailed guidance for planning, implementing, and evaluating environmental and facility
Semester 2, 2015/2016
 ECN 3202 APPLIED ECONOMETRICS 3. MULTIPLE REGRESSION B Mr. Sydney Armstrong Lecturer 1 The University of Guyana 1 Semester 2, 2015/2016 MODEL SPECIFICATION What happens if we omit a relevant variable?
A Walk-Through Taguchi Design of Experiment (DOE) Application
 Application") A Walk-Through Taguchi Design of Experiment (DOE) Application [Example: Plastic Injection Molding Process Study] NUTEK, INC. August 1, 2008 Authored by: Ranjit K Roy A Walk-Through Taguchi Design of Experiment
A Walk-Through Taguchi Design of Experiment (DOE) Application [Example: Plastic Injection Molding Process Study] NUTEK, INC. August 1, 2008 Authored by: Ranjit K Roy A Walk-Through Taguchi Design of Experiment
Model construction of earning money by taking photos
 IOP Conference Series: Materials Science and Engineering PAPER OPEN ACCESS Model construction of earning money by taking photos To cite this article: Jingmei Yang 2018 IOP Conf. Ser.: Mater. Sci. Eng.
CHAPTER 4 EXPERIMENTATION
 CHAPTER 4 EXPERIMENTATION The performance of the considered alternative refrigerant mixtures is experimentally studied in comparison with R134a and HC mixture (50%R290/50%R600a) in the visi cooler of conventional
PROJECT PROPOSAL: OPTIMIZATION OF A TUNGSTEN CVD PROCESS
 PROJECT PROPOSAL: OPTIMIZATION OF A TUNGSTEN CVD PROCESS Heather Brown and Brian Hesse IEE 572 December 5, 2000 The tungsten chemical vapor deposition (WCVD) process has been used in the semiconductor
Design of Experiments Helps Optimize Injection Molding of Conductive Compounds
 Design of Experiments Helps Optimize Injection Molding of Conductive Compounds Conductive compounds such as plastic resins with carbon nanotubes as an additive make it possible to combine static dissipation
Chapter 3. Table of Contents. Introduction. Empirical Methods for Demand Analysis
 Chapter 3 Empirical Methods for Demand Analysis Table of Contents 3.1 Elasticity 3.2 Regression Analysis 3.3 Properties & Significance of Coefficients 3.4 Regression Specification 3.5 Forecasting 3-2 Introduction
Understanding Process Variation Lean Six Sigma Green Belt Session #3 Handout
 Understanding Process Variation Lean Six Sigma Green Belt Session #3 Handout Purpose-Agenda-Limit (P-A-L) Page 1 Purpose Learning Objectives Understand why cycle time is a driver of customer satisfaction
Displaying Bivariate Numerical Data
 Price ($ 000's) OPIM 303, Managerial Statistics H Guy Williams, 2006 Displaying Bivariate Numerical Data 250.000 Price / Square Footage 200.000 150.000 100.000 50.000 - - 500 1,000 1,500 2,000 2,500 3,000
Supplemental Verification Methodology
 Supplemental Verification Methodology To: ALL FOREST PROJECT VERIFIERS Date: July 03, 2012 Re: Updated Guidance for Verification of sampled pools for Forest Projects Version 3.3 of the Forest Project Protocol
Principles of Operations Management: Concepts and Applications Topic Outline Principles of managing Operations (PMO)
") Principles of Operations Management: Concepts and Applications Topic Outline Principles of managing Operations (PMO) Session 1: Operations Management Foundations Define the science and practice of operations
Principles of Operations Management: Concepts and Applications Topic Outline Principles of managing Operations (PMO) Session 1: Operations Management Foundations Define the science and practice of operations
Statistical Techniques Useful for the Foundry Industry
 Statistical Techniques Useful for the Foundry Industry by Matthew E. Elam Matthew_Elam@tamu-commerce.edu Dept. of Industrial Engineering and Technology Texas A&M University-Commerce Robert G. Batson rbatson@eng.ua.edu
Regression Analysis I & II
 Data for this session is available in Data Regression I & II Regression Analysis I & II Quantitative Methods for Business Skander Esseghaier 1 In this session, you will learn: How to read and interpret
Project 2 - β-endorphin Levels as a Response to Stress: Statistical Power
 Score: Name: Due Wednesday, April 10th in class. β-endorphins are neurotransmitters whose activity has been linked to the reduction of pain in the body. Elite runners often report a runners high during
Lecture Notes on Statistical Quality Control
 STATISTICAL QUALITY CONTROL: The field of statistical quality control can be broadly defined as those statistical and engineering methods that are used in measuring, monitoring, controlling, and improving
MAS187/AEF258. University of Newcastle upon Tyne
 MAS187/AEF258 University of Newcastle upon Tyne 2005-6 Contents 1 Collecting and Presenting Data 5 1.1 Introduction...................................... 5 1.1.1 Examples...................................
AMERICAN SOCIETY FOR QUALITY CERTIFIED RELIABILITY ENGINEER (CRE) BODY OF KNOWLEDGE
 BODY OF KNOWLEDGE") AMERICAN SOCIETY FOR QUALITY CERTIFIED RELIABILITY ENGINEER (CRE) BODY OF KNOWLEDGE The topics in this Body of Knowledge include additional detail in the form of subtext explanations and the cognitive
AMERICAN SOCIETY FOR QUALITY CERTIFIED RELIABILITY ENGINEER (CRE) BODY OF KNOWLEDGE The topics in this Body of Knowledge include additional detail in the form of subtext explanations and the cognitive
Online Student Guide Types of Control Charts
 Online Student Guide Types of Control Charts OpusWorks 2016, All Rights Reserved 1 Table of Contents LEARNING OBJECTIVES... 4 INTRODUCTION... 4 DETECTION VS. PREVENTION... 5 CONTROL CHART UTILIZATION...
Welcome to the course, Evaluating the Measurement System. The Measurement System is all the elements that make up the use of a particular gage.
 Welcome to the course, Evaluating the Measurement System. The Measurement System is all the elements that make up the use of a particular gage. Parts, people, the environment, and the gage itself are all
Estoril Education Day
 Estoril Education Day -Experimental design in Proteomics October 23rd, 2010 Peter James Note Taking All the Powerpoint slides from the Talks are available for download from: http://www.immun.lth.se/education/
Analysis of Tensile Strength of Bamboo Reinforced Polyester Composite
 ANALELE UNIVERSITĂŢII EFTIMIE MURGU REŞIŢA ANUL XXIII, NR. 1, 2016, ISSN 1453-7397 Analysis of Tensile Strength of Bamboo Reinforced Polyester Composite Omholua Anthony Omokhudu, Ujam A.J., Uviesherhe
Chapter 5 Introduction to Statistical Quality Control, 7th Edition by Douglas C. Montgomery. Copyright (c) 2012 John Wiley & Sons, Inc.
 2012 John Wiley & Sons, Inc.") 1 Learning Objectives 2 Basic SPC Tools 3 5.2 Chance and Assignable Causes of Variation A process is operating with only chance causes of variation present is said to be in statistical control. A process
1 Learning Objectives 2 Basic SPC Tools 3 5.2 Chance and Assignable Causes of Variation A process is operating with only chance causes of variation present is said to be in statistical control. A process
Session 7. Introduction to important statistical techniques for competitiveness analysis example and interpretations
 ARTNeT Greater Mekong Sub-region (GMS) initiative Session 7 Introduction to important statistical techniques for competitiveness analysis example and interpretations ARTNeT Consultant Witada Anukoonwattaka,
Ten Requirements for Effective Process Control
 Published in ASQ Quality Progress and won the Paper of the Year Award in 2002. Ten Requirements for Effective Process Control Thomas A. Little Ph.D. Thomas A. Little Consulting 12401 N Wildflower Lane
Why do we need statistics to study genetics and evolution?
 Why do we need statistics to study genetics and evolution? 1. Mapping traits to the genome [Linkage maps (incl. QTLs), LOD] 2. Quantifying genetic basis of complex traits [Concordance, heritability] 3.
Why Learn Statistics?
 Why Learn Statistics? So you are able to make better sense of the ubiquitous use of numbers: Business memos Business research Technical reports Technical journals Newspaper articles Magazine articles Basic
Managerial Economics
 Managerial Economics Estimating Demand Functions Rudolf Winter-Ebmer Johannes Kepler University Linz Winter Term 2014 Winter-Ebmer, Managerial Economics: Unit 2 - Demand Estimation 1 / 21 Why do you need
Using POE with Tolerance Intervals to Define Design Space
 Using POE with Tolerance Intervals to Define Design Space Patrick J. Whitcomb (Speaker) Stat-Ease, Inc. pat@statease.com Mark J. Anderson, PE, CQE Stat-Ease, Inc. Minneapolis, MN USA Presented to: Chemometrics
IE 301 Industrial Engineering laboratory LAB No.5: The seven QC tools and Acceptance sampling Instructor: Assisant.Prof. Parichat Chuenwatanakul Lab
 IE 301 Industrial Engineering laboratory LAB No.5: The seven QC tools and Acceptance sampling Instructor: Assisant.Prof. Parichat Chuenwatanakul Lab objectives: To practice using the seven QC tools to
CHAPTER 5 RESULTS AND ANALYSIS
 CHAPTER 5 RESULTS AND ANALYSIS This chapter exhibits an extensive data analysis and the results of the statistical testing. Data analysis is done using factor analysis, regression analysis, reliability
Models in Engineering Glossary
 Models in Engineering Glossary Anchoring bias is the tendency to use an initial piece of information to make subsequent judgments. Once an anchor is set, there is a bias toward interpreting other information
Statistics: Data Analysis and Presentation. Fr Clinic II
 Statistics: Data Analysis and Presentation Fr Clinic II Overview Tables and Graphs Populations and Samples Mean, Median, and Standard Deviation Standard Error & 95% Confidence Interval (CI) Error Bars
ENGG1811: Data Analysis using Excel 1
 ENGG1811 Computing for Engineers Data Analysis using Excel (weeks 2 and 3) Data Analysis Histogram Descriptive Statistics Correlation Solving Equations Matrix Calculations Finding Optimum Solutions Financial
Statistical Analysis for Process and Product Development
 Statistical Analysis for Process and Product Development *** LIMITED TIME OFFER: FREE $100 AMAZON GIFT CARD! *** REGISTER TODAY! This course is designed to help scientists and engineers apply statistical
Getting Started with OptQuest
 Getting Started with OptQuest What OptQuest does Futura Apartments model example Portfolio Allocation model example Defining decision variables in Crystal Ball Running OptQuest Specifying decision variable
APICS PRINCIPLES OF OPERATIONS MANAGEMENT TOPIC OUTLINE CONCEPTS AND APPLICATIONS
 APICS PRINCIPLES OF OPERATIONS MANAGEMENT TOPIC OUTLINE CONCEPTS AND APPLICATIONS About this Topic Outline This outline details the concepts and applications coved in all five of the APICS Principles of