Spatial Patterns in Aquatic Plant Communities: Implications for Nutrient Cycling within a Constructed Wetland By: James Chang
|
|
|
- Lambert Reynolds
- 5 years ago
- Views:
Transcription


1 Spatial Patterns in Aquatic Plant Communities: Implications for Nutrient Cycling within a Constructed Wetland By: James Chang 2008 Kearney Undergraduate Fellowship Award

2 Ecological Services of Vegetation in Constructed Wetlands Aquatic macrophytes contribute to nutrient retention in wetlands directly and indirectly. Plants obtain nutrients from soils and the water column. The efficiency of this process depends on the plant s morphology and life style. Plants contribute organic matter to the soil, which fuels microbial processes such as denitrification. Organic residues can serve as long term phosphorus sinks in soils. Vegetation in wetlands promotes sedimentation. Plants provide shading that may lower algae productivity in the water column.


3 Hypothesis The ecological niches in a diverse plant community can maximize nutrient uptake in the wetland, because different growth strategies specialize to obtain nutrients through different pathways. For example, submerged macrophytes acquire more nutrients from the water column than from the soil as opposed to emergent macrophytes.


4 Goal Develop vegetation management strategies for constructed wetlands to maximize nutrient retention.


5 Objectives Assess the characteristics (list them here) of plant communities in a constructed wetland. Determine nutrient removal by plant communities through a wetland mass balance. Determine if heterogeneity and ecological niches in plant communities can contribute to nutrient retention.


6 Study Site The study site is a three-year-old constructed flow-through wetland adjacent to the San Joaquin River. It receives agricultural tailwater from about 420 ha of farmland before discharging into the San Joaquin River (O Geen et al. 2007).


7 Figure 1. Schematic showing site location, wetland morphology, and areas of submersion. The wetted surface area of the wetland depends on input and output water flow and ranged from 1.3 to 5.7 ha in 2007 (Figure 1 from Brauer, 2007).


8 Methods A vegetation map was constructed using a Trimble GPS. Digital polygons were plotted to represent vegetation locations and area cover. Above ground and below ground biomass samples were taken within a 0.25 m x 0.25 m quadrate to calculate peak standing biomass and analyze for nutrients. To avoid biased sampling, stratified random points were plotted on the polygons using the statistical program R. A ceptometer was also used to record leaf area index (LAI) as a method of nondestructive biomass sampling. All sampling and mapping was conducted during the peak of the growing season in mid-july.

9 Figure 2. Sampling locations. For each location with a destructive sampling point, the LAI was also recorded before hand. For each representative polygon, four above ground and eight below ground destructive samples were taken. Notice that there are more locations for LAI sampling points than destructive sampling points.


10 Common instruments used in the study

11 Above ground sampling for Typha


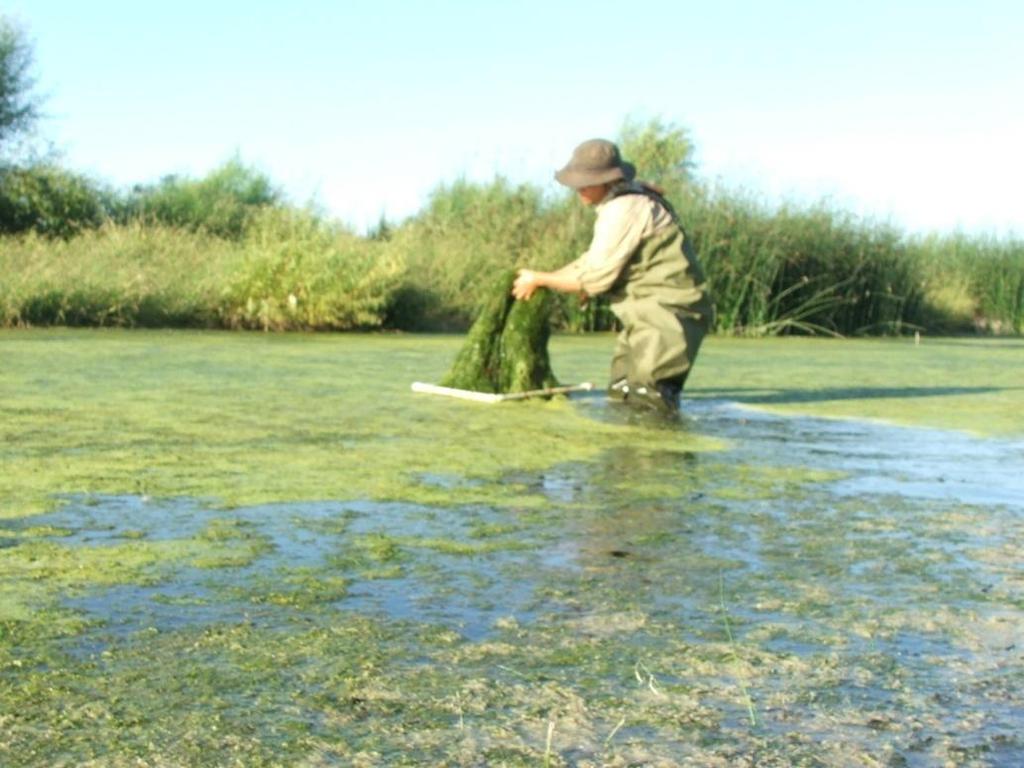
12 Two cores were collected within each quadrat. The goal of the core sampling is to collect roots and soils for nutrient analysis. In this picture, cores are taken for submerged macrophyte roots.

13 Plant Species of Interest For the purpose of this study, only aquatic macrophytes were accounted for. A diverse plant community dominated the wetland, which included aquatic macrophytes with all the different growth strategies: emergent, creeping, submerged, and floating. These species include: early watergrass (Echinochloa oryzoides) pale smartweed (Polygonum lapathifolium) knotgrass (Paspalum distichum) bulrush (Schoenoplectus californicus) cattail (Typha latifolia) duckweed (Lemna minor) spiral ditchgrass (Ruppia cirrhosa)


14 QuickTime and a decompressor are needed to see this picture. Early watergrass (Echinochloa oryzoides) Pale smartweed (Polygonum lapathifolium)


15 Spiral ditchgrass (Ruppia cirrhosa) Bulrush (Schoenoplectus californicus)

16 Figure 3. Dominant plant species distribution. Notice the low area of overall open water and the higher biodiversity in the central channel. If compared to Fig. 1, we can see that the presence of species may be controlled by hydrological conditions. Areas not of interest include upland vegetation and riparian trees.

17 Figure 4. Average biomass. Species differences account for the variation in in biomass. We may infer that differences of biomass within species may be attributed to several factors, such as competition with neighboring species.

18 Figure 5. Average LAI. LAI and biomass did not necessarily share a linear relationship. Different vegetation groups from the same species with no differences in mean LAI were assumed to have the same mean biomass.

19 Status and Progress Still need nutrient analysis for above ground (leaves and stems) and below ground (roots) samples. Still need nutrient analysis for soil samples. Once these procedures are complete, we can open more discussion about plant communities and the application of community ecology in nutrient retention. Benefits of ecological niches and interspecies competition in constructed wetlands.

20 Challenges Sampling scheme How to randomly sample using polygons and the statistical program R. The long and narrow polygons made traditional random sampling methods, such as tossing a quadrat behind my back, inappropriate. Time limitations The mapping and sampling had to be conducted within a month time span after the peak growth of vegetation began and before the irrigation season ends.

21 Future and Adjacent Research Trees Another interesting aspect to study are the riparian trees. There are a total of 20 mature riparian trees in the wetland that may contribute to long term storage of carbon and phosphorus. Phosphorus Determining the fate of phosphorus in this wetland has yet to be achieved. After the nutrient analysis of plant tissues, we can begin to understand the role of vegetation in nutrient cycling within constructed wetlands.

22 Future and Adjacent Research Pesticide Degradation and Retention The ability of wetlands to biodegrade pesticides is being studied in this wetland. The overall contribution of plant uptake in pesticide retention is yet to be determined. Percent Cover Data These data will be used to evaluate the effects of vegetation on algae productivity, as the emergent canopy intercepts solar radiation. Vegetation and Temperature Temperature probes were also placed in the wetland to measure water temperature. The influence of canopy cover on water temperature may also effect microbial activity.

23