- Operating hours. - Average kw/ton.
|
|
|
- Owen Boyd
- 5 years ago
- Views:
Transcription


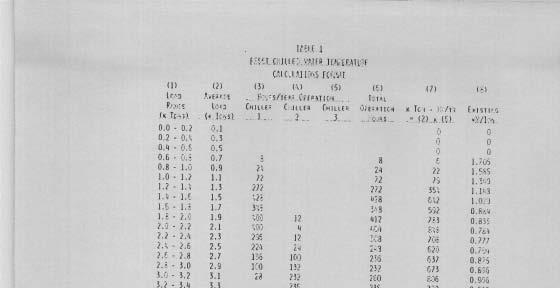
1 OPTIMIZATION OF CHILLED WATER SYSTEMS 8. N. Gidwani, P.E. Project Director Roy F. Weston, Inc. West Chester. Pennsylvania ABSTRACT Chilled water systems are one of the major energy consumers in industrial, commercial, and institutional complexes. The centralization of chilled water systems has considerable advantages, namely: simplified controls, the installed capacity is reduced due to diversity, consolidated maintenance and operation, etc. With central chilled water systems, the following areas present potential energy and cost savings: 0 e m a In Chilled Water Reset Condenser Water Reset Sequencing of the Chillers Chilled Water Storage Variable Chilled Water Pumping this paper the feasibility aspect of each of the above items will be discussed. -- CHILLED WATER RESET Chilled water systems are selected for fullload design conditions that are represented by a pre-determined water temperature to the coil and temperature rise across the coil. These conditions do not occur the majority of the time. During loads less than full-load conditions, a higher chilled water supply would meet the system requirements. The chiller efficiency can be increased by raising the return chilled water temperature. This is indicated in Figure 1. For each OF rise in chilled water supply temperature, there is an increase of 1 to 1.52 in coefficient of performance (COP). Even for the same temperature difference (10'~ between supply and return water) the power consumption is considerably less for a chiller with a range of 58OF to 48OF than for a chiller with a 54'~ to 44OF range. As indicated in Figure 1, the coefficient of perfotmance varies with the type of chiller. The screw type chiller has the greatest increase in COP while the absorption chiller has the least increase Using Return Water Temperature (Figure 3). This method is based on the assumption that lower return water temperature indicates a reduced cooling load. This is only true if the system is a constant flow type (i.e., using three-way control valves). A two-way control valve or variable flow system reduces its flow as the load drops; hence, return water temperature will not indicate actual load conditions. This return water temperature method of control is less desirable, since, even in a constant-flow system, certain areas may be at full load whereas others may be at very low load. Thus, increasing the supply water temperature based on average return water temperature will not satisfy the full-load areas. Through Outside Air Temperature By evaluating the enthalpy of outside air and enthalpy of design conditions, the chilled water supply temperature can be varied proportionally. Cost Savings Energy Saving (kwh/year). = Chiller Average Load (tons) x Operating Hours x Average kw/ton x Saving (%) per Degree Reset x Number of Degrees Reset Table 1 shows the method of calculating: - Chiller average load. - Operating hours. - Average kw/ton.


.")


2 ---- CONDENSER WATER RESET Cooling towers in the past have been designed to maintain a constant supply water temperature to the condenser (approximately 85OFf). The reasons were that chillers are easier to control with a condenser water temperature of around 85OFf and that a savings in fan horsepower results. Recent studies have indicated that modern chillers can tolerate a considerable variation of condenser water temperature. This temperature is established by the ambient wet bulb temperature plus wet bulb approach. Normally, approach varies between 5 to 10 F. Thus, as the ambient wet bulb temperature drops, the condenser water temperature can drop. An increase in efficiency of a centrifugal chiller can be approximately 1% per degree drop in condenser water temperature (Figure 4). This more than compensates for any additional fan horsepower required for continuous operation of the fans. METHOD OF IMPLEMENTATION (Figure 5). Condenser supply water temperature can be controlled through ambient wet bulb temperature plus the tower approach value. However, this method has a drawback due to difficulty in maintaining the accuracy of the wet bulb signal. This drawback can be eliminated by use of two outdoor sensors, namely, dry bulb and dew point, which can be combined to derive an outdoor wet bulb temperature. This temperature value can then be used to reset the condenser water temperature. RESET CONDENSER WATER TEMPERATURE Calculations Energy Savings. Where: = Average toad (tons) x x Operating ton Hours x Percent Power Reduction Percent Power Reduction = (Design Condenser Water Temperature - Average Condenser Water Temperature) x Percent Power Reduction Table 1 shows the method of calcu - Average load. - Operating hours. - Average kw/ton. Table 2 shows the method of calcu per Degree ating: ating: - Average condenser water temperature. SEQUENCING OF THE CHILLERS of their deslgn capacity. As loads increase or decrease in a central system, the number of chillers operated and (where possible) the size of chiller(s) used should he selected to maximize total chiller efficiency. This can be done manually, using a prescribed operating procedure for each load level, or through automatic controls. The system configuration plays an important role in establishing the economics of sequencing. For example, sequencing of chillers in series will be economically more feasible than chillers in parallel for the simple reason that no additional pumps have to operate for multiple chillers. Also, primary/secondary pumping systems are a good opportunity for sequencing since the primary pumps which are interlocked with the chillers are usually small in size. Figures 6 and 7 show the operation of three chillers of a chiller plant of an industrial complex and Table 3 shows method of calculating the savings. --- CHILLED WATER STORAGE A conv~!ntional chilled water system produces chilled water. as required, to meet the building load. In most parts of the country, a substantial penalty charge is levied on electricity consumed during daythe periods. The purpose in a chilled water storag:e system is to allow a surplus of chilled water to be produced and stored, during periods when no penalty clause is in effect, for use during on-peak periods. An important factor in determining the feasibility of a chilled water storage system is the building's cooling load profile. A profile with a marked difhrence between on-peak and off-peak loads is more appropriate for storage than a profile that is re1ative:ly level. The "peak/valleyl' type profile allows chi1:lers that are normally at low load or idle during the night to operate at near capacity and store surplus chilled water. The stored chilled water is then used during on-peak hours to minimize the load seen by the chillers. ANALY SI S The analysis oe chilled water storage must begin with th~: establishment of a building cooling load profile (Figure 8). Using the area under the curve during on-peak and off-peak hours and the maximum chiller capacity, possible storage operating modes can be established (Figures 9 and 10). The storage tank(s) will be sized to fit the proper operating mode. Storage tank configuration is another variable that is specific to each application. The number of storage tanks installed presents a trade-off: the more tanks, the smaller the gross capacity required and the better the separation between sup3ly and return water; with more tanks, however, the larger the surface area to volume ratio and the hig'ler the tank cost. COST SAVINGS Both centrifugal and absorption chillers operate most efficiently in the middle to upper range The potential cost savings from chilled water storage is 4 function of the local electric rate 84


3 structure. In order to calculate the potential savtn~s, the local electric contract must be thoroughly analyzed. The items of most significance are time of day consumption rates, time of day demand charges, and the demand ratchet clause. With a typical 12-month ratchet clause, a peak month reduction in on-peak demand can reduce as many as 12 monthly electric bills. Chilled water storage will affect on-peak demand by minimizing chiller requirements during on-peak hours. A sophisticated control system with demand limiting capabilities will be required with the system to monitor and maintain an acceptable demand level. Since any demand peak above the ascribed limit will increase the demand charge for the ensuing 12 months, the role of these controls is a crucial one. Another component a1 the electric rate schedule that can be exploited with a chilled water storage system is time of day consumption charges. In some areas of the country. a kilowatt-hour of electricity is more expensive during "on-peak1' hours than offpeak hours. This presents another potential savings from off-peak generation and chilled water storage. SUMMARY It is important to note that chilled water storage, which is a cost saving opportunity. must be completely analyzed for every application. Very few generalizations can be made regarding these systems. Too much depends on system size, type, load profile. and local electric rates to define any "rules of thumb." VARIABLE VOLUME PUMPING By controlling motor speed, only the required quantities of chilled water ere circulated. Thc required chilled water quantity is a function of the total head seen by the pump (Figure 11). Monitoring this pressure with a micro-processor based control system allows a speed control signal to be generated. Operating the pump at partial load, though somewhat less efficient than at full load, still provides a substantial energy savings over 100% full-load operation. CALCULATIONS Pump Energy Consumption: H E = Total Head (ft) = Flow (GPM) - Efficiency = Energy Consumed (kw) This equation represents pump energy consumed during one operating hour. COST SAVINGS The kw calculated above is then referred to Table 4 which indicates the savings per year in dollars. SUMMARY As discussed. all of the above ffve areas can save con~iderable energy. Hence, it is very important that each of the above items be evaluated in detail for both existing and new central chilled water plants. A significant energy and cost savings can be realized by the installation of variable speed pump drives. Standard centrifugal pumps provide nearly the same flow under nll load conditions. Essentially a31 chilled water in excess of that required to meet the load is being pumped unnecessarily through a bypass system. If the chilled water system utilizes three-way valve control, this byoass occurs at the three-way valve. If the system ly two-way valves, the bypass occurs beiupply and return lines, usually near the :er pump. de volume pumping allows the elimination ISS by supplying only enough chilled!et the cooling load. One requirement )le volume system is that control be protwo-way valves. If the existing system tree-way valves, a complete replacement 11d be required. Iergy savings resulting from variable )ing come directly from reducing electric ~mption. Installing variable-speed!ach pump motor makes this possible. leed drive types include, but are not the following : ~riable voltage. Idy current clutch. rdraulic clutch.


4 Figure 1 Effect of Chilled Water on Chiller Coefficient of Performance Figure 2 Chilled Water Reset from Space Figure 3 Chi 1 led Water Reset from Return Water Temperature 10. sm Reduction In condensing Iempernture Figure 4 Effect of Condenser Temperature on Chi 1 ler Coefficient of Performance


5 ESL-HH
 t2) 81 6 486 80 24 1,920.")


6 IA0LE-z OF PVFRAGF YET RlllE T F R F m w F '5 (1) (2) WET BULB OCCURANCE DEGREE HR IEBmma 0 = (1) t2) , , , , , , ,185 27, , , ,584 12, , , , , , , , , , , _1PS , ,846 Figure 5 ESL-HH Condenser Water Reset Thru Wet Bulb Temperature Figure 6 Sequencing of Chillers


7 FIGURE 7 CHILLED WATER SYSTEM OPERATING PROFILE ~ICL-OW~~~ --lnlemh-on-paah -1nlerm.4 Period P*tM Perlod Pmtlod gure 8 Chilled Water Storage Systems Tim* 01 Day Figure 9 Chilled Water Storage Systems


8 I) LOAD RANGE LInwdUm ~UTOTAL Susrora~ GRAND TOTAL (2) HR/YR Low Err. QeEb IA6l.U TANT VS. V w l E PUMPl& X ACTUAL FULL LOAD POWER OPERATING ~m~


9 Figure 10 Chi1 led Water Storage Systems 100% -- *OH.. am -- low.. 10% -- YO* -- Y RPM Flgure 11 Pump Performance Curves