Alternative EAW Form for Animal Feedlots ENVIRONMENTAL ASSESSMENT WORKSHEET
|
|
|
- June Dixon
- 5 years ago
- Views:
Transcription
1
2 Alternative EAW Form for Animal Feedlots ENVIRONMENTAL ASSESSMENT WORKSHEET Note to reviewers: The Environmental Assessment Worksheet (EAW) provides information about a project that may have the potential for significant environmental effects. This EAW was prepared by the Minnesota Pollution Control Agency (MPCA), acting as the Responsible Governmental Unit (RGU), to determine whether an Environmental Impact Statement (EIS) should be prepared. The project proposer supplied reasonably accessible data for, but did not complete the final worksheet. Comments on the EAW must be submitted to the MPCA during the 30-day comment period which begins with notice of the availability of the EAW in the Minnesota Environmental Quality Board (EQB) Monitor. Comments on the EAW should address the accuracy and completeness of information, potential impacts that are reasonably expected to occur that warrant further investigation, and the need for an EIS. A copy of the EAW may be obtained from the MPCA by calling An electronic version of the completed EAW is available at the MPCA Web site 1. Basic Project Information. A. Feedlot Name: MGT Products, LLC, Feedlot Expansion B. Feedlot Proposer: Joe Miller and Mark Throener C. RGU: Minnesota Pollution Control Agency Technical Contact Person Scott Thaden Contact Person Barbara Jean Conti and Title Lead Consultant, Anez Consulting Inc. and Title Project Manager Address th Ave SW Address 520 Lafayette Road North Willmar, MN St. Paul, Minnesota Phone Phone Fax Fax s_anezconsulting@qwest.net barbara.conti@pca.state.mn.us D. Reason for EAW Preparation: (check one) EIS Scoping Mandatory EAW X Citizen Petition RGU Discretion Proposer Volunteered If EAW or EIS is mandatory give EQB rule category subpart number and name: Minn. R , subp. 29.A p-ear1-05 TDD (for hearing and speech impaired only): Printed on recycled paper containing 30% fibers from paper recycled by consumers
3 E. Project Location: County Todd City/Twp Burnhamville SE 1/4 SE 1/4 Section 13 Township 128N Range 32W Watershed (name and 4-digit code): Swan River F. Attach each of the following to the EAW: Exhibit A: Exhibit B: Exhibit C: Exhibit D: Exhibit E: Exhibit F: Exhibit G: County map showing the general location of the project; Site plan showing all significant project and natural features; Map of manure application sites; Map showing all wells, tile inlets, residences, and sensitive receptors within a one-mile radius of the feedlot or on manure land application sites; Air Quality Modeling Report; from the Minnesota Historical Society; and Letter from the Minnesota Department of Natural Resources (DNR). The National Pollutant Discharge Elimination System/State Disposal System (NPDES/SDS) Permit Application and associated documents, including the Air Emissions and Odor Management Plan, the Animal Mortality Plan, the Emergency Response Plan, and the Crop Nutrient Management Plan are available for review by contacting Mr. George Schwint, of the MPCA s Willmar office, at G. Project summary of 50 words or less to be published in the EQB Monitor. MGT Products, LLC, proposes to expand its current feedlot by constructing one 47,000 head grower turkey total confinement barn and one 52,000 head starter turkey total confinement barn in the SE¼ of the SE¼ of Section 13 of Burnhamville Township, Todd County. The final capacity at the site after expansion is 188,450 turkeys or 2,105.1 animal units (AUs). The manure will be of the dry litter type and will be collected on the barn floors. Manure will be removed from the barns each fall, winter, spring, and/or summer, stockpiled, and applied to cropland as fertilizer. H. Please check all boxes that apply and fill in requested data: Animal Type Number Proposed Type of Confinement Finishing hogs Sows Nursery pigs Dairy cows Beef cattle Turkeys expansion of 99,000 Total confinement Layer hens Chickens Pullets Other (Please identify species) (1,106 AUs) MGT Products, LLC, Feedlot Expansion Environmental Assessment Burnhamville Township, Minnesota 2 Worksheet
4 I. Project magnitude data. Total acreage of farm: 301 total (157 tillable, 20 for site) Number of AUs proposed in this project: 1,106 Total AU capacity at this location after project construction: 2,105.1 Acreage required for manure application: 4,540 J. Describe construction methods and timing. MGT Products plans to begin dirt work in the fall of 2007, assuming all applicable permits have been issued. The new grower barn will be constructed first. It will be 64 feet by 1,040 feet with a compacted clay floor and will be constructed first. A starter barn with dimensions of 72 feet by 350 feet is planned within the next 5 years. K. Past and future stages. Is this project an expansion or addition to an existing feedlot? Yes No Are future expansions of this feedlot planned or likely? Yes No If either question is answered yes, briefly describe the existing feedlot (species, number of animals and AUs, and type of operation) and any past environmental review or the anticipated expansion. The current feedlot consists of a grower turkey barn holding 42,450 turkeys (764.1 AUs) and a starter turkey barn holding 47,000 turkeys (235 AUs). The existing grower barn was completed just over one year ago. The feedlot will expand initially by adding another grower barn holding 47,000 turkeys (846 AUs). Eventually, another starter barn holding 52,000 turkeys (260 AUs) will be added. MGT Products produces starter turkeys both for its own use and for sale. The discussion in the remaining sections of the EAW considers the total capacity (existing and proposed) for the facility. 2. Land uses and noteworthy resources in proximity to the site. A. Adjacent land uses. Describe the uses of adjacent lands and give the distances and directions to nearby residences, schools, daycare facilities, senior citizen housing, places of worship, and other places accessible to the public (including roads) within one mile of the feedlot and within or adjacent to the boundaries of the manure application sites. Land surrounding the site is zoned and utilized for agriculture. A number of residences are adjacent to or in proximity of the proposed site, as follows. North one residence (belonging to an owner of the feedlot) approximately 2,600 feet and one neighbor approximately 3800 feet away. The town of Swanville is approximately one mile away. East one neighbor approximately 900 feet and one neighbor approximately 4,500 feet away. Southwest one neighbor approximately 1,200 feet and one neighbor approximately 2,200 feet away. West one neighbor approximately 4,500 feet away. The location of residents in the nearby area has been included within the air quality modeling exercise conducted for this Project (See Exhibit E). There are no additional residences located within the manure application areas as listed in the Manure Management Plan. The Morrison County Line Road is located directly east of the site, State Highway 28 is located directly MGT Products, LLC, Feedlot Expansion Environmental Assessment Burnhamville Township, Minnesota 3 Worksheet
5 west of the site, and 180th Street is located directly south of the site. B. Compatibility with plans and land use regulations. Is the project subject to any of the following adopted plans or ordinances? Check all that apply: local comprehensive plan land use plan or ordinance shoreland zoning ordinance flood plain ordinance wild or scenic river land use district ordinance local wellhead protection plan Is there anything about the proposed feedlot that is not consistent with any provision of any ordinance or plan checked? Yes No. If yes, describe the inconsistency and how it will be resolved. The land identified for this project is zoned for agriculture and the proposer has indicated that it conforms to both Todd and Morrison Counties comprehensive plans and land use ordinances. Are there any lands in proximity to the feedlot that are officially planned for or zoned for future uses that might be incompatible with a feedlot (such as residential development)? Yes No If yes, describe the potentially affected use and its location relative to the feedlot, its anticipated development schedule, and any plans to avoid or minimize potential conflicts with the feedlot. No land has been identified within or around the project area that could create a situation incompatible with a livestock operation. C. Nearby resources. Are any of the following resources on or in proximity to the feedlot, manure storage areas, or within or adjacent to the boundaries of the manure application sites? Drinking Water Supply Management Areas designated by the Minnesota Department of Health? Yes No Public water supply wells (within two miles)? Yes No Archaeological, historical or architectural resources? Yes No Designated public parks, recreation areas or trails? Yes No Lakes or Wildlife Management Areas? Yes No State-listed (endangered, threatened or special concern) species, rare plant communities or other sensitive ecological resources such as native prairie habitat, colonial waterbird nesting colonies or regionally rare plant communities? Yes No Scenic views and vistas? Yes No Other unique resources? Yes No If yes, describe the resource and identify any project-related impacts on the resource. Describe any measures to minimize or avoid adverse impacts. The City of Swanville has two public water supply wells located near the City Garage and east of the garage near Rhoda Ave. Both are approximately 7,850 feet north of the site. The Drinking Water Supply Management Area for Swanville is located approximately 3,000 feet North East of the site. The Clare Johnson-Carl W. Schmidt State Wildlife Management Area is located approximately 1 mile MGT Products, LLC, Feedlot Expansion Environmental Assessment Burnhamville Township, Minnesota 4 Worksheet
6 east of the site. No spreading fields managed by the proposer are in proximity to the WMA. Ganz Lake is located approximately 2,000 feet southeast of the site. Stoll Lake is located approximately 2,500 feet south of the site. Molly Creek is adjacent to and approximately 300 feet from field 9. Molly Creek is not on the 2006 list of impaired waters. Application of manure at agronomic rates and prompt incorporation is expected to prevent or minimize the potential for impacts to Molly Creek. Based on the review of the Minnesota Natural Heritage Database, there are no known occurrences of rare species or native plant communities within an approximate 1 mile radius of the project area. One additional rare species within an approximate 1 mile radius of the manure application area has been identified. This occurs in Pepin Lake in Section 12 of Burnhamville Township, Morrison County, Minnesota. However, the DNR Project Manager indicated that based on the nature and location of the proposed project, the project is not expected to affect any known occurrence of rare features. 3. Geologic and soil conditions. A. Approximate depth (in feet) to: Feedlot Manure Storage Area Manure Application Sites Ground Water (minimum) (average) Bedrock (minimum) >6.5 >6.5 >6.5 (average) B. NRCS Soil Feedlot Manure Storage Area Manure Application Sites Classifications (if known) 204B-Cushing Fine Sandy Loam, 4-8% slope 204B-Cushing Fine Sandy Loam, 4-8% slopes 204B-Cushing Fine Sandy Loam, 4-8% slopes 204C-Cushing Fine Sandy Loam, 8-15% slopes 406B Dorset Sandy Loam, 2-6% slopes C. Indicate with a yes or no whether any of the following geologic site hazards to ground water are present at the feedlot, manure storage area, or manure application sites. Karst features (sinkhole, cave, resurgent spring, disappearing spring, karst window, blind valley, or dry valley) Feedlot Manure Storage Area Manure Application Sites No No No Exposed bedrock No No No Soils developed in bedrock (as No No No shown on soils maps) For items answered yes (in C), describe the features, show them on a map, and discuss proposed design and mitigation measures to avoid or minimize potential impacts. 4. Water Use, Tiling and Drainage, and Physical Alterations. MGT Products, LLC, Feedlot Expansion Environmental Assessment Burnhamville Township, Minnesota 5 Worksheet
7 A. Will the project involve installation or abandonment of any water wells, appropriation of any ground or surface water (including dewatering), or connection to any public water supply? Yes No If yes, as applicable, give location and purpose of any new wells; the source, duration, quantity and purpose of any appropriations or public supply connections; and unique well numbers and the Department of Natural Resources (DNR) appropriation permit numbers, if available. Identify any existing and new wells on the site map. If there are no wells known on-site, explain methodology used to determine that none are present. One well was installed in 2006 on site to provide water for the livestock operation. This well is expected to serve the full capacity of the facility. The unique well ID number for this well is Based on the number of animals and the industry water use standard, it is estimated that the facility will use approximately 4.9 million gallons of water annually. This volume is within the usage rate that qualifies the facility for a Water Appropriation General Permit. The DNR Water Appropriation General Permit number is To be included under the DNR s General Permit , animal feedlots and livestock operations must comply with all conditions and limitations of the DNR permit and meet the following criteria, among others: Operations must have a minimal potential for causing adverse environmental impacts; Water appropriations cannot exceed 5 million gallons per year; and Records of monthly and annual water appropriation volumes must be maintained and submitted to the Department upon request. B. Will the project involve installation of drain tiling, tile inlets or outlets? Yes No If yes, describe. C. Will the project involve the physical or hydrologic alteration dredging, filling, stream diversion, outfall structure, diking, and impoundment of any surface waters such as a lake, pond, wetland, stream or drainage ditch? Yes No If yes, identify water resource affected and give the DNR Protected Waters Inventory number(s) if the water resources affected are on the PWI. Describe proposed mitigation measures to avoid or minimize impacts. 5. Manure management. A. Check the box or boxes below which best describe the manure management system proposed for this feedlot. Stockpiling for land application Containment storage under barns for land application Containment storage outside of barns for land application Dry litter pack on barn floors for eventual land application Composting system Treatment of manure to remove solids and/or to recover energy Other (please describe) B. Manure collection, handling, and storage. MGT Products, LLC, Feedlot Expansion Environmental Assessment Burnhamville Township, Minnesota 6 Worksheet
8 Quantities of manure generated: total: 3,390 tons by Starter Turkeys: 740 tons by Grower Turkeys: 2,650 tons Frequency and duration of manure removal: number of days per cycle Total days per year Up to 20 Up to 4 cycles/yr, up to 5days/cycle Give a brief description of how manures will be collected, handled (including methods of removal), and stored at this feedlot: The barns are bedded with wood chips prior to each new cycle of birds. The manure generated from each cycle is stored in the barn until it is removed and transported to various stockpiling sites and/or crop fields. On the fields outlined in the Manure Management Plan, the manure/bedding mixture (turkey litter) will be surface applied in the spring and/or fall and incorporated within 24 hours. The ownership of the remainder of the litter will be transferred. All rules regarding the transfer of ownership will be followed per Minn. R C. Manure utilization. Physical state of manure to be applied: liquid solid other - describe: D. Manure application. 1. Describe application technology, technique, frequency, time of year and locations. Litter will be scraped and hauled and surface applied at agronomic rates to fields outlined in the MMP utilizing a calibrated box spreader, usually in the fall and spring, and incorporated within 24 hours. The application rate per acre is determined using an average of previous years nutrient content. The application technology, technique, frequency, time of year, and locations of application for the remaining litter will vary depending on where and to whom the litter is transferred. 2. Describe the agronomic rates of application (per acre) to be used and whether the rates are based on nitrogen or phosphorus. Will there be a nutrient management plan? Yes No The turkey litter will be applied at a phosphorus-based rate to the acres identified as being in rotation within the MMP. Field priority will be based on a phosphorus soil test and potassium with the lower levels of these receiving the manure first. Other factors that will determine nutrient needs will be crop grown, yield goal, organic matter content, manure credits, and other legume credits. Nutrient rates for those fields outlined in the MMP will be determined by utilizing University of Minnesota Extension Service bulletin, Fertilizer Recommendations for Agronomic Crops in Minnesota. This procedure has been developed from research as the one that best predicts the amount of nutrients in the soil that can be used by plants. The manure application acres will be soil sampled at least every four years to monitor crops needs and target acres that will positively respond to manure applications and consistent with applicable regulations. The fields managed by the project proposer are in Section 13 of Burnhamville Township and are approximately 157 acres. The total number of acres needed to apply all the manure from the facility is approximately 4,300 acres. The location of the additional acres will vary depending on market needs. Managers of those fields are expected to adhere to state and local requirements for agronomic MGT Products, LLC, Feedlot Expansion Environmental Assessment Burnhamville Township, Minnesota 7 Worksheet
9 application of manure and applicable regulations. 3. Discuss the capacity of the sites to handle the volume and composition of manure. Identify any improvements necessary. It is estimated that after the proposed project, the brooder turkeys will generate 740 tons of litter and the finishing turkeys will generate 2,650 tons of litter. On land outlined in the MMP, the litter will be applied in a manner that does not build up phosphorus over a 6 year period. Application is expected to occur in about 2 years out of 6. In those years, approximately 10% of the litter will be used on land in the MMP and the remainder of the litter ownership will be transferred and transported to other crop fields as per MPCA rules and regulations. In other years, all the litter will be sold. 4. Describe any required setbacks for land application systems. All MPCA/Todd County manure land application setbacks will be observed. These setbacks are summarized in Table 1. Feature Table 1: Land Application Setback Distances (in feet) Winter Non-Winter With Immediate Incorporation (<24 hours) With P Mgmt. No P Mgmt. Non-Winter Not incorporated within 24 hours With Vegetated Buffer Inadequate Vegetated Buffer Lake, Stream Intermittent Stream DNR protected wetlands Drainage ditch w/o quarry Open Tile Intake Well, Mine, or Quarry Sinkhole with no Diversion Downslope - 50 Upslope Downslope - 50 Upslope E. Other methods of manure utilization. If the project will utilize manure other than by land application, please describe the methods. Downslope - 50 Upslope MGT Products, LLC, Feedlot Expansion Environmental Assessment Burnhamville Township, Minnesota 8 Worksheet
10 6. Air/odor emissions. A. Identify the major sources of air or odor emissions from this feedlot. The surfaces of the barns that come into contact with animals and manure, especially the floor, are sources of odor. The manure collection and storage facilities, the dead animal disposal and storage areas, the manure exposed to the air during land application, and livestock are also potential sources of odor. Dust generated by truck traffic around the site can also contribute to odor. Another possible odor source is the incineration of any animal mortalities. However, this method of disposal has been in use at this site for some time and is not anticipated to cause any adverse effects in the future. B. Describe any proposed feedlot design features or air or odor emission mitigation measures to be implemented to avoid or minimize potential adverse impacts and discuss their anticipated effectiveness. The facility is a total confinement operation; thus odors are mitigated by reducing the surface area of manure exposed to the atmosphere. In addition, all of the total confinement barns utilize wood chips as bedding. Litter utilized in the MMP will be incorporated immediately during the spring and fall months. Required setbacks will be observed from nearby residences for manure application. Weather conditions, primarily wind speed/direction and humidity will be evaluated before manure is land applied to insure minimal impacts on neighbors and the public. C. Answer this item only if no feedlot design features or mitigations were proposed in item 6.B. Provide a summary of the results of an air emissions modeling study designed to compare predicted emissions at the property boundaries with state standards, health risk values, or odor threshold concentrations. The modeling must incorporate an appropriate background concentration for hydrogen sulfide to account for potential cumulative air quality impacts. Air quality computer modeling was performed that estimated concentrations in the air of Hydrogen Sulfide (H 2 S), Ammonia (NH 3 ), and selected odorous gases from nearby existing feedlots and the expanded MGT Products facility. The model estimated pollutant concentrations from the facility and ambient H 2 S and NH 3 background concentrations at the property line and nearest neighbors. Air quality modeling estimated odorous gas concentrations and odor intensities at the property lines for the expanded MGT Products feedlot and at 49 of the expanded feedlot s nearest neighbors. In addition to the expanded feedlot, the modeling also considered the emissions from eight existing turkey feedlots as well as typical background levels. The modeling results indicate that the proposed project will comply with the ambient air quality standard for hydrogen sulfide and will not create exceedences of the inhalation health risk values for ammonia or hydrogen sulfide. While the modeling does indicate detectable concentrations of odorous gases can exist beyond the property line, the intensities were less than the threshold for very faint odors. MGT Products, LLC, Feedlot Expansion Environmental Assessment Burnhamville Township, Minnesota 9 Worksheet
11 D. Describe any plans to notify neighbors of operational events (such as manure storage agitation and pump out) that may result in higher-than-usual levels of air or odor emissions. An Air Emissions and Odor Management Plan has been prepared as part of the NPDES Permit Application, along with a Complaint Response Protocol. The producers do not plan to notify neighbors prior to operational events such as manure storage, barn cleanout, and land application, but they have indicated that they are willing to work around planned social events. E. Noise and dust. Describe sources, characteristics, duration, quantities or intensity and any proposed measures to mitigate adverse impacts. The loudest noise generated at the facilities is due mainly to truck traffic entering and leaving the site. The separation distance between the residences and the facilities is the primary mitigation factor in noise abatement. 7. Dead Animal Disposal Describe the quantities of dead animals anticipated, the method for storing and disposing of carcasses, and frequency of disposal. A predicted mortality rate of 10 percent from each barn is expected at the facility. Mortalities will be removed and disposed of as they are discovered. Mortalities will be incinerated at the site following the Minnesota Board of Animal Health guidelines. An Animal Mortality Plan has been prepared as part of the NPDES Permit Application. 8. Surface Water Runoff. Compare the quantity and quality of site runoff before and after the project. Describe permanent controls to manage or treat runoff. Livestock Production Site Surface water runoff will increase on the site due to an increase in impervious surfaces from approximately 1.5 acres to approximately 3 acres, in particular the construction of roofed buildings. However, it is unlikely that this runoff will come into contact with livestock or its manure. The contractor and engineer will be responsible for managing surface water runoff during construction. A stormwater pollution prevention plan is included in the engineering plans and specifications that will address the requirements for both temporary and permanent stormwater management. Permanent stormwater retentions ponds will provide infiltration/filtration before stormwater leaves the feedlot site. Land Application Sites The land application of manure if improperly applied can adversely impact surface water resources through manure-laden runoff or manure residue leaching into drain tile lines that outfall to surface waters. The project contains land application areas that are located within the Swan River Watershed. The specific subwatersheds where acres were identified for land application were reviewed to evaluate runoff and surface water quality. It is important to note that the sub-watersheds have been farmed for several decades. The change in stormwater runoff characteristics (physically and chemically) from the project land application areas is expected to remain the same and, under certain circumstances, may improve as a result of the land application activities regulated under the MPCA NPDES/SDS Permit. The potential improvements would occur by developing better soil tilth through the use of organic fertilizer and the uniform practice of incorporating manure over the acres identified in the MMP. MGT Products, LLC, Feedlot Expansion Environmental Assessment Burnhamville Township, Minnesota 10 Worksheet
12 The potential impact to surface water resources from the project s land application activities is not expected to create a significant impact for the following reasons. As discussed in Item 5 of the EAW, manure will be incorporated into the soil at agronomic rates, meaning that only the amount of manure which can be used by the growing crop as nutrient will be applied. The agronomic rate is based on the type of crop grown, the soil type and the soil chemistry. The information presented in Item 5 will be incorporated into the MMP for the proposed project. The MMP will be an enforceable provision of the NPDES/SDS Feedlot Permit for the project. 9. Traffic and Public Infrastructure Impacts. A. Estimate the number of heavy truck trips generated per week and describes their routing over local roads. Describe any road improvements to be made. The proposers estimate that one feed truck per day will visit the site, as well as 4-6 employee vehicles per day. No road improvements are expected to be needed. B. Will new or expanded utilities, roads, other infrastructure, or public services be required to serve the project? Yes No If yes, please describe. 10. Permits and approvals required. Mark required permits and give status of application: Unit of government Type of Application Status MPCA NPDES Permit (Individual Feedlot) Application submitted MPCA Minnesota Feedlot Permit (General) MPCA NPDES Construction Stormwater Permit Existing MPCA Notification/Status Change for Underground Storage Tanks County Minnesota Feedlot Permit County/twp/city Conditional use or other land use permit Pending DNR Water Appropriation Existing Other* 11. Other potential environmental impacts, including cumulative impacts. If the project may cause any adverse environmental impacts not addressed by items 1 to 10, identify and discuss them here, along with any proposed mitigation. This includes any cumulative impacts caused by the project in combination with other existing, proposed, and reasonably foreseeable future projects that may interact with the project described in this EAW in such a way as to cause cumulative impacts. Examples of cumulative impacts to consider include air quality, stormwater volume or quality, and surface water quality. (Cumulative impacts may be discussed here or under the appropriate item(s) elsewhere on this form.) Surface Water Quality: Land application of manure can be a concern with respect to water quality. The MPCA s Impaired Waters Database was reviewed to determine whether the facility could contribute to any existing impaired surface waters or add to the total maximum daily load (TMDL) for surface waters in the watershed. The Project (proposed facility and land application areas) lies within the Swan River Watershed. There is one water body that appears on the TMDL 303d Impaired Waters List (TMDL List); the Swan River. The Swan River is impaired for low oxygen and mercury (fish consumption advisory) and is approximately one-and onehalf miles from the site at its closest point. MGT Products, LLC, Feedlot Expansion Environmental Assessment Burnhamville Township, Minnesota 11 Worksheet
13 The Project operators will follow the MPCA-approved MMP, which is designed to protect water resources and will be an enforceable part of the Project s NPDES Permit. Because of the existing concern with low oxygen, it is important to understand that even if a small amount of the manure that is land applied is washed off in some fashion, water quality standards may be violated. This highlights the importance of identifying all conduits to surface water and making sure setbacks and other protective measures are observed. The protective measures include: construction of a permanent stormwater basin that will allow sediment to settle out prior to discharge; manure incorporation within 24 hours, rather than surface application without incorporation; land application at rates that do not exceed crop nutrient needs, thereby reducing or eliminating the possibility that excess nutrients will reach the water resources; and setback distances to sensitive receptors. Table 1, in Section 4 of the EAW, shows the applicable MPCA and Todd County land application setback distances, which, if properly implemented, will prevent the operation of the Project from resulting in a significant environmental impact on water quality. In addition, the below barn manure storage areas are specifically designed to completely confine the manure and prevent any seepage into ground or surface waters. A search of the MPCA s data identified eleven other feedlots in Burnhamville Township. Manure application from these facilities is expected to confirm with state and local requirements as described above. As a result, the extent of any potential cumulative effects to surface water quality that are reasonably expected to occur as part of this proposed project should be minimal. Turkey litter is not a source of mercury contamination, so no significant impact is expected from the Project related to mercury contamination. Manure Management of Transferred Manure Because turkey litter is a relatively dry product, it can be shipped more easily than other types of manure. When ownership of manure is transferred, the feedlot owner is responsible for providing the recipient with state requirements concerning soil testing, rate limits, seasonal restrictions, setbacks, keeping records and reporting spills. The cropland manager who receives transferred manure must adhere to state and local requirements and conduct manure management planning and recordkeeping that is specific to the fields and crops. Ground Water Appropriation To be included under the DNR s General Permit , animal feedlots and livestock operations must comply with all conditions and limitations of the DNR permit and have minimal potential for causing adverse environmental impacts. Air Quality: The air modeling study that was conducted included other nearby feedlots and background ambient concentrations. A background concentration is the amount of pollutants already in the air from other sources. It is used in this evaluation to address cumulative air impacts. Air emissions from other emission sources (e.g., other feedlots or land application activities) may affect the compliance status of the Project, or impact downwind human and environmental receptors. The background level for H 2 S that was used in the computer model was derived from ambient air quality monitoring at other feedlot facilities in Minnesota. The modeling adds the background air pollutant concentration to the emission concentration predicted from the Project and eight nearby feedlots. The results of the modeling study indicate that air quality standards and inhalation health risk values are expected to be met. MGT Products, LLC, Feedlot Expansion Environmental Assessment Burnhamville Township, Minnesota 12 Worksheet
14

15 EXHIBIT A

16 EXHIBIT B
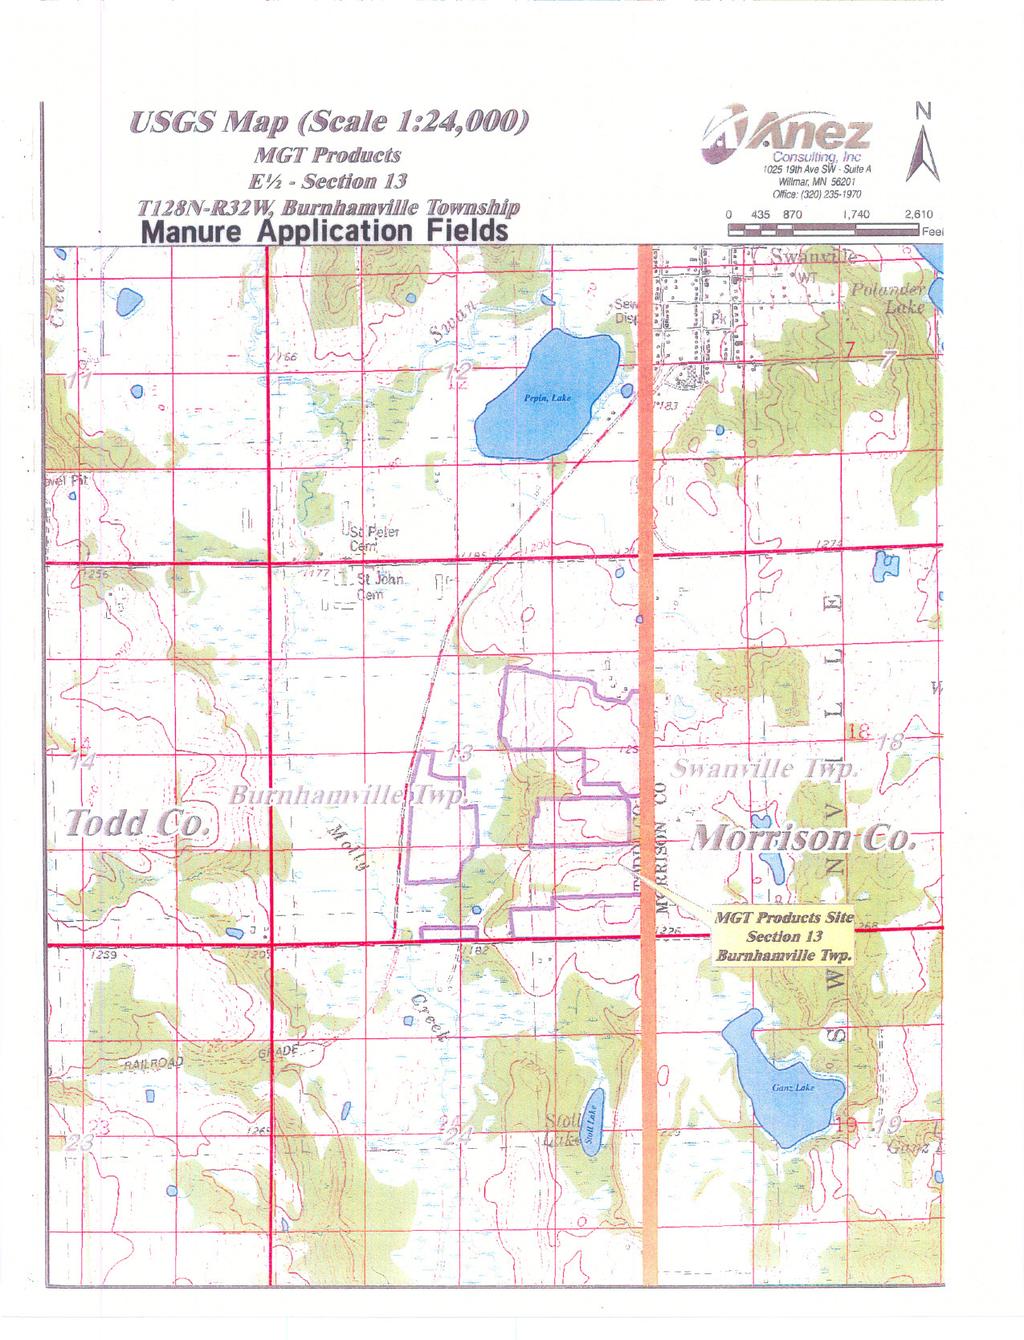
17 EXHIBIT C

18 EXHIBIT D
19 EXHIBIT E Air Quality Modeling Report M.G.T. Products LLC Proposed Turkey Feedlot Expansion Todd County Burnhamville Township SE Section 13 August 2007
20 Table of Contents Introduction... 1 General Modeling Approach... 4 Site Descriptions... 9 MGT Turkey Feedlot... 9 Turkey Feedlot # Turkey Feedlot # Turkey Feedlot # Turkey Feedlot # Turkey Feedlot # Turkey Feedlot # Turkey Feedlot # Turkey Feedlot # Gas Emission Rates Hydrogen Sulfide at Property Lines and Neighbors Ammonia at Property Lines and Neighbors Odorous Gas Concentrations at Property Lines and Neighbors Odor Intensities at Property Lines and Neighbors Summary... 32
21 Introduction Air quality modeling estimated odorous gas concentrations and odor intensities at the property lines for the expanded M.G.T. Products LLC (MGT) turkey feedlot and at 49 of the expanded feedlot s nearest neighbors. Presently, the feedlot consists of a single brooder barn. The proposed expansion would add of a second brooder barn and two grower barns. In addition to the expanded MGT turkey feedlot, the modeling also considered the gaseous emissions from eight existing turkey feedlots. The locations of the MGT turkey feedlot and the eight neighboring turkey feedlots are provided in Figure 1. The following odorous gas concentrations and odor intensities were calculated: 1. the maximum hourly hydrogen sulfide concentration at the property lines for the expanded turkey feedlot to assess the potential to comply with Minnesota s ambient air quality standard for hydrogen sulfide of 30 ppb (v/v); 2. the maximum 13-week time-averaged hydrogen sulfide concentration at 49 of the expanded turkey feedlot s nearest neighbors to assess the potential to exceed Minnesota s subchronic inhalation Health Risk Value (ihrv) of 10 g/m 3 ; 3. the maximum hourly ammonia concentration at the property lines for the expanded turkey feedlot to assess the potential to exceed Minnesota s acute ihrv for ammonia of 3,200 g/m 3 ; 4. the maximum annual-averaged ammonia concentration at 49 of the expanded turkey feedlot s nearest neighbors to assess the potential to exceed Minnesota s chronic ihrv for ammonia of 80 g/m 3 ; 5. the hourly odor intensities at the property lines for the expanded turkey feedlot and at 49 of the expanded turkey feedlot s nearest neighbors to access the potential for off-site odor episodes. The above calculations were performed using the CALPUFF air quality model, based on 5 years of historical meteorological data. 1 MGT Turkey Feedlot Report

22 Figure 1. Modeled locations of the MGT turkey feedlot and the eight neighboring turkey feedlots. 2 MGT Turkey Feedlot Report
23 The CALPUFF modeling results suggest that the expanded MGT turkey feedlot will comply with the Minnesota ambient air quality standard for hydrogen sulfide. CALPUFF predicted a maximum hourly property-line hydrogen sulfide concentration of 5.91 ppb (v/v). When a background concentration of 17 ppb (v/v) is added to the CALPUFF prediction, the maximum property-line hydrogen sulfide concentration is ppb (v/v), which is below the ambient standard of 30 ppb (v/v). The CALPUFF results indicate that the expanded MGT turkey feedlot and the eight neighboring turkey feedlots will not create exceedences of the subchronic hydrogen sulfide ihrv at the neighboring residences. The estimated maximum 13-week time-averaged hydrogen sulfide concentration for the feedlots neighbors is 0.86 g/m 3. When a background concentration of 1.00 g/m 3 is added to the CALPUFF estimate, the maximum 13-week neighbor hydrogen sulfide concentration is 1.86 g/m 3, which is below the subchronic hydrogen sulfide ihrv of 10 g/m 3. The modeling results also suggest that the expanded MGT turkey feedlot will not create exceedences of the acute ammonia ihrv. CALPUFF predicted a maximum hourly property-line ammonia concentration of 320 g/m 3. When a background concentration of 148 g/m 3 is added to the CALPUFF prediction, the maximum property-line ammonia concentration is 468 g/m 3, which is below the acute ammonia ihrv of 3,200 g/m 3. The CALPUFF results indicate that the expanded MGT turkey feedlot and the eight neighboring turkey feedlots will not create exceedences of the chronic ammonia ihrv at the neighboring residences. The estimated maximum one-year time-averaged ammonia concentration for the feedlots neighbors is g/m 3. When a background ammonia concentration of 5.72 g/m 3 is added to the CALPUFF estimate, the maximum annual ammonia concentration for a neighbor is g/m 3, which is below the chronic ammonia ihrv of 80 g/m 3. Thus, the modeling results suggest compliance with the hydrogen sulfide air quality standard, no exceedences of the subchronic hydrogen sulfide ihrv, and no exceedences of the acute and chronic ammonia ihrvs. 3 MGT Turkey Feedlot Report
24 General Modeling Approach The modeling considered the gaseous emissions from the expanded MGT turkey feedlot and the eight neighboring turkey feedlots as the only significant and quantifiable emission sources within a 3-mile by 3-mile grid. The air quality impacts associated with the MGT feedlot and the eight neighboring feedlots were explicitly modeled. The expanded MGT feedlot was located in middle square mile of the grid. The air quality impacts associated with any other sources in the modeled 3-mile by 3-mile grid were considered implicitly as contributors to the background concentrations that are added to the modeling results. Hence, the background concentrations of hydrogen sulfide and ammonia include the impacts associated with sources such as small feedlots, septic tank vents, fertilizer and manure application to cropland, and wetlands. The CALPUFF (version 6.112, level ) air quality model 1,2,3 was used to estimate the property-line and nearest-neighbor odorous gas concentrations. The estimated concentrations were based on historical wind speeds, wind directions, atmospheric stabilities, and rural mixing heights. The historical weather data consisted of five years ( ) of surface meteorological data and upper air data from the National Weather Surface station in Huron, South Dakota. The surface and upper air weather data were combined into an ISC-type meteorological file by the U.S. Environmental Protection Agency s (EPA s) PCRAMMET software. 4 The surface and upper air weather data sets were obtained from the EPA s Support Center for Regulatory Air Models. 5 Maximum one-hour, 13-week, and annual average concentrations were calculated. Rural dispersion coefficients were used to characterize atmospheric mixing. The modeling assumed no decay of any modeled gas due to chemical reactions. The modeled receptor height was 0 meters, i.e., ground level. A flat terrain was assumed. All modeled property-line and nearest-neighbor receptors were defined as discrete receptors. Property-line receptors were less than or equal to 25 meters apart. An arbitrary Cartesian coordinate system (x, y) was used with the southwest corner of Section 13 (Burnhamville Township, Todd County) as the origin (0, 0). Positive values 1 U.S. EPA A User s Guide for the CALPUFF Dispersion Model. U.S. Environmental Protection Agency, Office of Air Quality Planning and Standards, Research Triangle Park, NC, EPA-454/B Scire J. S., Strimaitis D. G., and Yamarino R. J A User s Guide for the CALPUFF Dispersion Model (Version 5). Earth Tech, Inc., Concord, MA. 496 pp. 3 U.S. EPA Revision to the Guideline for Air Quality Models. 40 CFR Ch. 1, Part 51, Appendix W (April 15, 2004 Edition). 4 U.S. EPA PCRAMMET User s Guide. U.S. Environmental Protection Agency, Office of Air Quality Planning and Standards, Research Triangle Park, NC. EPA-454-B (Revised June 1999) MGT Turkey Feedlot Report
25 of x represent distance east of the origin. Positive values of y represent distance north of the origin. To assess the potential for environmental impacts, the hydrogen sulfide concentrations, ammonia concentrations, and odor intensities generated by the air quality modeling were compared to air quality standards, inhalation Health Risk Values (ihrvs), published odor threshold concentrations, and reported odor intensity correlations. The direct comparison of model-generated concentrations and odor intensities to these environmental threshold values did not consider the impact of different averaging times. EPA guidelines do not allow concentrations to be time averaged for time periods less than an hour. 6 This is important because the Minnesota ambient air quality standards for hydrogen sulfide are based on average concentrations over a 30-minute time period and because odor intensity correlations are often based on instantaneous measurements. For example, an hourly model-generated hydrogen sulfide concentration of 29 ppb (v/v) may contain a half-hour average concentration that exceeds the 30 ppb standard. Also, an odor intensity that an odor panelist may find to be merely detectable in a short-term field measurement could be annoying if present for an hour or longer. The background concentrations of hydrogen sulfide and ammonia provided in Table 1 were added to the CALPUFF estimated concentrations as described in EPA guidelines. 7 The listed concentrations represent background concentrations for rural Minnesota. The listed 17-ppb background hydrogen sulfide concentration is appropriate when assessing a feedlot s potential to comply with the 30-ppb standard. A background concentration of 18 ppb should be used in assessing the potential to comply with the 50-ppb hydrogen sulfide standard. The background concentrations listed in Table 1 are not the time-averaged concentrations obtained from monitoring. Instead, the listed concentrations reflect the monitored data expressed in the terms of the exceedence or violation condition for the corresponding ihrv guideline or ambient standard. For example, the background 208-ppb ammonia concentration for the acute ammonia ihrv represents the maximum hourly concentration that occurred within the entire length of monitoring. This is the appropriate interpretation of background for the acute ammonia ihrv, because the guidance is concerned with any potential exceedence of the ihrv. Also, the 17-ppb hydrogen sulfide background represents the third highest 30-minute concentration that occurred within any 5-day period. This is appropriate, because the ambient hydrogen 6 U.S. EPA Revision to the Guideline for Air Quality Models. 40 CFR Ch. 1, Part 51, Appendix W (April 15, 2004 Edition). 7 Ibid. 5 MGT Turkey Feedlot Report
26 sulfide standard defines a violation as the third exceedence of 30-ppb within any 5-day period. Table 1. Background concentrations. Gas Hourly Background Concentration 13-Week Background Concentration Annual Background Concentration Hydrogen Sulfide 17 ppb (v/v) (24.3 g/m 3 ) 0.70 ppb (v/v) (1.00 g/m 3 ) Not Required Ammonia 208 ppb (v/v) (148 g/m 3 ) Not Required 8.07 ppb (v/v) (5.72 g/m 3 ) To assess the potential for odor episodes, the estimated atmospheric concentrations of hydrogen sulfide and ammonia were compared to each gas s reported odor threshold concentration. The odor threshold concentration is defined as the gas-phase concentration at which 50 percent of the population can detect the gas s odor. For this presentation, odor number is defined as the ratio of the estimated atmospheric concentration for a specific odorous gas divided by the gas s odor threshold concentration. An odor number equal to 1 suggests that 50 percent of the population can detect the estimated atmospheric concentration for a specific gas. An odor number greater than 1 suggests that more than 50 percent of the population can detect the gas, while a value less than 1 indicates that less than 50 percent of the population can detect the gas. Typically, an odor number below about 0.1 suggests that less than 1 percent of the population can detect the gas. 8 The odor threshold concentrations used in this assessment are presented in Table 2. 8 Nagy G. Z The odor impact model. Journal of Air & Waste Management Association 41(10): MGT Turkey Feedlot Report
27 Table 2. Odor threshold concentrations for the modeled gases. 9 Odorous Gas Odor Threshold Concentration (ppb, v/v) Hydrogen Sulfide 3.7 Ammonia 1,500 The CALPUFF-generated odor intensities (expressed as detection-threshold odor units) were compared to the reference odor intensities provided in Table 3. An odor intensity of 72 detectionthreshold odor units (OU) is defined as a faint odor and is the odor intensity that an average person might detect the odor if attention is called to the odor, but the odor would not otherwise be noticed Minnesota Environmental Quality Board A Summary of the Literature Related to the Social, Environmental, Economic and Health Effects: Volume 2. Generic Environmental Impact Statement on Animal Agriculture, Prepared by the University of Minnesota, September Table 2 presents the geometric mean of the lower and upper odor threshold concentrations obtained from this reference. 10 Jacobson L. D. and Guo H Odor from feedlots setback estimation tool (OFFSET). In: Livestock and Poultry Odor Workshop II, Dept. of Biosystems & Agricultural Engineering, University of Minnesota, St. Paul, MN, 39 pp. 7 MGT Turkey Feedlot Report
28 Table 3. Odor intensity classification. 11 Odor Intensity Number Odor Strength n-butanol Reference Solution (ppm) Detection-Threshold Odor Units (OU, D/T) 0 no odor very faint faint moderate 2, strong 6, very strong 20,250 1, Jacobson L. D. et al Development of an odor rating system to estimate setback distances from animal feedlots: odor for feedlots setback estimation tool (OFFSET). Final Report. Prepared by the Department of Biosystems and Agricultural Engineering, University of Minnesota, St. Paul, MN. 26 pp. 8 MGT Turkey Feedlot Report
29 Site Descriptions MGT Turkey Feedlot The MGT feedlot presently consists of a single brooder barn that houses 47,000 birds under 5 pounds. The proposed expansion would add a 40,000-head brooder barn and two 42,450-head (over 5 pounds) grower barns. The physical characteristics of the MGT turkey barns are provided in Table 4. The barns were characterized as line sources. The separation distances between the four barns are provided in Figure 2. The modeled locations of the barns are provided in Figure 3. The setback distances from the property lines range from 105 feet to 2,905 feet. The air quality modeling estimated the atmospheric gas concentrations at the 49 neighboring residences shown in Figure 4. Table 4. Dimensions of the MGT turkey barns. Brooder #2 is the existing turkey barn. The other three turkey barns are proposed. Turkey Length (feet) Width (feet) Height (feet) Brooder # Brooder # Grower #1 1, Grower #2 1, MGT Turkey Feedlot Report
30 N W E S Brooder #1 (proposed) Brooder #2 (existing) 150' Grower #1 (proposed) 150' 105' Grower #2 (proposed) 150' 326' (5247', 33') Figure 2. Modeled emission sources for the expanded MGT turkey feedlot. The blue squares are the locations of the square volume subsources used to characterize the emissions from the turkey barns. The solid red line represents portions of the feedlot s east and south property lines. 10 MGT Turkey Feedlot Report
31 2739' N W E S 2905' 3927' 105' 2234' (1743', 33') 326' 3504' Figure 3. Modeled barn locations and property lines for the expanded MGT turkey feedlot. 11 MGT Turkey Feedlot Report

32 Figure 4. Modeled locations for the MGT turkey feedlot and for 49 of the feedlot s nearest neighbors. 12 MGT Turkey Feedlot Report
33 Turkey Feedlot #1 Turkey Feedlot #1 consists of two turkey barns. The physical characteristics of the feedlot s barns are provided in Table 5. The barns were modeled as line sources. The modeled locations of the turkey barns are provided in Figure 5. Table 5. Dimensions of the barns at Turkey Feedlot #1. Turkey Length (feet) Width (feet) Height (feet) # # MGT Turkey Feedlot Report
34 713' N W E 250' S 542' #2 1028' #1 257' 250' 230' 250' (0', 9160') Figure 5. Modeled emissions sources for Turkey Feedlot #1. 14 MGT Turkey Feedlot Report