Finding Pennsylvania s Solar Future. 5 th Stakeholder Meeting March 8, 2018 Pittsburgh
|
|
|
- Herbert Anthony
- 5 years ago
- Views:
Transcription
1 Finding Pennsylvania s Solar Future 5 th Stakeholder Meeting March 8, 2018 Pittsburgh


2 Overview How modeling is used to support the study Executive Summary modeling results What makes PA Solar Future viable? Example of customer economics, implications for incentives David G. Hill, Ph.D. Distributed Resources Director Damon Lane Lead Analyst Kate Desrochers Senior Analyst

3 The purpose of models is not to fit the data but to sharpen the questions -Samuel Karlin
4 Finding Pennsylvania's Solar Future Research objectives Convene and engage stakeholders for analytically-based discussions and reporting on Pennsylvania s Solar Future Scenarios consider solar in context of total energy economy Initial Solar scenario is 10% of in-state sales by 2030 Transparent accounting compare energy flows, costs and other impacts between scenarios Support workgroups: Regulatory and ratemaking Markets and business models Operations and Interconnection Multi-audience reporting and communications
5 Finding PA Solar Future Modeling Activities June meeting: 1. Reference and initial Solar scenarios 2. Familiarize workgroups with model, results, output capabilities, and stakeholders ability to provide input and feedback 3. Detailed module review - identify questions, recommendations for additional data or analysis September meeting: 1. Results for Reference and initial solar scenarios 2. Cost/Benefit initial results, import/export balance, power dispatch, land use 3. Key questions for future modeling specify additional scenarios December meeting: 1. Review the scenarios and combinations 2. Energy results Economic results Environmental results 3. Sensitivities to be included in report March meeting: 1. Discuss modeling as it supports study and strategies 2. Review sources and assumptions 3. Review results and implications for strategies

6 Changes since September meeting: Trued up historic solar growth through 2017 Refined projected solar growth curve slower at first, faster later Revised costs to start with PA-specific data from OpenPV, and transition to national pricing by 2030 as the market grows Added effect of PA sales tax and Federal tariff Added grid upgrade cost Added health impact benefits Calculated customer economics, incentive levels, bill impacts Antioch College
7 Executive Summary Modeling Results Main scenario definitions Reference Scenario Solar A Solar B Overall Target 0.5% solar by % in-state solar by % in-state solar by 2030 Total Solar Capacity in GW 11 GW 11 GW Distributed Capacity in GW 3.9 GW (35% of total) ½ residential and ½ commercial 1.1 GW (10% of total ) ½ residential and ½ commercial Grid Scale Capacity (>3MW) in 2030 Alternative Energy Portfolio Standard (AEPS) 0.6 GW 7.1 GW (65% of total) 9.9 GW (90% of total) Assumes AEPS efficiency trends continue support beyond 2020 Assumes AEPS efficiency trends continue support beyond 2020 Assumes AEPS efficiency trends continue support beyond 2020 Federal ITC Modeled as a reduction in installed costs. Phase out by 2023 Modeled as a reduction in installed costs. Phase out by 2023 Modeled as a reduction in installed costs. Phase out by 2023

8 Executive Summary Modeling Results Solar capacity by scenario and scale PA Solar Future scenarios have 10x reference Both cases rely for majority on grid scale solar

9 Executive Summary Modeling Results Solar capacity by year and scale in Solar A
10 Viability? Economically Land Use Integration Jobs
11 Economic Benefit Cost Results Cumulative cost and benefits relative to reference scenario Cumulative Costs and Benefits Relative to Reference scenario Solar A Solar B Cost or (Savings) Billions of 2017 USD, discounted at 3.75% Transformation Transmission and Distribution Electricity Generation Resources Production Externalities not included NPV (society)

12 Economic Benefit Cost Results Difference in generation between Solar A and reference
13 Scale of net investment Scenario investments compared to historic energy expenditures
14 Modeling findings: Customer s perspective economics Residential system in Philadelphia in 2025 Looking for 10 year pay back, as an indicator of wide market acceptance What SREC price provides that? Residential Installation Cost of PA ($/w) 2.5 (Assumed) PV System Size (kw) 7.5 Total Installation Cost $18,750 (Assume ITC=0%) Assumed Solar Generation Factor (kwh/kw/yr) 1.2 Projected Annual Solar Generation 9,000 Assumed Full Retail Electric Rate ($/kwh) 0.15 Annual Electric Bill Savings $1,350 Assumed SREC Life = Target Payback (yrs) 10 Annual SREC Payment for Payback Target $525 (Backcalculated) SREC Price to Achieve Target Payback ($/SREC) $58 Customer s NPV after 20 years $7, % discount rate
15 Modeling findings: rate impact Using SREC just determined, find rate impact to average residential bill 2025 PA Electric Sales (Assumed) 150,000,000 MWh 2025 Solar Share Requirement (Assumed) 0.04 (4% in 2025) 2025 SREC Requirement (Calculated) 6,000,000 MWh (= SRECs) Assumed SREC Price in 2025 (Only PA SRECs) $58 (from previous) Total Cost to Purchase SRECs in 2025 $350,000,000 Bill line item cost for purchasing 2025 SRECs $ $/kwh Typical PA Residential Customer Usage 10,000 kwh/yr kwh/month Residential bill increase for 2025 SREC costs $1.94 per month $23.33 per year

16 Viability of Potential Rate Impact SREC payments compared to historic electricity spending
17 Modeling findings: customer economics Parameter analysis to consider different inputs Increasing precision: Account for panel degradation Account for income tax on SREC income Account for annualized maintenance costs Varying the inputs: Today s estimated installed, higher and lower ± $0.50/W in five steps Recent SREC prices and higher $6/MWh - $100/MWh in five steps Systems simulated (different costs, generation, rates) Residential and Commercial in Pittsburgh and Philadelphia Grid scale outside Philadelphia
18 Modeling findings: customer economics Parameter analysis to consider different inputs Parameter analysis results: what SREC level is necessary for a 10 year payback, given current today s costs and rates? Location Scale Retail Rate ($/kwh) SREC for 10 year payback Philadelphia Residential $75/MWh Pittsburgh Residential $100/MWh Philadelphia Commercial $100/MWh Pittsburgh Commercial $30/MWh Southeast Grid scale 0.072* $100/MWh * This is a PPA price, not a retail rate
19 Modeling input: solar prices Historic PA: OpenPV National historic and projections: LBL Tracking the Sun 10, NREL 2017 ATB
20 Viability Land Impact Assumes 100% of grid supply PV is ground mounted, 10% of residential, and 50% of commercial Assumes 8 acres per MW 10% of electricity from PV requires about 1% of the area used by farms Many counties have more land area in farms than the entire state s PV requires
, 2017 2030.")
21 Viability Land Impact Kristen Ardani, Jeffrey J. Cook, Ran Fu, and Robert Margolis Cost Reduction Roadmap for Residential Solar Photovoltaics (PV), Golden, CO: National Renewable Energy Laboratory. NREL/TP-6A
22 Viability Grid Integration Luckow, Patrick, Tommy Vitolo, and Joseph Daniel, A Solved Problem: Existing measures provide low-cost wind and solar integration. Synapse Energy Economics, Cambridge MA.
23 Modeling input: health impacts Added costs for CO2, SO2, and NOx according to Fig 4 Buonocore et al (Nature 2015, doi: /nclimate2771) Pollutant Impact Cost Cost Units Carbon Dioxide 47 USD/metric tonne Nitrogen Oxides 10 Kilogram Sulfur Dioxides 20 Kilogram
24 Economic Benefit Cost Results with health and environmental effects Cumulative cost and benefits relative to reference scenario Cumulative Costs and Benefits Relative to Reference scenario Solar A Solar B Cost or (Savings) Billions of 2017 USD, discounted at 3.75% Transformation Transmission and Distribution Electricity Generation Resources Production Externalities NPV (society)

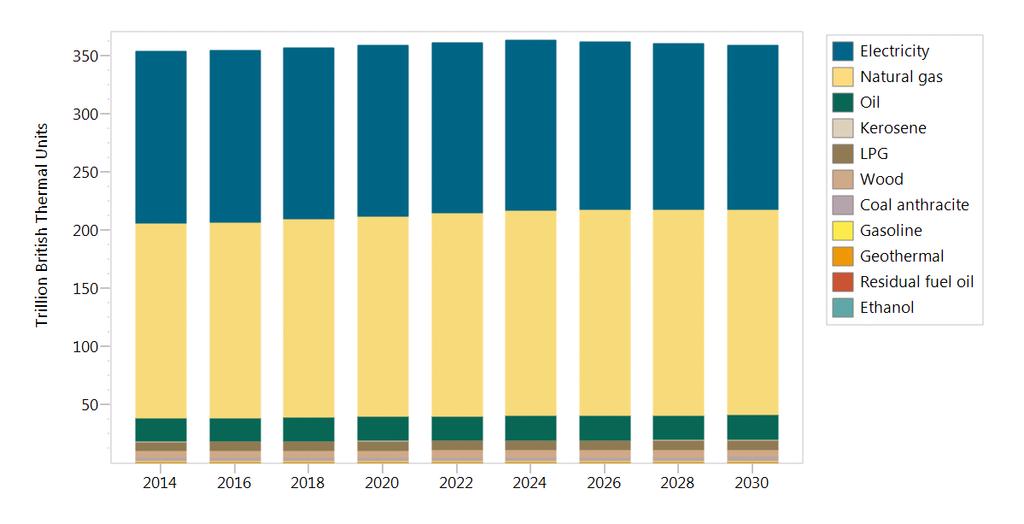
25 Alternative Scenarios Total Energy Use by Scenario by Fuel (TBtu)
26 Alternative Scenarios Difference in total energy spending by scenario 3.0% Change in Annual Energy Spending 2.5% 2.0% 1.5% 1.0% 0.5% 0.0%

27 Strategies and Modeling Viability Estimated impacts Identification of barriers and or missing data Place in common context and framework a big picture Sensitivities
28 Thank You! Discussion & Questions David Hill (802) Damon Lane (802) g Kate Desrochers (802) Kdesrochers@veic.org
 Decades of use in > 190")

29 LEAP System Long-range Energy Alternatives Planning System Transparent accounting framework Developed by Stockholm Environment Institute (SEI) Decades of use in > 190 countries Scenario based: self-consistent story lines of how an energy system might evolve over time Introductory page on SEI s website: ion=introduction
30 Building the Reference scenario Why create this scenario? Model reflects historical data and projects business-as-usual Used as a baseline to compare scenario results What are the sources? Energy Data: Energy Information Administration (EIA): State Energy Data System, Residential Energy Consumption Survey (RECS), Annual Energy Outlook (AEO) Economic Demographic Data: Census/American Community Survey (ACS), PA Department of Labor and Industry, Center for Rural Pennsylvania How is the scenario defined, what are the assumptions? Meets AEPS in 2021 Solar and efficiency continue current trends CAFE standards met for Light Duty Vehicles Federal Tax Credits sunset
31 Building the initial Solar scenario Initial Solar scenario is built upon the Reference scenario 1. Energy, economic and demographic sources and references are the same in both scenarios 2. Energy demand results are therefore the same 3. Increases solar to meet 10% of electric in-state consumption by Half utility-scale and half distributed solar by 2021
32 Total Solar Capacity in Megawatts 10x more solar capacity by 2030 in Solar scenario compared to Reference 14,000 12,000 Solar grows 10x faster in solar scenario 10% 10,000 8,000 6,000 4,000 2, % Reference scenario Solar scenario
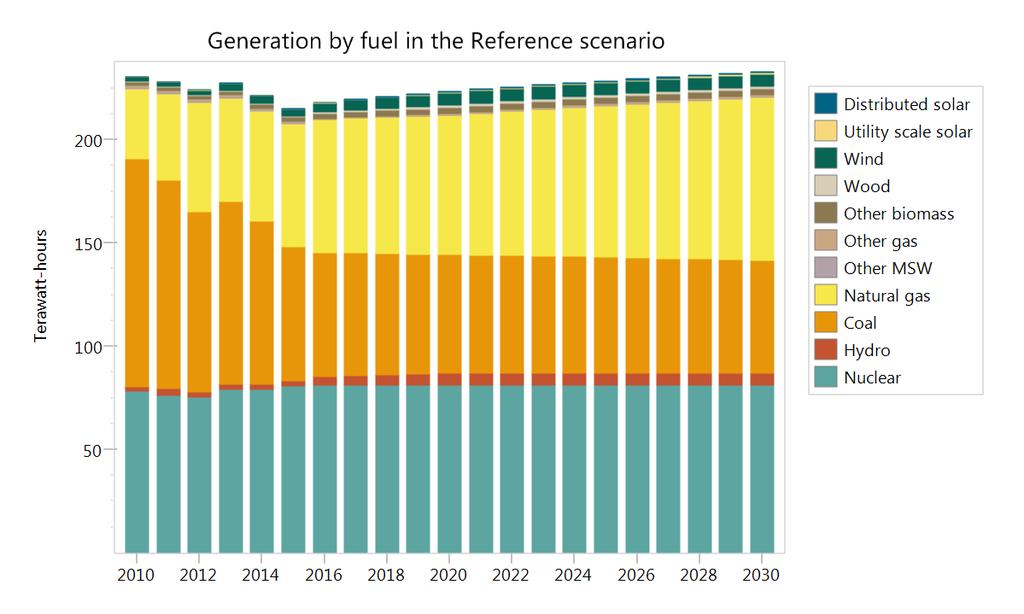
33 Growing solar production offsets electric generation from coal and natural gas

34 Growing solar production offsets electric generation from coal and natural gas
35
36
37 Demand driven
38 Total energy use relatively level Presentation title to go here
39 Electricity is 1/5 of total energy consumption Presentation title to go here

40 Electricity is 1/5 of total energy consumption Presentation title to go here
41 Total energy use relatively level Presentation title to go here


42 Residential energy dominated by heating Presentation title to go here

43 Commercial energy Presentation title to go here

44 Projected employment drives increase demand
45 Industrial demand increases by 10%

46 Value of shipments drives increased demand

47 Structural shift in energy required for industry Presentation title to go here

48 Transportation becomes more efficient and begins to electrify

49 Resources Transformation Demand driven
50 Solar capacity grows in both scenarios, 10x more in the solar scenario
51 Scenario and modeling questions: 1. Drivers Higher/lower activity levels? 2. Efficiency trends of Act 129 continue beyond Should efficiency increase or slow down? 3. Load growth vehicle electrification is low. Higher levels? Space conditioning growth or electrification? 4. Exports electricity exports grow back to 80 TWh per year Alternatives? Should exports grow? 5. What other solar scenarios should we look at? 6. Nuclear market or retirement based reductions in outputs? 7. Other
52 Key modeling questions for today s breakout sessions

53 Key modeling questions for today s breakout sessions Should there be more efficiency? What if wind grew to 10% of in-state sales too? Natural gas is growing as a heating fuel. Will geothermal or new cold climate heat pumps complement or compete with gas? Are electric vehicles about to take off? What if they grow faster than we project?
54 Should there be more efficiency? Ramp up from 0.8% per year to 2%? In some or all of the scenarios?
55 What if wind grew to 10% of in-state sales too? Wind currently grows 7.8% per year until 2021 to meet AEPS, then stops from 1.3 GW (2.5% of sales) in 2015 to 1.85 GW (3.5%) in 2021 Grow wind to meet 10% of in-state electricity in 2030? That would require about 5.2 GW of capacity 10% year-over-year growth would get there There are 7 GW of viable sites in the NREL Eastern Wind Dataset
 TRG1 7.7-13.5 8.8 TRG2 7.5-10.4 8.3 TRG3 7.3-10.5 8.1 TRG4 7.1-10.1 7.9 TRG5 6.8-9.5 7.5 TRG6 61. - 9.4 6.9 TRG7 5.3-8.3 6.2 TRG8 4.7-6.6 5.5 TRG9 4.1-5.7 4.8 TRG10 1.6-5.1 4.")
56 Electricity generation characterization wind CF: 31%, 2,700 kwh/kw CAPEX: $1,678/kW O&M: $51/kW year LCOE:$64/MWh Techno- Resource Group (TRG) Wind Speed Range (m/s) Weighted Average Wind Speed (m/s) TRG TRG TRG TRG TRG TRG TRG TRG TRG TRG
57 Will cold climate/geothermal heat pumps have an impact? PA home heating is 51% natural gas, 22% electricity, 18% oil, 4% propane, 5% other The trend is for gas to expand and replace the others But, Gas lines do not and will not reach everyone Electricity already reaches practically everyone New cold climate heat pumps work down to -20 F They are selling quickly in Maine and Vermont and some are installed as the sole source of heat, though many homes retain their old system for backup. Geothermal heat pumps have been shown to be cost effective in PA, especially in new construction and commercial installations

58 Heat pumps and gas have comparable operating costs Assumptions: Existing system efficiencies: oil: 85%, propane: 87%; new systems efficiencies: gas 90%, heat pump 2.8 COP Fossil fuel costs from 2017 AEO, volumetric electricity costs in USD/kWh: 0.11 for residential and 0.08 for commercial

59 Percent of light duty vehicle energy Are electric vehicles about to take off? What if they grow faster than we project? In the graph at right, EVs grow according to these annual rates: : 30% per year : 50% per year : 8% per year Gasoline Ethanol Electricity Diesel Biodiesel Grow faster at first to account for near zero initial market share? Grow to replace most gasoline by 2050? :100% : 20% : 10%