Pressure Distribution Systems
|
|
|
- Sharyl Terry
- 5 years ago
- Views:
Transcription
1 Pressure Distribution Systems Roxanne Groover Florida Onsite Wastewater Association Website Version Oct
2 2
3 3
4 How does dosing effect drainfield longevity? Designed to use entire drainfield each dose Alternately wet and dry conditions Biomat is partially consumed as oxygen is drawn down behind wetting front Can accept many times more pounds of BOD per sq ft of surface (Hargett, 1984) 4
5 Why use a pump? Required by 64E-6, Florida Administrative Code for large drainfields (over 1000 sq. ft total required area). To overcome a low plumbing stubout or elevation/distance challenges on a lot. Code calls this lift dosing. To control peak loading stress (e.g., Church, Flea Market). Establishments with high strength wastes to spread the biological loading to enhance exposure to bacteria for quick removal. 5
6 Warning!!! Tank watertightness is a must! Exfiltration pollutes the groundwater. Infiltration burns up the pump and overloads the drainfield. In some states, all mounded drainfields are pressure dosed. 6
7 Conventional Gravity Distribution Creeping failure principle. Entire flow out the nearest and lowest holes. Locally clog the bottom beneath that hole. Begin to spread out laterally along the bottom Once entire bottom surface clogged, begins to rely on using the sidewall. 7
8 Once we rely on sidewall, which type of a gravity system is superior, a bed or a trench? 8
9 Example Bed System Four bedroom home (400 gpd) Subsurface aggregate bed 12 deep 30 ft long Loamy Fine Sand (0.35 gpd/ft 2 ) GIVEN: 40% pore space, ignore pipe, 1 cubic ft equals 7.5 gallons FIND: TOTAL STORAGE VOLUME IN THE DRAINFIELD 9
10 Example Bed System solution Area = Q (gpd) LTAR (gpd/ft 2 ) Area = 400 gpd 0.35 gpd/ft 2 = 1143 ft 2 Volume = Area (ft 2 ) x Depth (ft) Volume = 1143 ft 2 x 1 ft thick = 1143 ft 3 Void volume = volume (ft 3 ) x % pore space Void volume = 1143 ft 3 x 0.40 = 457 ft 3 Total Storage Volume = VV(ft 3 ) x 7.5 G/ft 3 Total Storage Volume (in gallons) 457ft 3 x 7.5 gallons/ft 3 = 3429 gallons 10
11 Bed System Safety factor against surge overload If the above drainfield was dry, but all bottom and sidewall surfaces were clogged, how many days could it accept this home s effluent? 11
12 Bed System Safety factor against surge overload - solution Total Storage volume = 3429 gallons Daily Estimated Sewage flow = 400 gpd Safety Factor = 3429 gal/400 gpd = 8.6 days 12
13 Sidewall Safety factor against Clogged bottom surface If the the bottom surface of the example bed drainfield was completely clogged, how many gallons of effluent would have to pass through the sidewall per day per linear foot of sidewall to keep this home s effluent from surfacing? 13
14 Bed System Safety factor against clogged bottom surface - solution Let bed width = 30 ft Bed length= 1143ft 2 /30 ft = 38 ft Bed perimeter = 30ft + 38ft + 30ft + 38ft = 136 linear ft Sidewall infiltration rate = 400 gpd/136 ft =2.94 gal/ linear ft/day At 12 deep drainfield=ltar of 2.94 gallons per sq ft per day 14
15 Example Trench System Four bedroom home (400 gpd). Subsurface aggregate 12 deep 36 wide. Loamy Fine Sand (0.65 gpd/ft 2 ). GIVEN: 40% pore space, ignore pipe, 1 cubic ft equals 7.5 gallons. FIND: TOTAL STORAGE VOLUME IN THE DRAINFIELD. 15
16 Example Trench System solution Area = Q (gpd) LTAR (gpd/ft 2 ) Area = 400 gpd 0.65 gpd/ft 2 = 615 ft 2 Volume = Area (ft 2 ) x Depth (ft) Volume = 615 ft 2 x 1 ft thick = 615 ft 3 Void volume = volume (ft 3 ) x % pore space Void volume = 615 ft 3 x 0.40 = 246 ft 3 Total Storage Volume = VV(ft 3 ) x 7.5 G/ft 3 Total Storage Volume (in gallons) 246 ft 3 x 7.5 gallons/ft 3 = 1846 gallons 16
17 Trench System Safety factor against surge overload If the above drainfield was dry, but all bottom and sidewall surfaces were clogged, how many days could it accept this home s effluent? 17
18 Trench System Safety factor against surge overload - solution Total Storage volume = 1846 gallons Daily Estimated Sewage flow = 400 gpd Safety Factor = 1846 g/400 gpd = 4.6 days 18
19 Sidewall Safety factor against Clogged bottom surface If the the bottom surface of the example trench drainfield was completely clogged, how many gallons of effluent would have to pass through the sidewall per day per linear foot of sidewall to keep this home s effluent from surfacing? Assume three trenches. Include the ends of the trenches in the calculation 19
20 Trench System Safety factor against clogged bottom surface - solution Total drainfield area= 615 ft 2 Total drainfield length = 615 ft 2 /3ft = 205 ft Sidewalls = 205 ft x 2 = 410 linear ft Endwalls = 6 ends x 3 ft = 18 linear ft Total perimeter = 410 ft + 18 ft = 428 linear ft Sidewall infiltration rate = 400 gpd/428 linear ft =0.93 gal/ linear ft/day At 12 depth=ltar of 0.93 gallons per sq ft per day 20
21 Comparison Data BED SYSTEM 2.94 gal/linear ft 8.57 days storage TRENCH SYSTEM 0.93 gal/linear ft 4.62 days storage 21
22 What pumpers need to know about dosing systems Do not leave dosing tanks bone dry (float) Will suck in sediment first time used (pump mounted on blocks helps prevent this) Turn off, pump chamber dry and refill to top of pump casing at least If pump is exposed corrosive gases can attack the metal Make sure low level cutoff is above casing of pump Effluent surrounding pump keeps the pump cool 22
23 By placing 100% of the pump housing under effluent 100% of the time - you will double the effective pump life Chuck Schwabe Zoeller Pump Company 23
24 What Installers need to know about dosing systems Not as simple as picking up a sump pump at the local discount hardware store Horsepower is not the key Determine GPM and Total Dynamic Head, then compare to published pump curves Small design improvements have big payoffs: --put check valve in vertical leg of discharge pipe --drill a drain hole in bottom of each line of drainfield pipe furthest from the pump 24
25 What Installers need to know about dosing systems (pg 2 of 2) If tank is not watertight, during high water conditions you are pumping and treating the effluent plus any rainwater that finds its way into the system Check pipe penetrations, risers & lids for complete watertight seal Including gate or ball valves at key points gives flexibility in dealing with problems More small design improvements have big payoffs: --set pump beneath four blocks, not just one --use true union connectors so can pull pump easily --use float tree, don t strap floats to pump discharge pipe 25
26 Let s Talk Design 26
27 Considerations Many design preferences involved Two competent designers can come up with very different solutions Sometimes external forces push solution, e.g. Site constraints Availability or cost of materials Owners suggestions 27
28 Steps in Sizing Low Pressure Distribution Networks Determine estimated sewage flow (64E-6, Table I) Determine soil textural classification and ESHWT (field, site/soil evaluation) Use to determine maximum sewage loading rate(s) in trench and bed configurations (64E-6, Table III & mound) 28
29 Selecting Pipe Networks: Header line sizing Lateral line sizing Hole diameters and hole spacing-very important Transmission line sizing Total dynamic head=static head + frictional head + working head Pump selection 29
30 Supplemental Handouts 1. Scouring gal/min for various diameters 2. Discharge rates for various hole diameters 3. Friction loss in various pipe diameters 4. Friction loss for fittings worksheet example 5. Volume per foot for various pipe diameters 6. Dosing system decision tree 7. Tank sizes and LTAR excerpts from rule 8. Pump curve 30
31 Scouring Velocity If flow inside pipe gets too slow suspended materials in pipe get left behind Called stranding solids Will eventually clog network If flow at 2 ft / sec or higher will eject suspended solids with the fluids 31
32 Minimum gpm to achieve scouring velocity (2 ft/sec) for common pipe diameters equation: (d 2 ) = GPM Pipe Diameter (in.) Nominal (actual) Minimum GPM Actual (use) 0.50 (.622) 1.89 (2) 0.75 (.824) 3.32 (4) 1.00 (1.049) 5.39 (6) 1.25 (1.380) 9.32 (10) 1.5 (1.610) (13) 2.0 (2.067) (21) 2.5 (2.469) (30) 3.0 (3.068) (46) 4.0 (4.026) (80) 32
33 Discharge rates for various sized holes at various pressures (in gpm) Operating head 1 ft (0.43 psi) 2 ft (0.87 psi) 3 ft (1.30 psi) 4 ft (1.73 psi) 5 ft (2.17 psi) 3/32 1/8 5/32 3/16 7/32 1/4 5/16 3/8 7/
34 Friction Loss in Schedule 40 Plastic Pipe, C = 150 (Feet / 100 Feet) f/n:head loss in pipe-01.xls Flow gallons Pipe Diameter (inches) per nominal minute actual Low Velocity Excessive Head Loss
35 35
36 Volume of effluent per foot of pipe length (in gallons) equation:.0408 (d 2 ) = gallons Pipe Diameter (in.) Nominal (actual) Volume per foot (gallons) 0.50 (.622) (.824) (1.049) (1.380) (1.610) (2.067) (2.469) (3.068) (4.026)

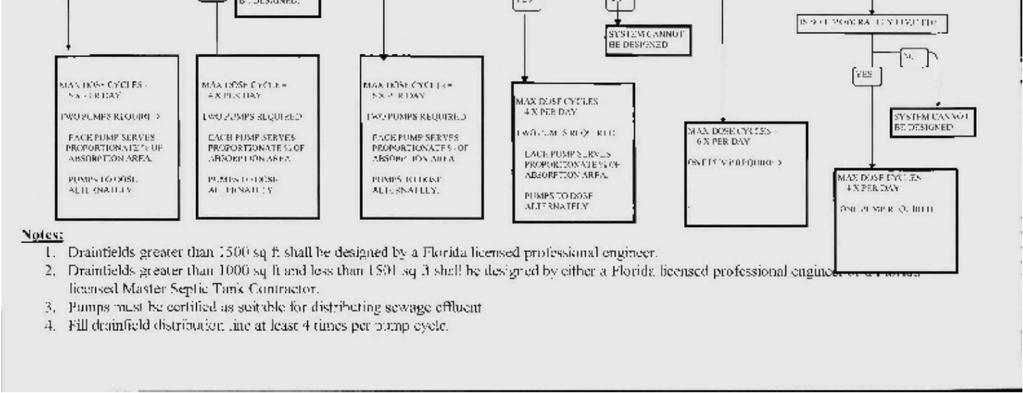
37 Dosing Tree 37
38 Average Sewage Flow (gpd) Table II - Septic/pump tank Septic Tank effective capacity (gallons) capacity Residential Pump Tank effective capacity (gallons) Commercial Pump Tank effective capacity (gallons)
39 PUMP must reach capacity against Total Dynamic Head Total Dynamic Head = Static Head, plus Friction Head, plus Operating Head TDH = SH +FH+OH 39
40 Static Head Also known as elevation head. The vertical distance from off point of pump (or lowest water level in pump chamber) to the point of discharge, usually the header pipe. NOTE: if lines are not level, choose the highest point (why?) 40
41 Friction Head Resistance to flow of fluid against side walls of pipes and fittings. Friction Head a function of: Pipe diameter (smaller, more friction) Capacity (more flow, more friction) Configuration (+fittings, more friction) Pipe materials (PVC, Steel, Cast Iron) Age (older more friction) why? 41
42 Friction Head Represented as equivalent length of pipe, As if you could remove the fitting and replace it with a length of straight pipe with the same friction loss Table A in SSPMA handout 42
43 43
44 Frictional Loss Worksheet 720 Gallon per day bed system Fitting Size Qty X Equivalent = Total Total Length per fitting per location LOCATION: (ft) (ft) pump well: pipe 2" 5.00 GPM check valve 2" 1.00 union 2" 1.00 gate valve 2" ell 2" 1.00 transmission line pipe 2" GPM 45 ell 2" 1.00 ======= header: pipe 3" GPM 90 ell 3" 2.00 Tee's 3" 6.00 ======= lateral pipe 1.25" use only 1 line ======= GPM 44
45 Operating Head Pressure desired at the holes (orifices) How high the water rises in a standpipe at the distal lateral hole location. 1-3 ft is reasonable to keep holes clear Placing the furthest hole pointing down allows flow to drain to end of lines when pump kicks off, also drains off solids 45
46 With TDH & Pump Capacity Locate point on pump curve Pumps vary + 10% from published values Use a pump curve slightly above and to the right of point plotted 46
47 Pump Curve 47
48 Select Central or End manifold Central manifold - discharge laterals arranged off both sides (letter H ) End manifold - looks like a typical trench system (letter E ) With the same system size, central manifolds have half the length of discharge laterals, but twice the number of laterals 48
49
50
51 Steps in sizing low pressure distribution networks (cont.) Determine the number of doses per rule. Moderately limited soil = maximum of 2. Slightly limited soil = maximum of 6. Calculate volume per dose by 64E-6. Calculate volume required to fill the laterals one time Calculate number of pipe fills per dose. Rule requires minimum of 4. 51
52 Steps in sizing low pressure distribution networks (cont.) Finally, review your design EPA tables assume 10 fills/cycle 64E-6 requires 4 fill/cycle 64E-6 slightly limited soils maximum of 6 doses per 24 hours, moderately limited soils maximum of 2 doses per 24 hour PE can specify more frequent doses, but not less than one fill per cycle Determine pump chamber size per 64E-6 Table II 52
53 Let s Try A Design Steps will be listed in following slides Examples in class/test could be: Bed or trench Side or end manifold Residential or commercial Various soils Various GPD 53
54 Website Example A (varies) gallon per day (bed/trench) Onsite Sewage Treatment and Disposal System serves a (residential/commercial)waste establishment. The soil is a (varies). The system site has an estimated seasonal high water table of (varies) inches below grade at the drainfield location. GIVEN: (varies) gpd system (varies) configuration (varies) soil 54
55 Website Example What is the proper size of the septic tank? From 64E-6 Table II What is the proper size of the pump tank? From 64E-6 Table II Residential or commercial 55
56 Average Sewage Flow (gpd) Table II - Septic/pump tank Septic Tank effective capacity (gallons) capacity Residential Pump Tank effective capacity (gallons) Commercial Pump Tank effective capacity (gallons)
57 Website Example What is the long term acceptance rate (LTAR) of the effluent passing through the infiltrative bottom surface of drainfield? GIVEN: (varies) soil From 64E-6 soil chart in example is for mounds please be aware that is not the only chart available and be sure to use correct one depending on type of system (subsurface, filled, or mound) 57
58 58
59 Website Example What is the total drainfield area? Estimated Sewage Flow/LTAR From 64E-6 59
60 Website Trench Example (Different from beds) Choose a desired width & # of trenches This is typically chosen by designer In class instructor/class will choose What is trench length? Area of drainfield/trench width/# of trenches 1250/3/8 = 52 ft - #5 60
61 Website Example Choose a hole diameter and spacing Choose a distal operating head How many holes are there in each lateral? Trench Length/hole spacing 61
62 Website Example What is the discharge rate through each 7/32 hole? Use chart 62
63 Discharge rates for various sized holes at various pressures (in gpm) Operating head 3/32 1/8 5/32 3/16 7/32 1/4 5/16 3/8 7/16 1 ft (0.43 psi) ft (0.87 psi) ft (1.30 psi) ft (1.73 psi) ft (2.17 psi)
64 Website Example What is the discharge through each lateral? # of holes x discharge rate per hole 64
65 Website Example What is the lateral diameter: From chart What is the flow per system? Flow per lateral x total number of trenches 65
66 Friction Loss in Schedule 40 Plastic Pipe, C = 150 (Feet / 100 Feet) f/n:head loss in pipe-01.xls Flow gallons Pipe Diameter (inches) per nominal minute actual Low Velocity Excessive Head Loss
67 Website Example End Connection or Center Connection? What is the manifold diameter? From chart 67
68 Friction Loss in Schedule 40 Plastic Pipe, C = 150 (Feet / 100 Feet) f/n:head loss in pipe- Flow gallons Pipe Diameter (inches) per nominal minute actual Low Excessive Head Loss
69 Frictional Loss Calculation Total Dynamic Head (TDH)= Static Head + Frictional Head + Operating Head 69
70 Website Example Pump Selection Static Head The elevation from the discharge port at the pump to the drainfield (from site plan notes) 70
71 Website Example Pump Selection Frictional Head Use chart to determine frictional losses 71
72 72
73 ??? Gallon per day?? system Fitting Size Qty X Equivalent = Total Length per fitting LOCATION: (ft) pump well: pipe?? GPM check valve union gate valve 90 ell transmission line pipe?? GPM 45 ell ======= header: pipe?? GPM 90 ell Tee's ======= lateral pipe?? GPM ======= 73
74 Website Example Pump Selection Operational Head GIVEN: from initial design 74
75 Website Example Pump Selection Total Dynamic Head (TDH) Static Head + Frictional Head + Operating Head Pump Selection?? ft of head - #16 75
76 Website Example Check number of fills What is the volume per linear foot of lateral line (from table)? 76
77 Volume of effluent per foot of pipe length (in gallons) equation:.0408 (d 2 ) = gallons Pipe Diameter (in.) Nominal (actual) Volume per foot (gallons) 0.50 (.622) (.824) (1.049) (1.380) (1.610) (2.067) (2.469) (3.068) (4.026)
78 Total volume Website Example volume per linear foot * # of laterals * length of lateral There will be? dose cycles per day Use 64E-6 to help w/# of dose cycles What is the volume per dose? Flow/# of doses 78
79 Website Example How many line fills will there be? Dose Volume/Total Lateral Volume Does this meet code requirements? Must be at least 4 fills according to 64E-6 79